HIV-1 diversity in an antiretroviral treatment naïve cohort from Bushbuckridge, Mpumalanga Province, South Africa
- PMID: 25889106
- PMCID: PMC4340098
- DOI: 10.1186/s12985-015-0244-1
HIV-1 diversity in an antiretroviral treatment naïve cohort from Bushbuckridge, Mpumalanga Province, South Africa
Abstract
Background: South Africa has a generalized and explosive HIV/AIDS epidemic with the largest number of people infected with HIV-1 in the world. Molecular investigations of HIV-1 diversity can help enhance interventions to contain and combat the HIV/AIDS epidemic. However, many studies of HIV-1 diversity in South Africa tend to be limited to the major metropolitan centers and their surrounding provinces. Hardly any studies of HIV diversity have been undertaken in Mpumalanga Province, and this study sought to investigate the HIV-1 diversity in this province, as well as establish the occurrence and extent of transmitted antiretroviral drug resistance mutations.
Methods: HIV-1 gag p24, pol p10 and p66/p51, pol p31 and env gp41 gene fragments from 43 participants were amplified and sequenced. Quality control on the sequences was carried out using the LANL QC online tool. HIV-1 subtype was preliminary assigned using the REGA 3.0 and jpHMM online tools. Subtype for the pol gene fragment was further designated using the SCUEAL online tool. Phylogenetic analysis was inferred using the Maximum Likelihood methods in MEGA version 6. HIV-1 antiretroviral drug resistance mutations were determined using the Stanford database.
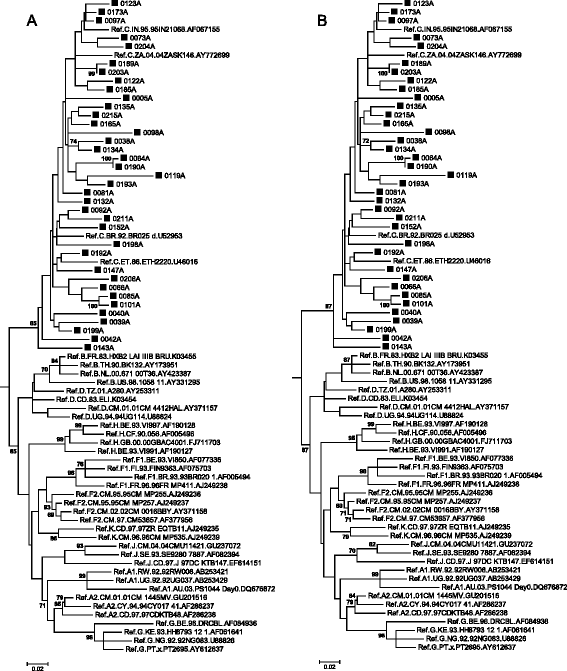
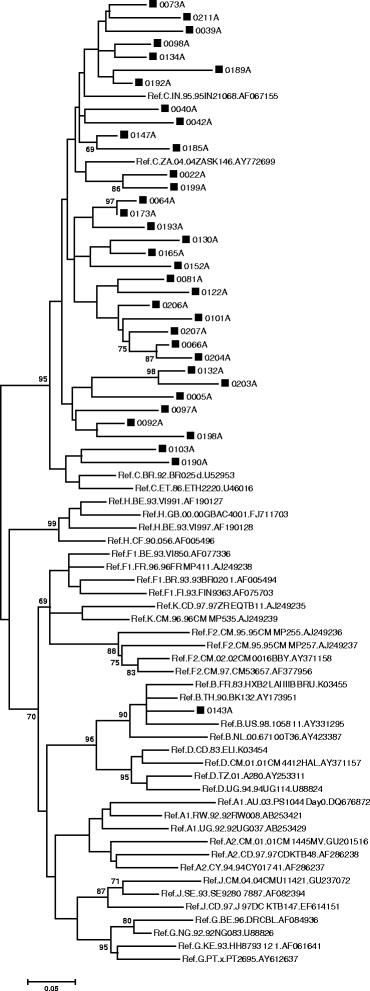
Results: Phylogenetic analysis using Maximum Likelihood methods indicated that all sequences in the study clustered with HIV-1 subtype C. The exception was one putative subtype BC unique recombinant form. Antiretroviral drug resistance mutations K103N and E138A were also detected, indicating possible transmission of anti-retroviral drug resistance mutations.
Conclusions: The phylogenetic analysis of the HIV sequences revealed that, by 2009, patients in the Bushbuckridge, Mpumalanga were predominantly infected with HIV-1 subtype C. However, the generalized, explosive nature of the HIV/AIDS epidemic in South Africa, in the context of extensive mobility by South Africans who inhabit rural areas, renders the continued molecular monitoring and surveillance of the epidemic imperative.
Figures


Similar articles
-
HIV-1 subtypes B and C unique recombinant forms (URFs) and transmitted drug resistance identified in the Western Cape Province, South Africa.PLoS One. 2014 Mar 7;9(6):e90845. doi: 10.1371/journal.pone.0090845. eCollection 2014. PLoS One. 2014. PMID: 24609015 Free PMC article.
-
Prevalence of antiretroviral drug resistance mutations and HIV-I subtypes among newly-diagnosed drug-naïve persons visiting a voluntary testing and counselling centre in northeastern South Africa.J Health Popul Nutr. 2011 Aug;29(4):303-9. doi: 10.3329/jhpn.v29i4.8444. J Health Popul Nutr. 2011. PMID: 21957668 Free PMC article.
-
HIV type 1 diversity and antiretroviral drug resistance mutations in Burundi.AIDS Res Hum Retroviruses. 2007 Jan;23(1):175-80. doi: 10.1089/aid.2006.0126. AIDS Res Hum Retroviruses. 2007. PMID: 17263648
-
HIV infection in India: epidemiology, molecular epidemiology and pathogenesis.J Biosci. 2008 Nov;33(4):515-25. doi: 10.1007/s12038-008-0070-3. J Biosci. 2008. PMID: 19208977 Review.
-
Impact of human immunodeficiency virus (HIV) subtypes on HIV-associated neurological disease.J Neurovirol. 2007 Aug;13(4):291-304. doi: 10.1080/13550280701422383. J Neurovirol. 2007. PMID: 17849313 Review.
Cited by
-
Trends in Pretreatment HIV-1 Drug Resistance in Antiretroviral Therapy-naive Adults in South Africa, 2000-2016: A Pooled Sequence Analysis.EClinicalMedicine. 2019 Mar 18;9:26-34. doi: 10.1016/j.eclinm.2019.03.006. eCollection 2019 Mar. EClinicalMedicine. 2019. PMID: 31143879 Free PMC article.
-
Characterization of HIV-1 Integrase Gene and Resistance Associated Mutations Prior to Roll out of Integrase Inhibitors by Kenyan National HIV-Treatment Program in Kenya.Ethiop J Health Sci. 2020 Jan;30(1):37-44. doi: 10.4314/ejhs.v30i1.6. Ethiop J Health Sci. 2020. PMID: 32116431 Free PMC article.
-
HIV Drug Resistance in Antiretroviral Treatment-Naïve Individuals in the Largest Public Hospital in Nicaragua, 2011-2015.PLoS One. 2016 Oct 13;11(10):e0164156. doi: 10.1371/journal.pone.0164156. eCollection 2016. PLoS One. 2016. PMID: 27736898 Free PMC article.
-
Molecular Epidemiology and Trends in HIV-1 Transmitted Drug Resistance in Mozambique 1999-2018.Viruses. 2022 Sep 9;14(9):1992. doi: 10.3390/v14091992. Viruses. 2022. PMID: 36146798 Free PMC article.
-
HIV-1 diversity among young women in rural South Africa: HPTN 068.PLoS One. 2018 Jul 5;13(7):e0198999. doi: 10.1371/journal.pone.0198999. eCollection 2018. PLoS One. 2018. PMID: 29975689 Free PMC article. Clinical Trial.
References
-
- Barré-Sinoussi F, Chermann JC, Rey F, Nugeyre MT, Chamaret S, Gruest J, Chamalet S, Gruest J, Dauguet C, Axler-Blin C. Isolation of a T-lymphotropic retrovirus from a patient at risk for acquired immune deficiency syndrome (AIDS) Science. 1983;220:868–871. doi: 10.1126/science.6189183. - DOI - PubMed
-
- UNAIDS: The gap report. Geneva 2014. http://www.unaids.org/en/resources/documents/2014/name,97466,en.asp
-
- Shisana O, Rehle T, Simbayi LC, Zuma K, Jooste S, Zungu N, Labadarios D, Onoya D, Van Zyl J, Wabiri N. South African National HIV prevalence, incidence and behaviour survey, 2012. Cape Town: HSRC Press; 2014. - PubMed
Publication types
MeSH terms
Substances
Grants and funding
LinkOut - more resources
Full Text Sources
Other Literature Sources
Medical
Molecular Biology Databases

