

Attenuation of acute stroke injury in rat brain by minocycline promotes blood-brain barrier remodeling and alternative microglia/macrophage activation during recovery
- PMID: 25889169
- PMCID: PMC4340283
- DOI: 10.1186/s12974-015-0245-4
Attenuation of acute stroke injury in rat brain by minocycline promotes blood-brain barrier remodeling and alternative microglia/macrophage activation during recovery
Abstract
Background: Minocycline reduces reperfusion injury by inhibiting matrix metalloproteinases (MMPs) and microglia activity after cerebral ischemia. Prior studies of minocycline investigated short-term neuroprotective effects during subacute stage of stroke; however, the late effects of minocycline against early reperfusion injury on neurovascular remodeling are less well studied. We have shown that spontaneous angiogenesis vessels in ischemic brain regions have high blood-brain barrier (BBB) permeability due to lack of major tight junction proteins (TJPs) in endothelial cells at three weeks. In the present study, we longitudinally investigated neurological outcome, neurovascular remodeling and microglia/macrophage alternative activation after spontaneous and minocycline-induced stroke recovery.
Methods: Adult spontaneously hypertensive rats had a 90 minute transient middle cerebral artery occlusion. At the onset of reperfusion they received a single dose of minocycline (3 mg/kg intravenously) or a vehicle. They were studied at multiple time points up to four weeks with magnetic resonance imaging (MRI), immunohistochemistry and biochemistry.
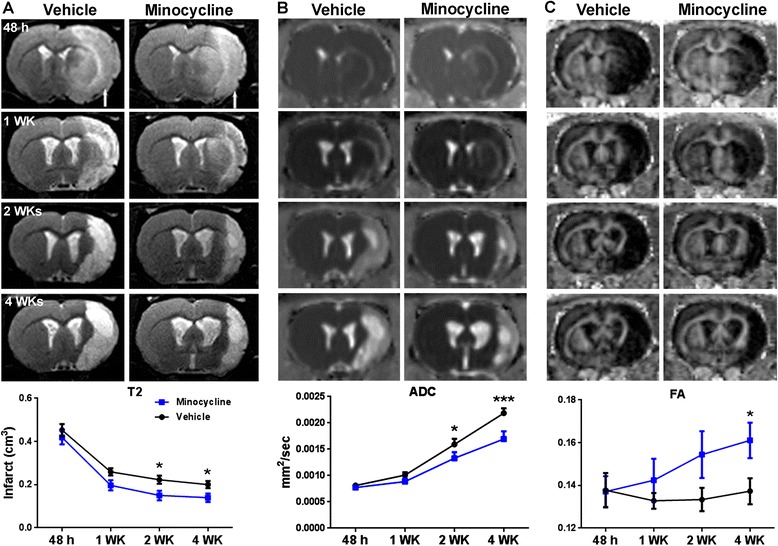
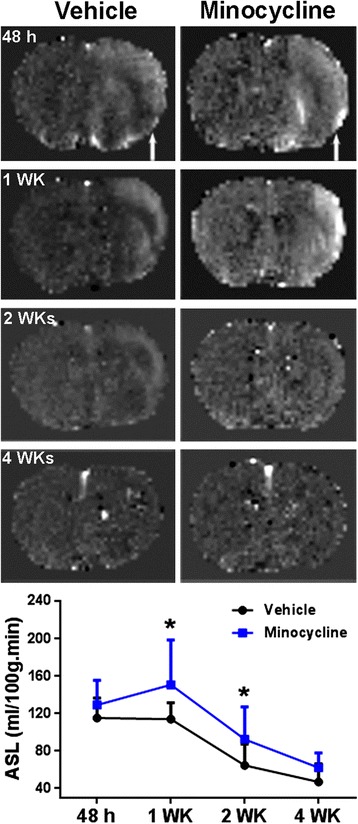
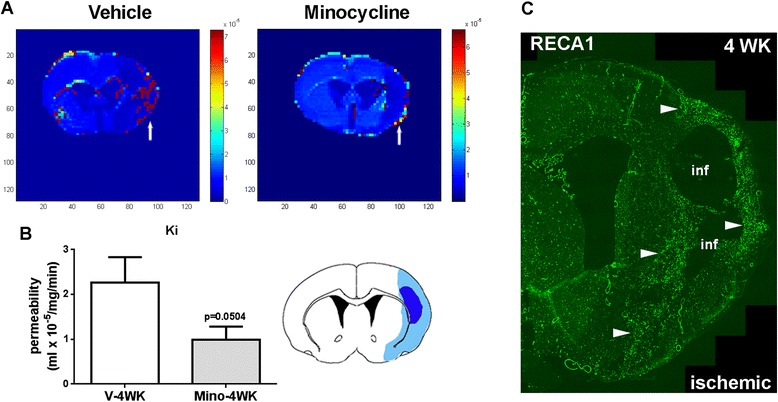
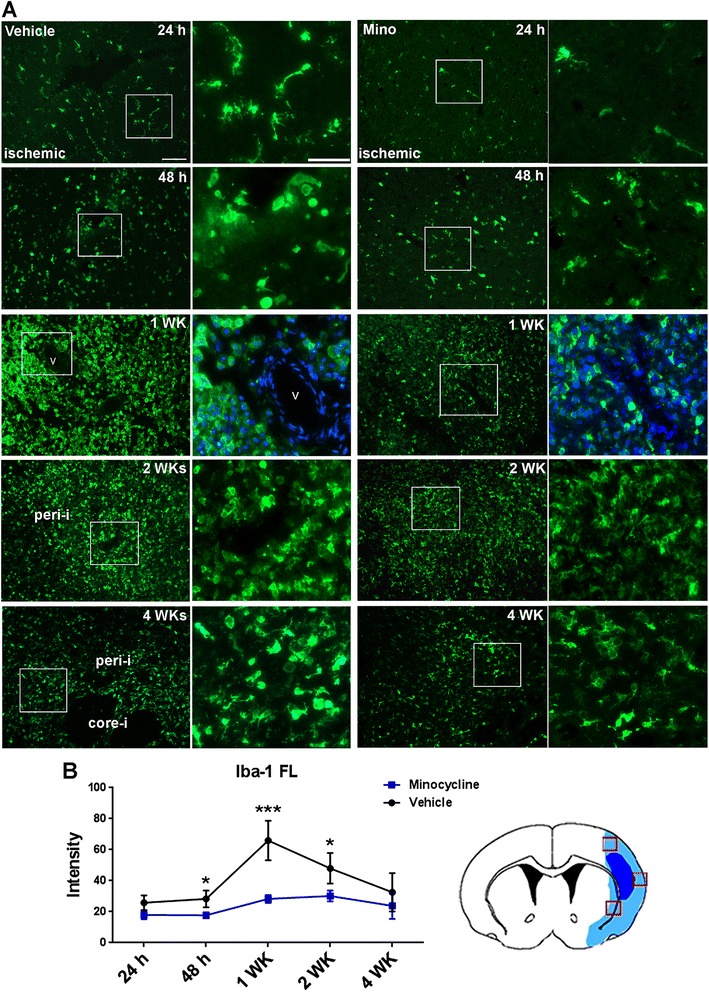
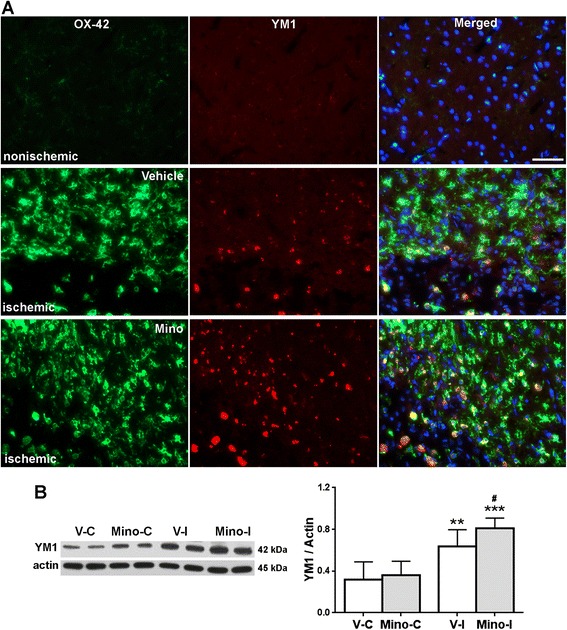
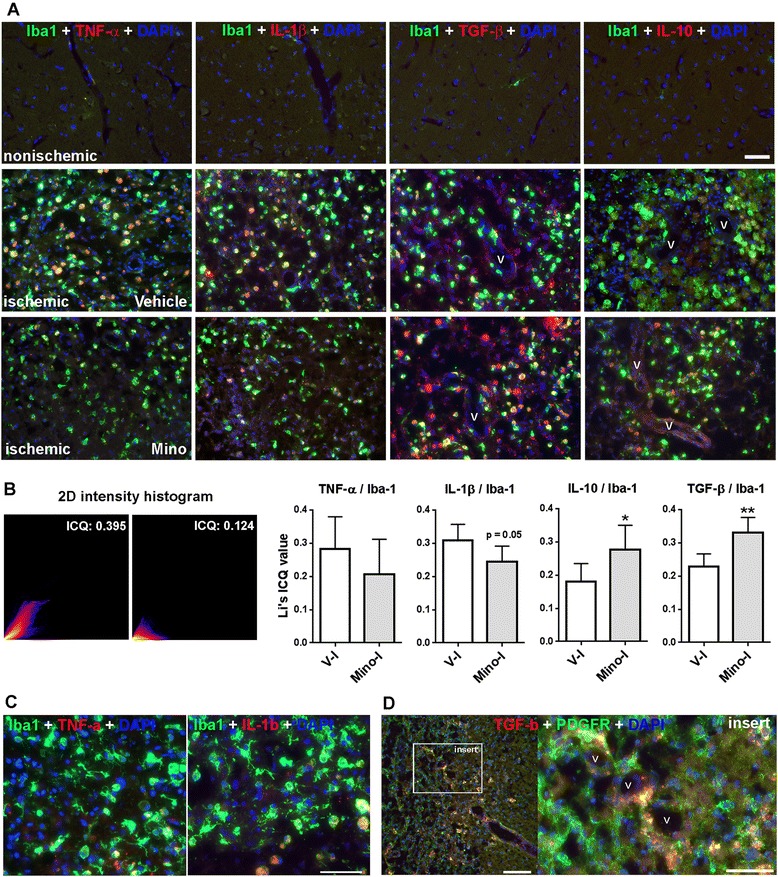
Results: Minocycline significantly reduced the infarct size and prevented tissue loss in the ischemic hemispheres compared to vehicle-treated rats from two to four weeks as measured with MRI. Cerebral blood flow measured with arterial spin labeling (ASL) showed that minocycline improved perfusion. Dynamic contrast-enhanced MRI indicated that minocycline reduced BBB permeability accompanied with higher levels of TJPs measured with Western blot. Increased MMP-2 and -3 were detected at four weeks. Active microglia/macrophage, surrounding and within the peri-infarct areas, expressed YM1, a marker of M2 microglia/macrophage activation, at four weeks. These microglia/macrophage expressed both pro-inflammatory factors tumor necrosis factors-α (TNF-α) and interleukin-1β (IL-1β) and anti-inflammatory factors transforming growth factor-β (TGF-β) and interleukin-10 (IL-10). Treatment with minocycline significantly reduced levels of TNF-α and IL-1β, and increased levels of TGF-β, IL-10 and YM1.
Conclusions: Early minocycline treatment against reperfusion injury significantly promotes neurovascular remodeling during stroke recovery by reducing brain tissue loss, enhancing TJP expression in ischemic brains and facilitating neuroprotective phenotype alternative activation of microglia/macrophages.
Figures


Similar articles
-
Minocycline and hypothermia for reperfusion injury after focal cerebral ischemia in the rat: effects on BBB breakdown and MMP expression in the acute and subacute phase.Brain Res. 2008 Jan 10;1188:198-206. doi: 10.1016/j.brainres.2007.10.052. Epub 2007 Nov 26. Brain Res. 2008. PMID: 18031717
-
Early inhibition of MMP activity in ischemic rat brain promotes expression of tight junction proteins and angiogenesis during recovery.J Cereb Blood Flow Metab. 2013 Jul;33(7):1104-14. doi: 10.1038/jcbfm.2013.56. Epub 2013 Apr 10. J Cereb Blood Flow Metab. 2013. PMID: 23571276 Free PMC article.
-
Carbon monoxide-releasing molecule-3 protects against ischemic stroke by suppressing neuroinflammation and alleviating blood-brain barrier disruption.J Neuroinflammation. 2018 Jun 21;15(1):188. doi: 10.1186/s12974-018-1226-1. J Neuroinflammation. 2018. PMID: 29929562 Free PMC article.
-
Role of bone marrow-derived macrophages (BMDMs) in neurovascular interactions during stroke.Neurochem Int. 2019 Oct;129:104480. doi: 10.1016/j.neuint.2019.104480. Epub 2019 May 27. Neurochem Int. 2019. PMID: 31145968 Review.
-
Targeting vascular inflammation in ischemic stroke: Recent developments on novel immunomodulatory approaches.Eur J Pharmacol. 2018 Aug 15;833:531-544. doi: 10.1016/j.ejphar.2018.06.028. Epub 2018 Jun 20. Eur J Pharmacol. 2018. PMID: 29935175 Free PMC article. Review.
Cited by
-
Microglial/Macrophage polarization and function in brain injury and repair after stroke.CNS Neurosci Ther. 2021 May;27(5):515-527. doi: 10.1111/cns.13620. Epub 2021 Mar 1. CNS Neurosci Ther. 2021. PMID: 33650313 Free PMC article. Review.
-
Translational MR Neuroimaging of Stroke and Recovery.Transl Stroke Res. 2017 Feb;8(1):22-32. doi: 10.1007/s12975-016-0497-z. Epub 2016 Aug 31. Transl Stroke Res. 2017. PMID: 27578048 Free PMC article. Review.
-
Serum UCH-L1 as a Novel Biomarker to Predict Neuronal Apoptosis Following Deep Hypothermic Circulatory Arrest.Int J Med Sci. 2015 Jul 3;12(7):576-82. doi: 10.7150/ijms.12111. eCollection 2015. Int J Med Sci. 2015. PMID: 26180514 Free PMC article.
-
Combining systemic and stereotactic MEMRI to detect the correlation between gliosis and neuronal connective pathway at the chronic stage after stroke.J Neuroinflammation. 2016 Jun 18;13(1):156. doi: 10.1186/s12974-016-0622-7. J Neuroinflammation. 2016. PMID: 27316350 Free PMC article.
-
Microbiology and Outcomes of Institutionalized Patients With Stroke-Associated Pneumonia: An Observational Cohort Study.Front Microbiol. 2021 Dec 3;12:720051. doi: 10.3389/fmicb.2021.720051. eCollection 2021. Front Microbiol. 2021. PMID: 34925251 Free PMC article.
References
-
- Yang Y, Candelario-Jalil E, Thompson JF, Cuadrado E, Estrada EY, Rosell A, et al. Increased intranuclear matrix metalloproteinase activity in neurons interferes with oxidative DNA repair in focal cerebral ischemia. J Neurochem. 2010;112:134–49. doi: 10.1111/j.1471-4159.2009.06433.x. - DOI - PMC - PubMed
-
- Yang Y, Estrada EY, Thompson JF, Liu W, Rosenberg GA. Matrix metalloproteinase-mediated disruption of tight junction proteins in cerebral vessels is reversed by synthetic matrix metalloproteinase inhibitor in focal ischemia in rat. J Cereb Blood Flow Metab. 2007;27:697–709. doi: 10.1038/sj.jcbfm.9600440. - DOI - PubMed
-
- Yang Y, Thompson JF, Taheri S, Salayandia VM, McAvoy TA, Hill JW, et al. Early inhibition of MMP activity in ischemic rat brain promotes expression of tight junction proteins and angiogenesis during recovery. J Cereb Blood Flow Metab. 2013;33:1104–14. doi: 10.1038/jcbfm.2013.56. - DOI - PMC - PubMed
Publication types
MeSH terms
Substances
LinkOut - more resources
Full Text Sources
Other Literature Sources
Medical
Miscellaneous
