

Physical activity and sedentary behavior patterns using accelerometry from a national sample of United States adults
- PMID: 25889192
- PMCID: PMC4336769
- DOI: 10.1186/s12966-015-0183-7
Physical activity and sedentary behavior patterns using accelerometry from a national sample of United States adults
Abstract
Background: This study described the patterns of accelerometer-determined physical activity and sedentary behavior among adults using a nationally representative sample from the United States.
Methods: Using 2003-2006 National Health and Nutrition Examination Survey (NHANES) data, 7931 adults at least 18 years old wore an ActiGraph accelerometer for one week, providing at least 3 days of wear for >=8 hours/day. Cutpoints defined moderate to vigorous physical activity (MVPA; >= 2020 and >=760 counts/minute), vigorous physical activity (> = 5999 counts/minute), and sedentary behavior (<100 counts/minute). Latent class analysis (LCA) was used to estimate patterns of physical activity and sedentary behavior. All estimates were weighted to reflect the United States population.
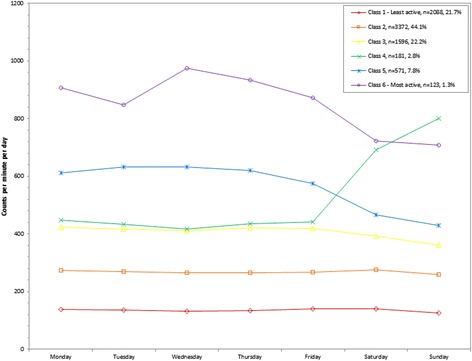
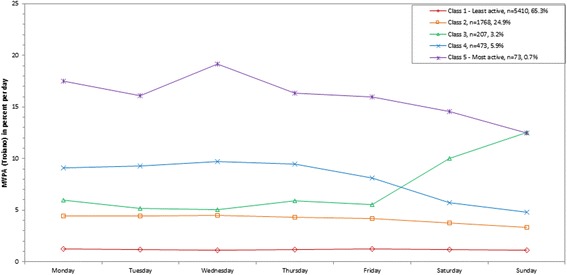
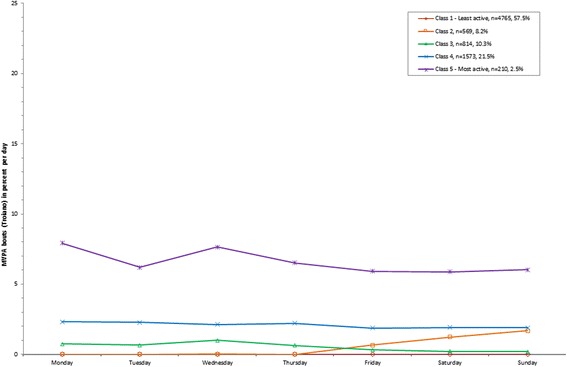
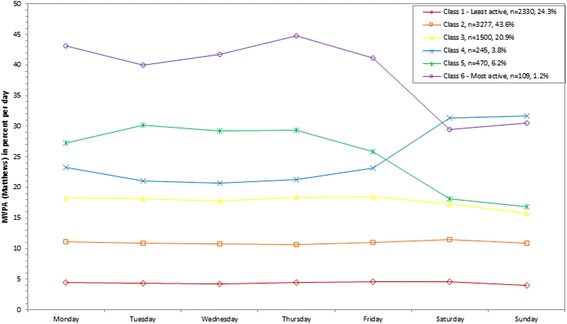
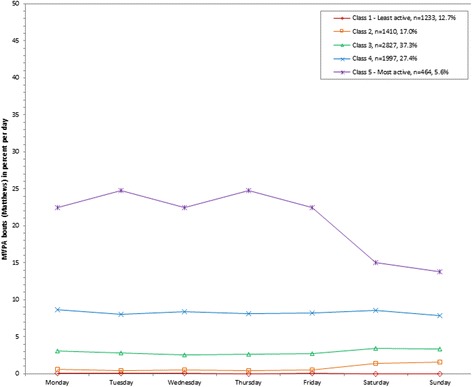
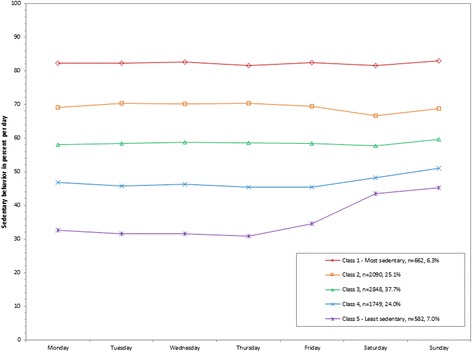
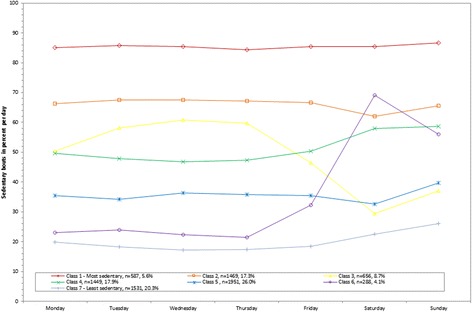
Results: For weighted percent of MVPA out of total wearing time, 5 classes were identified from least to most active: 65.3% of population (weighted mean 9.3 minutes/day), 24.9% (32.1 minutes/day), 3.2% that was low on the weekdays but much higher on the weekends (52.0 minutes/day), 5.9% (59.9 minutes/day), and 0.7% in the highest class (113.6 minutes/day). Using the lower MVPA threshold, 6 classes emerged with each class ranging in population from 1.2% to 43.6%. A vigorous activity class could not be derived due to low prevalence. For weighted percent of sedentary behavior out of total wearing time, 5 classes were identified from most to least sedentary: 6.3% of population (weighted mean 660.2 minutes/day), 25.1% (546.8 minutes/day), 37.7% (453.9 minutes/day), 24.0% (354.8 minutes/day), and 7.0% (256.3 minutes/day). Four of the classes showed generally similar results across every day of the week, with the absolute percents differing across classes. In contrast, the least sedentary class showing a marked rise in percent of time spent in sedentary behavior on the weekend (weighted mean 336.7-346.5 minutes/day) compared to weekdays (weighted mean 255.2-292.4 minutes/day).
Conclusion: The LCA models provided a data reduction process to identify patterns using minute-by-minute accelerometry data in order to explore meaningful contrasts. The models supported 5 or 6 distinct patterns for MVPA and sedentary behavior. These physical activity and sedentary behavior patterns can be used as intervention targets and as independent or dependent variables in future studies of correlates, determinants, or outcomes.
Figures
Similar articles
-
National youth sedentary behavior and physical activity daily patterns using latent class analysis applied to accelerometry.Int J Behav Nutr Phys Act. 2016 May 3;13:55. doi: 10.1186/s12966-016-0382-x. Int J Behav Nutr Phys Act. 2016. PMID: 27142304 Free PMC article.
-
Accelerometry-Assessed Latent Class Patterns of Physical Activity and Sedentary Behavior With Mortality.Am J Prev Med. 2017 Feb;52(2):135-143. doi: 10.1016/j.amepre.2016.10.033. Am J Prev Med. 2017. PMID: 28109457 Free PMC article.
-
Correlates of US adult physical activity and sedentary behavior patterns.J Sci Med Sport. 2016 Dec;19(12):1020-1027. doi: 10.1016/j.jsams.2016.03.009. Epub 2016 Mar 26. J Sci Med Sport. 2016. PMID: 27053434 Free PMC article.
-
Accelerometry analysis of physical activity and sedentary behavior in older adults: a systematic review and data analysis.Eur Rev Aging Phys Act. 2014;11(1):35-49. doi: 10.1007/s11556-013-0132-x. Epub 2013 Sep 17. Eur Rev Aging Phys Act. 2014. PMID: 24765212 Free PMC article. Review.
-
Using cadence to study free-living ambulatory behaviour.Sports Med. 2012 May 1;42(5):381-98. doi: 10.2165/11599170-000000000-00000. Sports Med. 2012. PMID: 22462794 Review.
Cited by
-
Associations of Accelerometer-Measured Physical Activity and Sedentary Time With All-Cause Mortality by Genetic Predisposition for Longevity.J Aging Phys Act. 2022 Aug 24;31(2):265-275. doi: 10.1123/japa.2022-0067. Print 2023 Apr 1. J Aging Phys Act. 2022. PMID: 36002033 Free PMC article.
-
Quantifying Mobility in the ICU: Comparison of Electronic Health Record Documentation and Accelerometer-Based Sensors to Clinician-Annotated Video.Crit Care Explor. 2020 Apr 29;2(4):e0091. doi: 10.1097/CCE.0000000000000091. eCollection 2020 Apr. Crit Care Explor. 2020. PMID: 32426733 Free PMC article.
-
Feasibility of objectively measured physical activity and sedentary behavior in patients with malignant pleural effusion.Support Care Cancer. 2017 Oct;25(10):3133-3141. doi: 10.1007/s00520-017-3721-9. Epub 2017 Apr 28. Support Care Cancer. 2017. PMID: 28455548
-
Physical activity levels, duration pattern and adherence to WHO recommendations in German adults.PLoS One. 2017 Feb 28;12(2):e0172503. doi: 10.1371/journal.pone.0172503. eCollection 2017. PLoS One. 2017. PMID: 28245253 Free PMC article.
-
The association of zero walking cadence minutes with sleep quality in adults 18-65.Sleep Breath. 2024 Nov 25;29(1):3. doi: 10.1007/s11325-024-03175-1. Sleep Breath. 2024. PMID: 39585504 Free PMC article.
References
-
- U.S. Department of Health and Human Services: 2008 Physical Activity Guidelines for Americans. ODPHP Publication No. U0036. Washington, D.C.; 2008: 1-61. Accessed September 4, 2014 at http://www.health.gov/paguidelines/.
Publication types
MeSH terms
Grants and funding
LinkOut - more resources
Full Text Sources
Other Literature Sources
Medical
Research Materials
