. 2015 Mar 29:12:49.
doi: 10.1186/s12985-015-0275-7.

ATP synthesis is active on the cell surface of the shrimp Litopenaeus vannamei and is suppressed by WSSV infection

Affiliations

ATP synthesis is active on the cell surface of the shrimp Litopenaeus vannamei and is suppressed by WSSV infection

Yan Liang et al. Virol J. .

Abstract

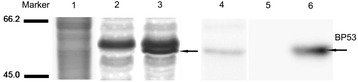
Background: Over the past a few years, evidences indicate that adenosine triphosphate (ATP) is an energy source for the binding, maturation, assembly, and budding process of many enveloped viruses. Our previous studies suggest that the F1-ATP synthase beta subunit (ATPsyn β, BP53) of the shrimp Litopenaeus vannamei (L. vannamei) might serve as a potential receptor for white spot syndrome virus (WSSV)'s infection.

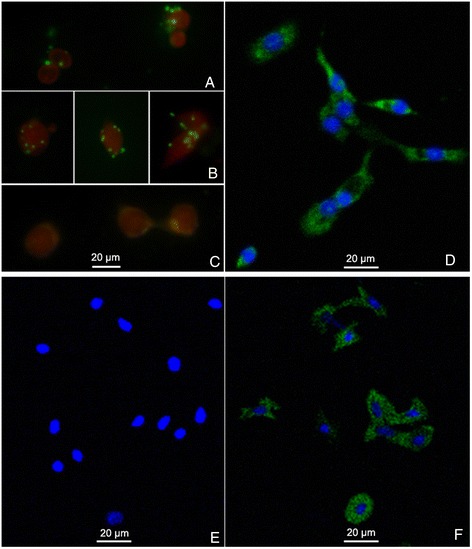
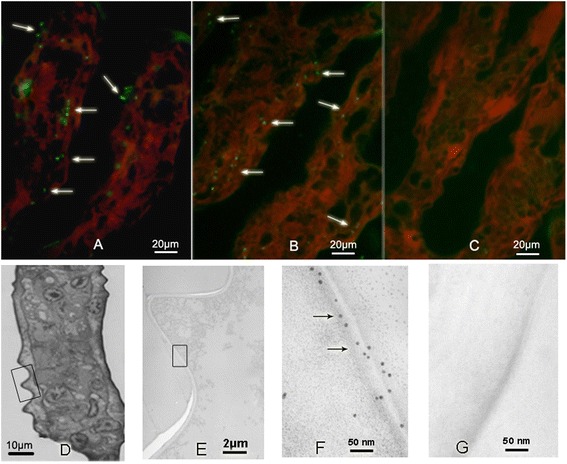
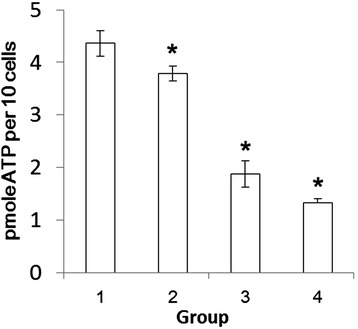
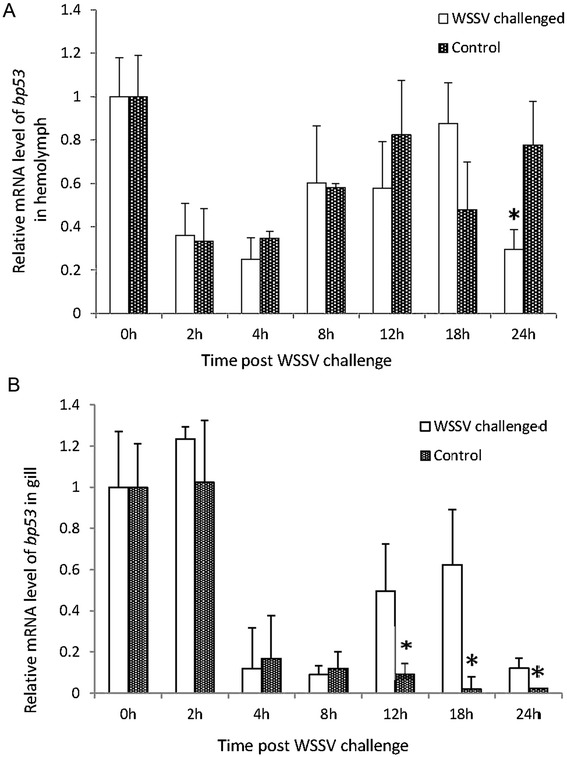
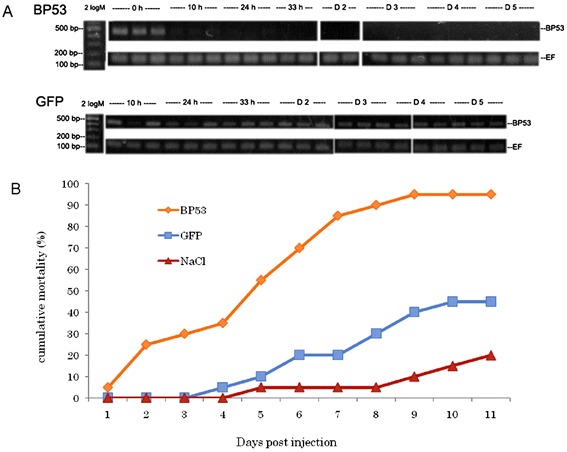
Methods: BP53 was localized on the surface of shrimp hemocytes and gill epithelial cells by immunofluorescence assay and immunogold labeling technique. Cell surface ATP synthesis was demonstrated by an in vitro bioluminescent luciferase assay. Furthermore, the expression of bp53 after WSSV infection was investigated by RT-PCR test. In addition, RNAi was developed to knock down endogenous bp53.

Results: BP53 is present on shrimp cell surface of hemocytes and gill epithelia. The synthesized ATP was detectable in the extracellular supernatant by using a bioluminescence assay, and the production declined post WSSV binding and infection. Knocking down endogenous bp53 resulted in a 50% mortality of L. vannamei.

Conclusion: These results suggested that BP53, presenting on cell surface, likely served as one of the receptors for WSSV infection in shrimp. Correspondingly, WSSV appears to disturb the host energy metabolism through interacting with host ATPsyn β during infection. This work firstly showed that host ATP production is required and consumed by the WSSV for binding and proceeds with infection process.


Figures

Figure 1
Figure 1
Specificity Characterization of the polyclonal antibody against BP53 by western blot. Line marker, pre-stained protein molecular mass markers (MBI, USA); Line 1 to Line 3, SDS-PAGE of gill membrane proteins extracted from WSSV-free Litopenaeus vannamei (Line 1), the lysates from E. coli Top10 cells with blank plasmid pBAD-gIIIB (Line 2, negative control), lysates of E. coli Top10 cells with recombinant plasmid pBAD-gIIIB-BP53 (Line 3). Line 4 to Line 6, identification of BP53 using anti-rBP53 antibody by western blot. Samples loaded were as same as Line 1 to Line 3 in sequence.
Figure 2
Figure 2
Localization of BP53 in hemocytes by immunofluorescence assay. (A) and (B), Normal shrimp hemocytes incubated with anti-BP53 polyclonal antibody, which showed punctate structures distributed over the entire cell surface. (C), Negative control. Normal shrimp hemocytes incubated with pre-immune rabbit serum instead of anti-BP53 polyclonal antibody, which had no detectable fluorescence signal. (D), Permeabilized shrimp hemocytes incubated with anti-BP53 polyclonal antibody, which showed the intracellular expression of BP53 in a characteristic reticular pattern. (E), Normal hemocytes incubated with anti-actin antibody as control group, which didn’t show any positive signals. (F), Permeabilized cells incubated with anti-actin antibody, while showed positive actin signals. Evans blue was used to visualize intact cells, and DAPI was used to visualize nuclei.
Figure 3
Figure 3
The localization of BP53 in gill secondary filaments. The expression of BP53 was analyzed by immunofluorescence microscopy and immunogold electron microscopy, respectively. (A) and (B), Gill tissues incubated with anti-BP53 polyclonal antibody, the fluorescence signals were developed by FITC-conjugated HRP, which showed numerous green spots distributed along the cuticular epithelium of gills. Pre-immune serum staining was performed as negative control (C), of which no green fluorescence spot was observed. Evansblue was used to visualize gill tissue, which showed red color under 550 nm laser light. (D), Histological slide of gill tissue observed under microscopy (1000 x), T-E stained. (E), The framed part of picture D was observed under electron microscopy. (F), Enlarged picture of part of the membrane picture E, which showed golden particles appeared along the cell membrane of the epithelium under the cuticle of gills. (G), Negative control, pre-immune serum was used as primary antibody instead of anti-BP53 Ab. Arrows point positive staining.
Figure 4
Figure 4
ATP generation on shrimp hemocytes surface measured by bioluminescent luciferase assay. (1) ATP production from WSSV free cells, (2) ATP production from cells with WSSV bound on the surface, (3) ATP production from WSSV naturally infected shrimp cells, (4) ATP production from WSSV infected cells that incubated with anti- rBP53-antibody. Asterisk (*) indicates a significant statistical difference between groups (p < 0.05).
Figure 5
Figure 5
Time-course of bp53 expression in gill and hemolymph after WSSV challenge. A relative quantitative real-time PCR assay was applied to study bp53 differential expression profiles in L. vannamei hemolymph (A) and gill (B) in response to WSSV infection within 24 h. Gene expression quantification was determined using the 2−ΔΔCt method. Actin was used as an internal control. Error bars indicate standard deviations (n = 3). Significant differences between the expression level in each time point post injection and the original level were indicated with an asterisk (p < 0.05).
Figure 6
Figure 6
Effect on shrimp survival after silencing of the bp53 gene. (A), Endogenous bp53 mRNA expression after dsRNA injection. BP53 group: bp53-specific dsRNA injection; GFP group: gfp-specific dsRNA injection. Representative gels of RT-PCR products of bp53 (482 bp) and ef (187 bp, internal control) mRNAs from hemolymph collected at different time points. Label 2 log M indicates the 0.1-10.0 kb DNA ladder marker, while h = hours and D = days post-injection. (B), The cumulative mortality after dsRNA injection without WSSV challenge. BP53 group: bp53-specific dsRNA injection; GFP group: gfp-specific dsRNA injection; NaCl group: NaCl injection instead of any dsRNA.

Similar articles

Cited by

References

    1. Leu JH, Yang F, Zhang X, Xu X, Kou GH, Lo CF. Whispovirus. Curr Top Microbiol Immunol. 2009;328:197–227. - PubMed
    1. Smith AE, Helenius A. How viruses enter animal cells. Science. 2004;304:237–42. doi: 10.1126/science.1094823. - DOI - PubMed
    1. Wang H-C, Wang H-C, Leu J-H, Kou G-H, Wang AHJ, Lo C-F. Protein expression profiling of the shrimp cellular response to white spot syndrome virus infection. Dev Comp Immunol. 2007;31:672–86. doi: 10.1016/j.dci.2006.11.001. - DOI - PubMed
    1. Liang Y, Huang J, Song XL, Zhang PJ, Xu HS. Four viral proteins of white spot syndrome virus (WSSV) that attach to shrimp cell membranes. Dis Aquat Organ. 2005;66:81–5. doi: 10.3354/dao066081. - DOI - PubMed
    1. Chen LL, Lu LC, Wu WJ, Lo CF, Huang WP. White spot syndrome virus envelope protein VP53A interacts with Penaeus monodon chitin-binding protein (PmCBP) Dis Aquat Organ. 2007;74:171–8. doi: 10.3354/dao074171. - DOI - PubMed

Publication types

MeSH terms

LinkOut - more resources