. 2015 Mar 21;15(1):4.
doi: 10.1186/s40644-015-0039-z.

Glioma grading by microvascular permeability parameters derived from dynamic contrast-enhanced MRI and intratumoral susceptibility signal on susceptibility weighted imaging

Affiliations

Glioma grading by microvascular permeability parameters derived from dynamic contrast-enhanced MRI and intratumoral susceptibility signal on susceptibility weighted imaging

Xiaoguang Li et al. Cancer Imaging. .

Abstract

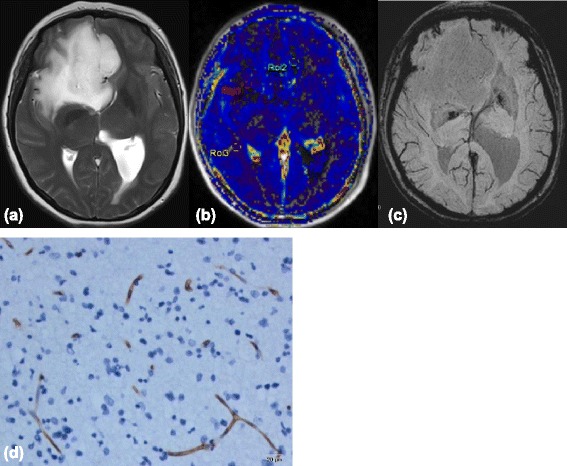
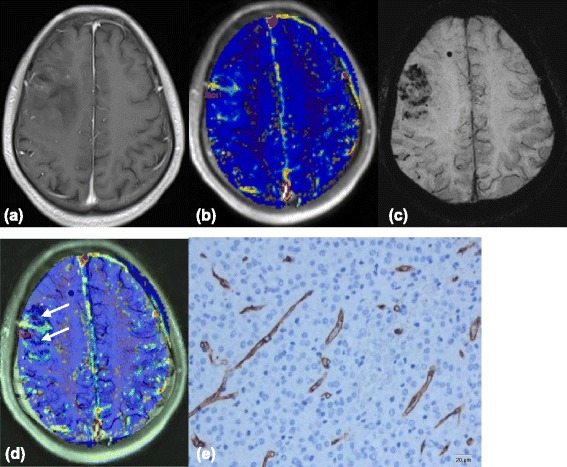
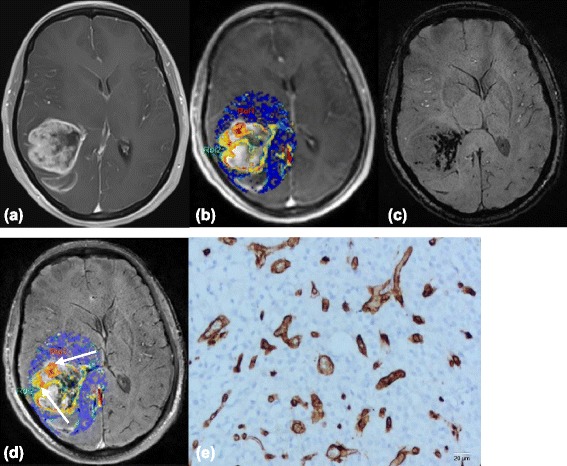
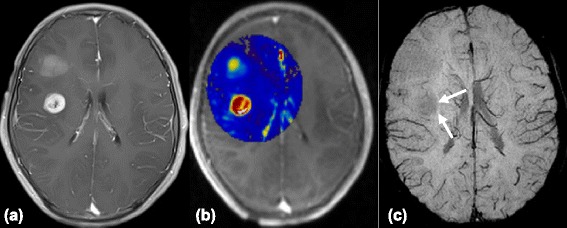
Background: Dynamic contrast-enhanced MRI (DCE-MRI) estimates vascular permeability of brain tumors, and susceptibility-weighted imaging (SWI) may demonstrate tumor vascularity by intratumoral susceptibility signals (ITSS). This study assessed volume transfer constant (Ktrans) accuracy, the volume of extravascular extracellular space (EES) per unit volume of tissue (Ve) derived from DCE-MRI, and the degree of ITSS in glioma grading.

Methods: Thirty-two patients with different glioma grades were enrolled in this retrospective study. Patients underwent DCE-MRI and non-contrast enhanced SWI by three-tesla scanning. Ktrans values, Ve, and the degree of ITSS in glioma were compared. Receiver operating characteristic (ROC) curve analysis determined diagnostic performances of Ktrans and Ve in glioma grading, and Spearman's correlation analysis determined the associations between Ktrans, Ve, ITSS, and tumor grade.

Results: Ktrans and Ve values were significantly different between low grade gliomas (LGGs) and both high grade gliomas (HGGs) and grade II, III and IV gliomas (P<0.01). The degree of ITSS of LGGs was lower than HGGs (P<0.01), and the ITSS of grade II gliomas was lower than grade III or IV gliomas. Ktrans and Ve were correlated with glioma grade (P<0.01), while ITSS was moderately correlated (P<0.01). Ktrans values were moderately correlated with ITSS in the same segments (P<0.01).

Conclusion: Ktrans and Ve values, and ITSS helped distinguish the differences between LGGs and HGGs and between grade II, III and IV gliomas. There was a moderate correlation between Ktrans and ITSS in the same tumor segments.


Figures

Figure 1
Figure 1
Images(a-c) of a 37-year-old woman with right frontal low-grade astrocytoma. (a) Axial T2-weighted image shows an ill-defined mass with high signal intensity. (b) Ktrans map shows low Ktrans values within the tumor, which is similar to the normal brain tissue. (c) SWI demonstrates no evidence of the ITSS. (d) Representative immunohistochemical staining(CD34, Original magnification,×200) shows that microvascular hyperplasia is not obvious, which along with low MVD and small VD.
Figure 2
Figure 2
Images(a-d) of a 26-year-old man with right frontal low-grade Oligodendroglioma. (a) Contrast-enhanced T1-weighted image shows fair enhancement of the tumor. (b) Ktrans map shows mild increased Ktrans values within the tumor, relative to the normal brain tissue. (c) Multiple dotlike ITSS are shown in the SWI. (d) Coregistered image of Ktrans and SWI shows that regions of the highest value of Ktrans does not correspond with areas of attenuated prominent ITSS(arrows) in the same segment. (e) Representative immunohistochemical staining(CD34, Original magnification,×200) shows rather abundant mirovessels with small VD.
Figure 3
Figure 3
Images(a-d) of a 44-year-old woman with right temporal anaplastic oligodendrogliomas. (a) Contrast-enhanced T1-weighted image shows a mass with irregular enhancement. (b) Ktrans map shows high Ktrans values in the tumor, including (c) a maximum degree of ITSS in the SWI. (d) Co-registered image of Ktrans and SWI shows that regions of the highest value of Ktrans(arrows) does not correspond with areas of attenuated prominent ITSS in the same segment. (e) Representative immunohistochemical staining(CD34, Original magnification,×200) shows abundant angiogenesis in the tumor, with high MVD, bizarre vascular formation and large VD.
Figure 4
Figure 4
Images of a 13-year-old boy with left frontal glioblastoma. (a) The contrast-enhanced axial T1-weighted image shows a mass with regular peripheral rim enhancement. (b) The high Ktrans values within the tumor indicates a high permeability of microvessels. (c) However, SWI reveals no evidence of ITSS (arrows).

References

    1. Tate MC, Aghi MK. Biology of angiogenesis and invasion in glioma. Neurotherapeutics. 2009;6:447–57. doi: 10.1016/j.nurt.2009.04.001. - DOI - PMC - PubMed
    1. Mahzouni P, Mohammadizadeh F, Mougouei K, Moghaddam NA, Chehrei A, Mesbah A. Determining the relationship between “microvessel density” and different grades of astrocytoma based on immunohistochemistry for “factor VIII–related antigen” (von Willebrand factor) expression in tumor microvessels. Indian J Pathol Microbiol. 2010;53:605–10. doi: 10.4103/0377-4929.71996. - DOI - PubMed
    1. Onishi M, Ichikawa T, Kurozumi K, Date I. Angiogenesis and invasion in glioma. Brain Tumor Pathol. 2011;28:13–24. doi: 10.1007/s10014-010-0007-z. - DOI - PubMed
    1. Jackson A, Jayson GC, Li KL, Zhu XP, Checkley DR, Tessier JJ, et al. Reproducibility of quantitative dynamic contrast-enhanced MRI in newly presenting astrocytoma. Br J Radiol. 2003;76:153–62. doi: 10.1259/bjr/70653746. - DOI - PubMed
    1. Lacerda S, Law M. Magnetic resonance perfusion and permeability imaging in brain tumors. Neuroimaging Clin North Am. 2009;19:527–57. doi: 10.1016/j.nic.2009.08.007. - DOI - PubMed

Publication types