. 2015 Apr 2:12:62.
doi: 10.1186/s12974-015-0271-2.

Mature oligodendrocytes actively increase in vivo cytoskeletal plasticity following CNS damage

Affiliations

Mature oligodendrocytes actively increase in vivo cytoskeletal plasticity following CNS damage

Giuseppe Locatelli et al. J Neuroinflammation. .

Abstract

Background: Oligodendrocytes are myelinating cells of the central nervous system which support functionally, structurally, and metabolically neurons. Mature oligodendrocytes are generally believed to be mere targets of destruction in the context of neuroinflammation and tissue damage, but their real degree of in vivo plasticity has become a matter of debate. We thus investigated the in vivo dynamic, actin-related response of these cells under different kinds of demyelinating stress.

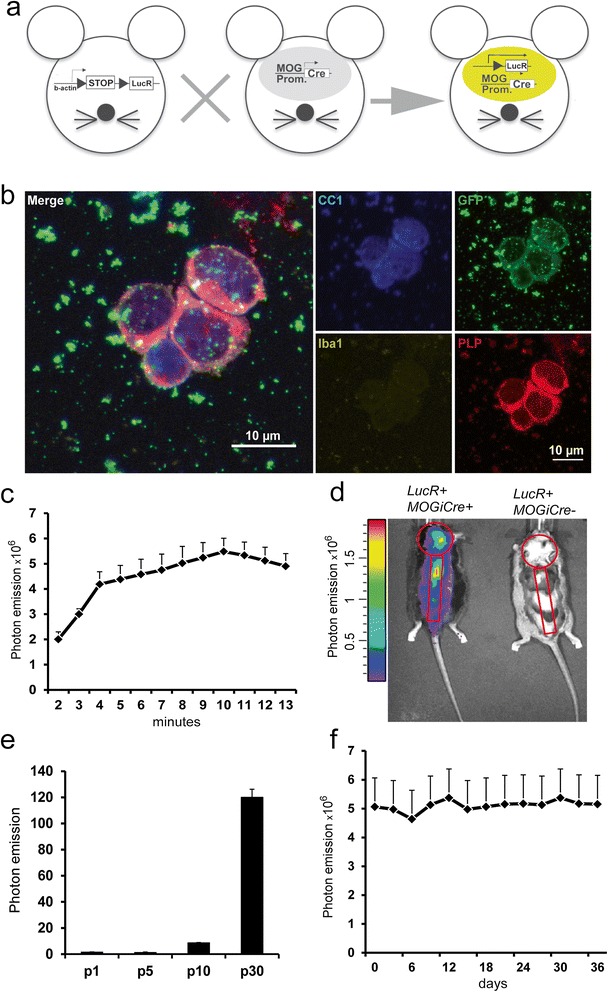
Methods: We used a novel mouse model (oLucR) expressing luciferase in myelin oligodendrocyte glycoprotein-positive oligodendrocytes under the control of a β-actin promoter. Activity of this promoter served as surrogate for dynamics of the cytoskeleton gene transcription through recording of in vivo bioluminescence following diphtheria toxin-induced oligodendrocyte death and autoimmune demyelination. Cytoskeletal gene expression was quantified from mature oligodendrocytes directly isolated from transgenic animals through cell sorting.

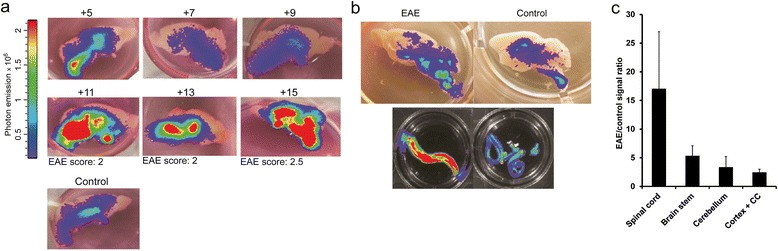
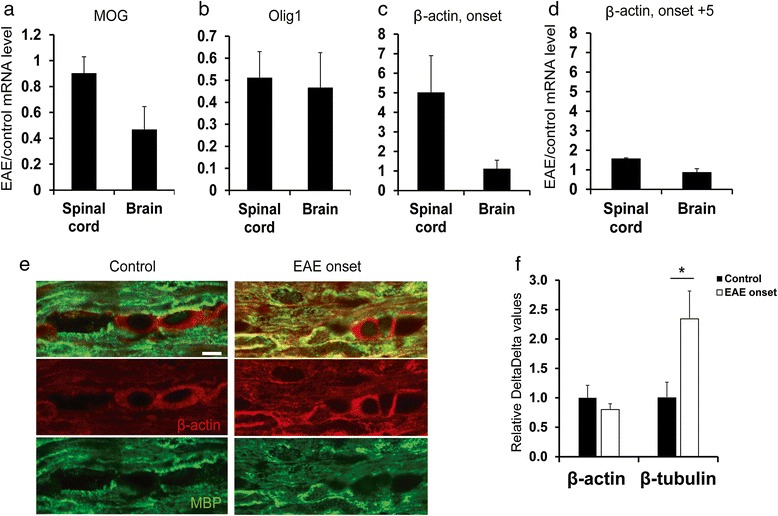
Results: Experimental demyelinating setups augmented oligodendrocyte-specific in vivo bioluminescence. These changes in luciferase signal were confirmed by further ex vivo analysis of the central nervous system tissue from oLucR mice. Increase in bioluminescence upon autoimmune inflammation was parallel to an oligodendrocyte-specific increased transcription of β-tubulin.

Conclusions: Mature oligodendrocytes acutely increase their cytoskeletal plasticity in vivo during demyelination. They are therefore not passive players under demyelinating conditions but can rather react dynamically to external insults.


Figures

Figure 1
Figure 1
The oLucR mouse model shows CNS-specific in vivo bioluminescence. (a) ODC-specific expression of luciferase is achieved by crossing a Cre-inducible luciferase reporter mouse (left) to the MOGi-cre strain. (b) EYFP+ cells were sorted and stained with CC1-, GFP-, Iba1-, and PLP-specific antibodies following cytospin. Microglia/macrophage cells were excluded by positive CD45 and CD11b staining. Dead cells were excluded by Aqua Live/Dead staining reagent (Life Technologies). (c) Kinetics of photon emission acquired with an IVIS camera in anesthetized oLucR animals following intraperitoneal injection of 150 ng/kg of D-luciferin (mean ± SEM, n = 8). (d) In vivo bioluminescence recorded in a representative oLucR mouse (left) and a control LucR animal where the STOP codon impedes luciferase expression (right). Shown in red are the specific regions of interest (ROIs) for signal acquisition. (e) The CNS from oLucR mice of the indicated ages were homogenized and analyzed in a luminometer assay. Photon emission of the lysates is shown (mean ± SEM, n = 3). (f) oLucR mice were injected with luciferin every 3 days and bioluminescence recorded from specific brain and spinal cord ROIs over the course of 36 days (mean ± SEM, n = 4).
Figure 2
Figure 2
Toxin-induced ODC death and demyelination leads to increased bioluminescence in oLucR mice. (a) Composite score of clinical disability in DTx-treated oLucR/DTR and control oLucR mice (n = 5). Details of score in [11]. (b) Ratio of mean CNS-specific bioluminescence between DTx-injected oLucR/DTR and oLucR control mice imaged in an IVIS three times a week. Data are representative of two independent experiments (n = 10). The red line indicates the mean baseline photon emission before DTx treatment. The blue bar indicates the period of DTx treatment. (c) Representative pictures of freshly prepared luciferin-bathed brain slices from DTx-treated oLucR/DTR and oLucR control mice 7 weeks p.a. An overlay of photographic picture and photon emission is shown. (d) CNS from DTx-treated oLucR/DTR and control oLucR mice 7 weeks p.a. were dissected, and lysates were analyzed by luminometer (mean ± SEM, n = 4). Gene expression changes in the CNS of oDTR and control mice following DTx treatment. mRNA levels of MOG (e), and β-actin (f) were measured in oLucR/DTR and control mice 9 days after DTx injections (n = 4, mean ± SEM). OB = olfactory bulb; CC = corpus callosum.
Figure 3
Figure 3
CNS autoimmune inflammation leads to increased bioluminescence in oLucR mice at clinical onset of disease. (a) EAE disease scores in MOG-immunized oLucR animals (mean ± SEM, n = 5). (b) Ratio of mean CNS-specific bioluminescence between MOG-immunized and control mice imaged in an IVIS every 2 to 3 days after immunization. Data are representative of three independent experiments (n = 15). The red line indicates the baseline photon emission before MOG immunization. (c) Linear correlation between day of clinical onset and increase of bioluminescence in MOG-immunized oLucR mice (n = 15, Pearson’s correlation coefficient = 0.9989). The three mice with disease onset around day 40 did not develop clinically overt EAE after the initial EAE induction and therefore were re-immunized with MOG peptide after 1 month. (d) Ratio of mean CNS-specific bioluminescence between PT-treated and control mice. oLucR mice were injected with 300 ng PT at day 0 and 2 and bioluminescence acquired over time (n = 5). The red line indicates baseline photon emission before PT administration.
Figure 4
Figure 4
Ex vivo and in vitro increase in CNS-specific bioluminescence during neuroinflammation. (a) Representative freshly dissected luciferin-bathed brain slices from oLucR animals at different time points following MOG immunization. An overlay of photographic picture and photon emission is shown. The EAE score at the time of analysis is shown below the individual pictures. (b) Representative freshly dissociated luciferin-bathed brain slices and whole spinal cords from MOG-immunized animals and not immunized control mice. Overlay of photographic picture and photon emission is shown. (c) CNS from MOG-immunized and control oLucR mice 25 days p.i. were dissected, and luciferase activity within lysates was analyzed by luminometer (mean ± SEM, n = 4).
Figure 5
Figure 5
RT-PCR analysis in the CNS of MOG-immunized versus control mice reveal upregulated expression of cytoskeleton genes. mRNA levels of MOG (a), NG2 (b), and β-actin (c) were measured in MOG-immunized and not immunized (control) oLucR mice at clinical onset of EAE (d) or at onset +5 (mean of EAE/control ratio ± SEM, n = 5). (e) Sagittal sections of spinal cord from mice at disease onset and controls were immunostained with MBP- and actin-specific antibodies. Shown are representative pictures of ODCs in white matter areas (n = 3). Scale bar, 6 μm. (f) Relative mRNA expression in FACS-sorted EYFP+ ODCs from the CNS of MOG peptide immunized mice and naïve controls at day of clinical onset of EAE (mean ± SEM, n = 5). Two-tailed Student’s t test, *P < 0.05.

References

    1. Bradl M, Lassmann H. Oligodendrocytes: biology and pathology. Acta Neuropathol. 2010;119(1):37–53. doi: 10.1007/s00401-009-0601-5. - DOI - PMC - PubMed
    1. Funfschilling UL, Supplie M, Mahad D, Boretius S, Saab AS, Edgar J, et al. Glycolytic oligodendrocytes maintain myelin and long-term axonal integrity. Nature. 2012;485(7399):517–21. - PMC - PubMed
    1. Lee Y, Morrison BM, Li Y, Lengacher S, Farah MH, Hoffman PN, et al. Oligodendroglia metabolically support axons and contribute to neurodegeneration. Nature. 2012;487(7408):443–8. doi: 10.1038/nature11314. - DOI - PMC - PubMed
    1. Watkins TA, Emery B, Mulinyawe S, Barres BA. Distinct stages of myelination regulated by gamma-secretase and astrocytes in a rapidly myelinating CNS coculture system. Neuron. 2008;60(4):555–69. doi: 10.1016/j.neuron.2008.09.011. - DOI - PMC - PubMed
    1. Snaidero N, Möbius W, Czopka T, Hekking LH, Mathisen C, Verkleij D, et al. Myelin membrane wrapping of CNS axons by PI(3,4,5)P3-dependent polarized growth at the inner tongue. Cell. 2014;16(156(1–2)):277–90. doi: 10.1016/j.cell.2013.11.044. - DOI - PMC - PubMed

Publication types

MeSH terms