. 2015 Mar 5;17(1):43.
doi: 10.1186/s13075-015-0531-7.

Kinetics of gene expression and bone remodelling in the clinical phase of collagen-induced arthritis

Affiliations

Kinetics of gene expression and bone remodelling in the clinical phase of collagen-induced arthritis

Katja C M Denninger et al. Arthritis Res Ther. .

Abstract

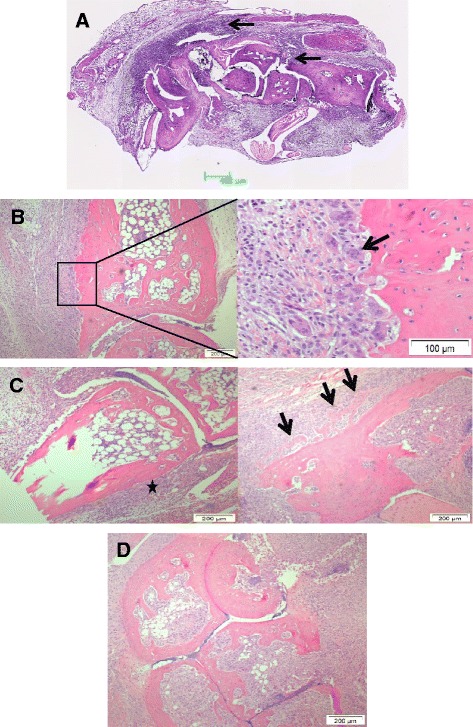
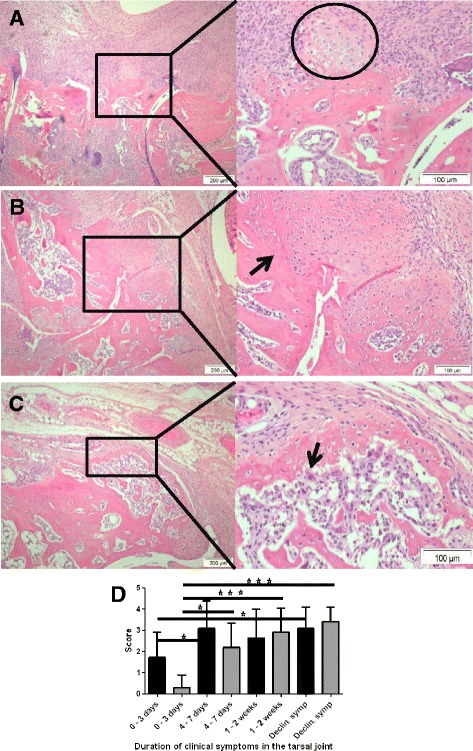
Introduction: Pathological bone changes differ considerably between inflammatory arthritic diseases and most studies have focused on bone erosion. Collagen-induced arthritis (CIA) is a model for rheumatoid arthritis, which, in addition to bone erosion, demonstrates bone formation at the time of clinical manifestations. The objective of this study was to use this model to characterise the histological and molecular changes in bone remodelling, and relate these to the clinical disease development.

Methods: A histological and gene expression profiling time-course study on bone remodelling in CIA was linked to onset of clinical symptoms. Global gene expression was studied with a gene chip array system.

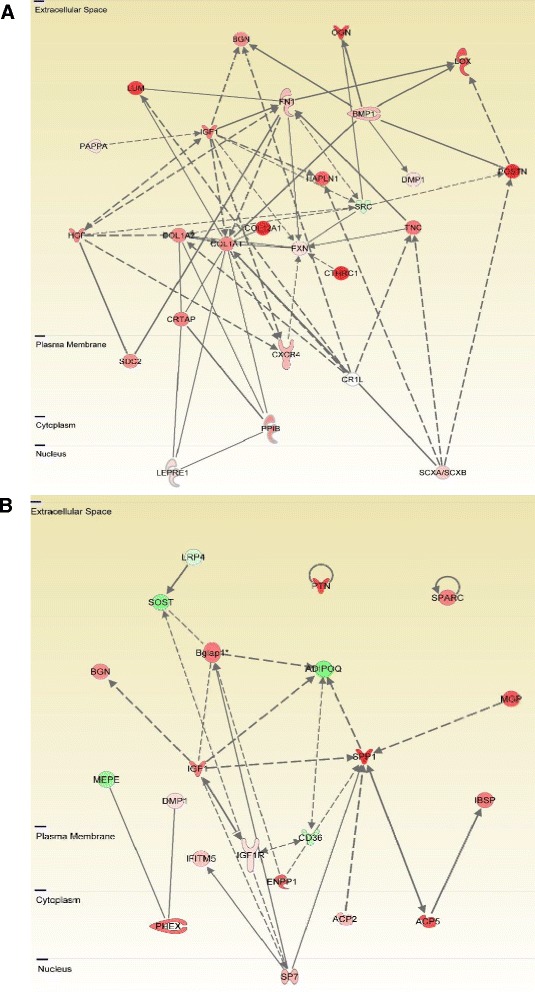
Results: The main histopathological changes in bone structure and inflammation occurred during the first two weeks following the onset of clinical symptoms in the joint. Hereafter, the inflammation declined and remodelling of formed bone dominated. Global gene expression profiling showed simultaneous upregulation of genes related to bone changes and inflammation in week 0 to 2 after onset of clinical disease. Furthermore, we observed time-dependent expression of genes involved in early and late osteoblast differentiation and function, which mirrored the histopathological bone changes. The differentially expressed genes belong to the bone morphogenetic pathway (BMP) and, in addition, include the osteoblast markers integrin-binding sialoprotein (Ibsp), bone gamma-carboxyglutamate protein (Bglap1), and secreted phosphoprotein 1 (Spp1). Pregnancy-associated protein A (Pappa) and periostin (Postn), differentially expressed in the early disease phase, are proposed to participate in bone formation, and we suggest that they play a role in early bone formation in the CIA model. Comparison to human genome-wide association studies (GWAS) revealed differential expression of several genes associated with human arthritis.

Conclusions: In the CIA model, bone formation in the joint starts shortly after onset of clinical symptoms, which results in bony fusion within one to two weeks. This makes it a candidate model for investigating the relationship between inflammation and bone formation in inflammatory arthritis.


Figures

Figure 1
Figure 1
Histopathology of tarsal joints day 0 to 7. A) Day 0 to 4: overview of inflammation in the tarsal joint showing equal severity of inflammation in peripheral tissues and synovium (arrows). (B-C) Day 0 to 4: bone erosion and OC activity (arrow in B, day 3) dominates. Proliferation and collagen deposition takes place (star in C, day 0) in the periosteum and results in osteoid deposition (arrows in C, day 3). (D) Day 4 to 7: the joint architecture is severely distorted (day 7). OC, osteoclast.
Figure 2
Figure 2
Histopathology of tarsal joints from day 8 and until decline of symptoms. (A) Appearance of cartilage (encircled) marks the onset of endochondral ossification (day 8). (B) Ankylosis has progressed from being fibrous to consist of cartilage and osteoid (day 10), with osteoid closest to the original bone (arrow). (C) Declining disease phase: bone formation is remodelled with OC activity observed in some animals (arrow). (D) Histological scores of bone erosion (black bars) and bone formation (grey bars) over time (mean +/− standard deviation (SD)). Statistics from the comparisons of individual groups is indicated by lines above the bars (Dunn’s multiple comparison test, *P <0.05, **P <0.01, ***P <0.001). OC, osteoclast.
Figure 3
Figure 3
Cluster analysis and validation of gene expression profile. (A) Separation of samples by unsupervised hierarchical clustering. The groups are: day 0 to 3, week 1 to 2 and week 3 to 4 after onset of arthritis, and joints with declining clinical disease activity. Colours and colour intensity indicate upregulation (red) or downregulation (green) regulation of genes. (B) Venn diagram of the gene expression study showing the number of genes differentially expressed at the time points: day 0 to 3, week 1 to 2, week 3 to 4, and in the declining disease phase in comparison to control. (C) The results from the microarray study were validated with qPCR. Bmp1 was normalised to Gapdh expression and compared to a control sample from non-immunised mice. Statistically significant differences between group means (δ-ct-values) are indicated with lines above the bars (Bonferroni’s multiple comparison test, *P <0.05, **P <0.01). (D) The gene expression level of Bmp1 assessed by qPCR correlated significantly (r2 = 0.7, P <0.0002) with the corresponding microarray data (linear regression test).
Figure 4
Figure 4
Gene expression networks during osteoblast activity in early and late phases of joint inflammation. A) A network of genes related to osteoblast activity, in particular collagen type I assembly and cross-linking, during the early phase of clinical disease. Colours and colour intensity indicate upregulation (red) or downregulation (green) regulation of genes at day 0 to 3, where most of the genes showed the greatest fold change in comparison to non-induced controls. One exception is Dmp1, which became upregulated at week 3 to 4. B) A network of genes related to osteoblast activity, in particular mineralisation, during the late phase of clinical disease. Colours and colour intensity indicate upregulation (red) or downregulation (green) regulation of genes at week 1 to 2, where most of the genes showed the greatest fold change in comparison to non-induced controls. One exception is Ibsp, which was most highly upregulated in week 3 to 4.
Figure 5
Figure 5
Differentially expressed genes related to BMP signalling at day 0 to 3 of arthritis in comparison to non-induced controls. Regulation of genes is indicated by colour and colour intensity (red = upregulated, green = downregulated). (A) Network of BMP related genes in general. (B) Functional pathway of BMP signalling. BMP, bone morphogenetic protein.
Figure 6
Figure 6
Bone remodelling in the CIA model. Model of bone remodelling during the course of clinical arthritis. The proposed dominating process in the bone is shown in the top part of the figure. Differentially expressed genes, encoding proteins with a function in bone remodelling, are divided into groups according to function and time point of highest differential expression in comparison to the control. All genes are upregulated in comparison to the control at the indicated time-point. Group 1: genes encoding proteins involved in osteoclast function and differentiation; Group 2: genes encoding proteins with a function in extracellular matrix formation and collagen type I assembly (highest differential expression at day 0 to 4); Group 3: genes encoding proteins with a function in extracellular matrix formation and collagen type I assembly (sustained high differential expression on day 0 to 4 and week 1 to 2); Group 4: genes with a function in mineralisation of bone (highest differential expression in week 1 to 2); Group 5: genes with a function in mineralisation of bone (highest differential expression during week 3 to 4). CIA, collagen-induced arthritis; ECM, extracellular matrix.

References

    1. Finzel S, Englbrecht M, Engelke K, Stach C, Schett G. A comparative study of periarticular bone lesions in rheumatoid arthritis and psoriatic arthritis. Ann Rheum Dis. 2011;70:122–7. doi: 10.1136/ard.2010.132423. - DOI - PubMed
    1. Holmdahl R, Andersson EC, Andersen CB, Svejgaard A, Fugger L. Transgenic mouse models of rheumatoid arthritis. Immunol Rev. 1999;169:161–73. doi: 10.1111/j.1600-065X.1999.tb01314.x. - DOI - PubMed
    1. Schett G, Stolina M, Dwyer D, Zack D, Uderhardt S, Kronke G, et al. Tumor necrosis factor alpha and RANKL blockade cannot halt bony spur formation in experimental inflammatory arthritis. Arthritis Rheum. 2009;60:2644–54. doi: 10.1002/art.24767. - DOI - PubMed
    1. Wozney JM, Rosen V. Bone morphogenetic protein and bone morphogenetic protein gene family in bone formation and repair. Clin Orthop Relat Res. 1998;346:26–37. doi: 10.1097/00003086-199801000-00006. - DOI - PubMed
    1. Schett G, Zwerina J, David JP. The role of Wnt proteins in arthritis. Nat Clin Pract Rheumatol. 2008;4:473–80. doi: 10.1038/ncprheum0881. - DOI - PubMed

Publication types