. 2015 Mar 21:13:98.
doi: 10.1186/s12967-015-0453-9.

GLI2 inhibition abrogates human leukemia stem cell dormancy

Affiliations

GLI2 inhibition abrogates human leukemia stem cell dormancy

Anil Sadarangani et al. J Transl Med. .

Abstract

Background: Dormant leukemia stem cells (LSC) promote therapeutic resistance and leukemic progression as a result of unbridled activation of stem cell gene expression programs. Thus, we hypothesized that 1) deregulation of the hedgehog (Hh) stem cell self-renewal and cell cycle regulatory pathway would promote dormant human LSC generation and 2) that PF-04449913, a clinical antagonist of the GLI2 transcriptional activator, smoothened (SMO), would enhance dormant human LSC eradication.

Methods: To test these postulates, whole transcriptome RNA sequencing (RNA-seq), microarray, qRT-PCR, stromal co-culture, confocal fluorescence microscopic, nanoproteomic, serial transplantation and cell cycle analyses were performed on FACS purified normal, chronic phase (CP) chronic myeloid leukemia (CML), blast crisis (BC) phase CML progenitors with or without PF-04449913 treatment.

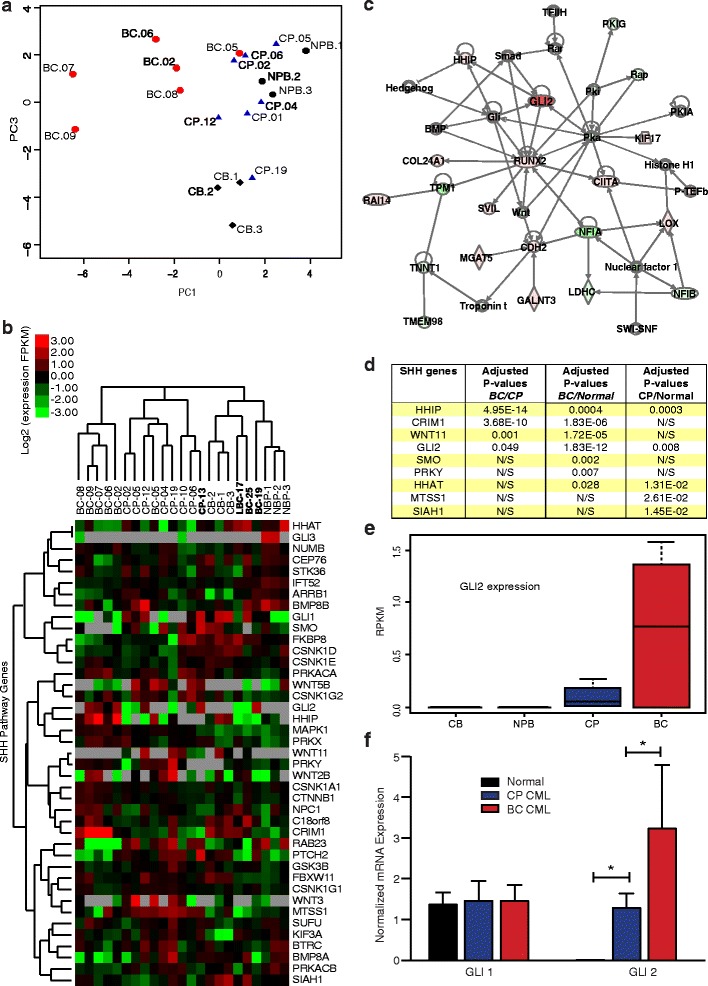
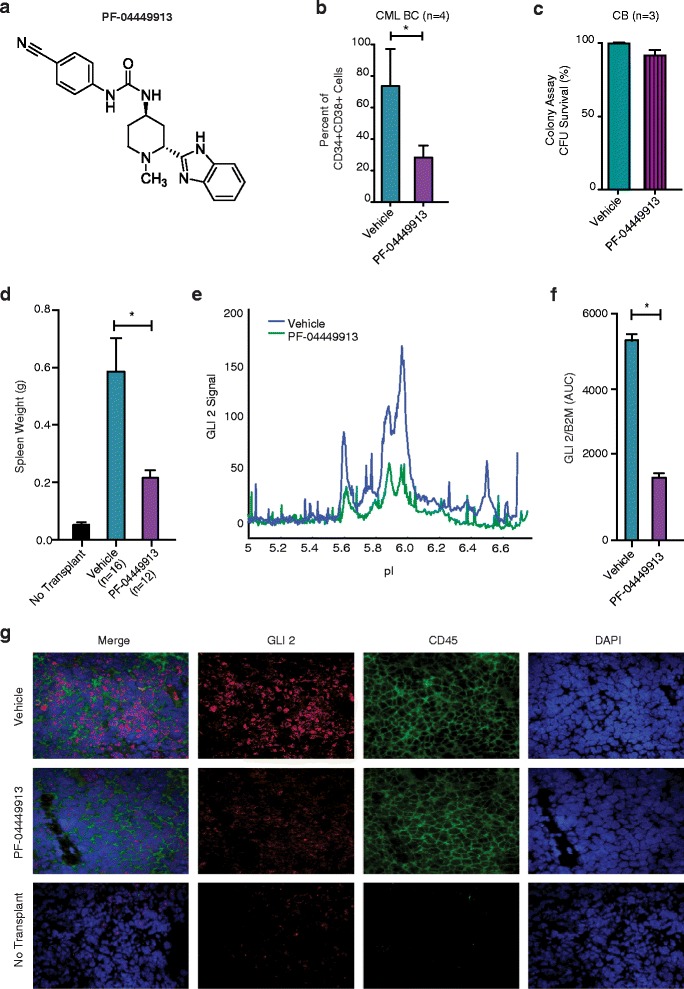
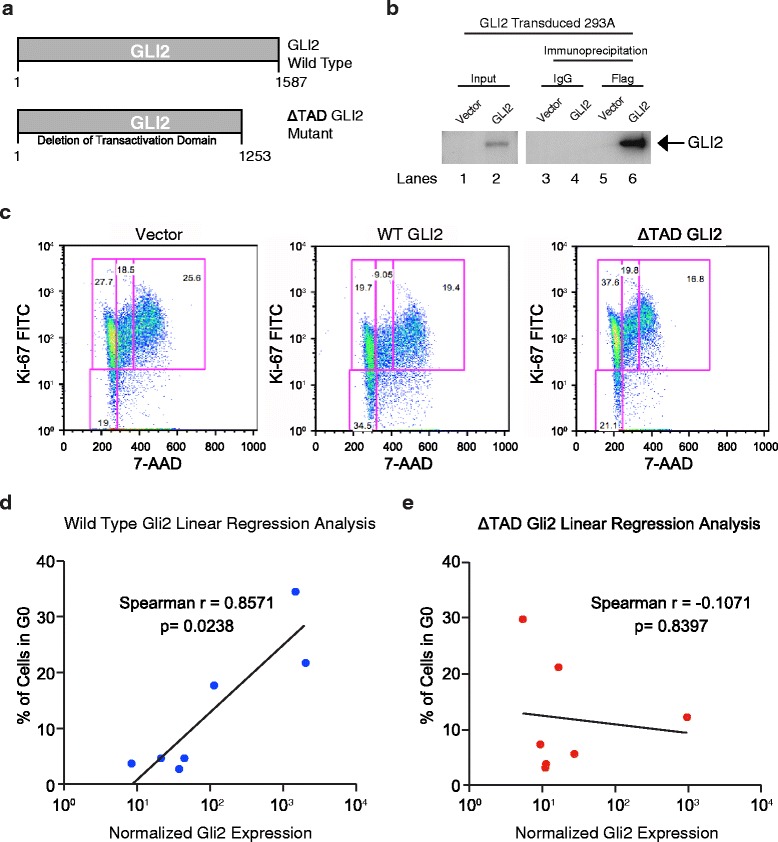
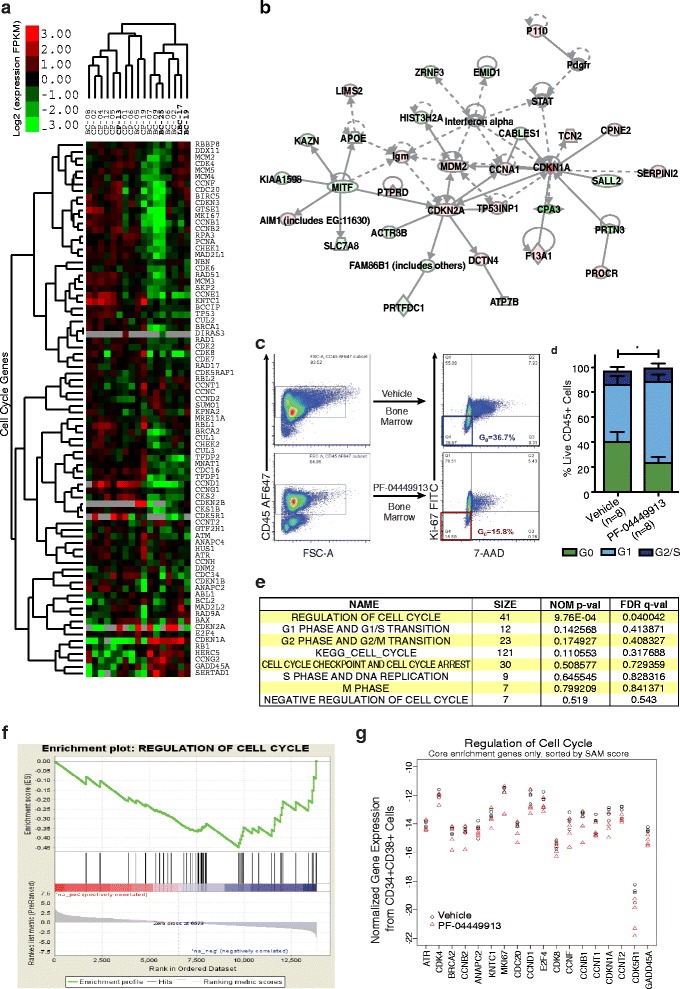
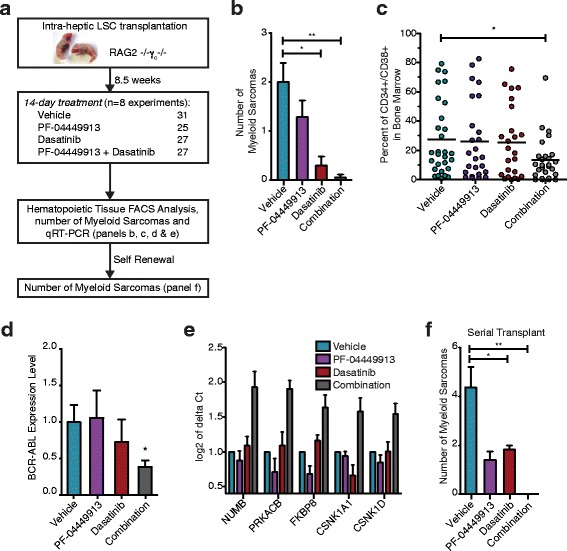
Results: Notably, RNA-seq analyses revealed that Hh pathway and cell cycle regulatory gene overexpression correlated with leukemic progression. While lentivirally enforced GLI2 expression enhanced leukemic progenitor dormancy in stromal co-cultures, this was not observed with a mutant GLI2 lacking a transactivation domain, suggesting that GLI2 expression prevented cell cycle transit. Selective SMO inhibition with PF-04449913 in humanized stromal co-cultures and LSC xenografts reduced downstream GLI2 protein and cell cycle regulatory gene expression. Moreover, SMO inhibition enhanced cell cycle transit and sensitized BC LSC to tyrosine kinase inhibition in vivo at doses that spare normal HSC.

Conclusion: In summary, while GLI2, forms part of a core HH pathway transcriptional regulatory network that promotes human myeloid leukemic progression and dormant LSC generation, selective inhibition with PF-04449913 reduces the dormant LSC burden thereby providing a strong rationale for clinical trials predicated on SMO inhibition in combination with TKIs or chemotherapeutic agents with the ultimate aim of obviating leukemic therapeutic resistance, persistence and progression.


Figures

Figure 1
Figure 1
SHH pathway deregulation in chronic myeloid leukemia progression. a. Principal components plots derived from RNA-Seq data for 41 genes in the SHH pathway, from 7 chronic phase (CP; blue triangles) and 6 blast crisis (BC; red circles) untreated subjects, as well as 3 cord blood normal samples (CB; black diamonds) and 3 normal peripheral blood (NPB; black circles). b. Heatmap from unsupervised agglomerative hierarchical clustering of sonic hedgehog (SHH) pathway genes using RNA-Seq data from FACS-purified progenitors (CD34+CD38+linPI) from 8 chronic phase (CP) and 9 blast crisis (BC) patients, 3 normal cord blood (CB) and 3 normal peripheral blood (NPB) sample. Samples labeled in bold correspond to patients that received clinical BCR-ABL inhibitor therapy. Red indicates over- and green, under-expression relative to the median RPKM (Log2 scale). Grey represent not expressed (RPKM = 0). c. Network analysis performed on differentially expressed genes between BC and CP revealed GLI2 as a key hub in the SHH pathway. d. Differentially expressed (DE) SHH genes at FDR 5% when comparing Blast crisis (BC) versus chronic phase (CP) or normal (CB and NPB). e. Box plots for GLI2 expression of 7 chronic phase (CP) and 6 blast crisis (BC) non-treated subjects, as well as 3 cord blood normal samples (CB) and 3 normal peripheral blood (NPB). Two-sided Jonckheere-Terpstra trend test: p = 0.014. f. GLI1 and GLI2 transcripts were compared using quantitative RT-PCR in FACS-purified human cord blood and normal peripheral blood CD34+CD38+LinPI progenitor cells (n = 9, black), chronic phase CML (n = 7, blue) and in blast crisis CML (n = 10, red) patient derived samples. Values were normalized to RPL27 or HPRT housekeeping genes, and set to 1 for the normal progenitors. (Student’s t-test *p < 0.05).
Figure 2
Figure 2
Selective shh inhibition reduces lsc burden in stromal co-cultures. a. Chemical structure of PF-04449913, a selective smoothened (SMO) antagonist. b. FACS analysis revealed a significant (Student’s t-test, *p = 0.047) reduction in blast crisis leukemic progenitor survival (n = 4 patient derived samples) following 7 days of PF-04449913 (1 μM, purple) compared with vehicle (DMSO, blue) treatment in SL/M2 co-cultures. c. Cord blood (n = 3) CD34+ cells were plated on SL/M2 co-cultures and treated with vehicle (DMSO) or PF-04449913 (1uM) for 7 days. Colony forming unit (CFU) survival was determined and compared to vehicle treatment. d. Spleen weight in blast crisis CML LSC engrafted mice after 14 days of treatment with vehicle (n = 16, blue) or PF-04449913 (n = 12; 100 mg/kg daily, purple). A significant (Student t-test, *p = 0.006) reduction is observed after PF-044449913 treatment. e. Nanoproteomic (CB1000) traces of total GLI2 protein of CD34 + CD38+ FACS sorted derived from the spleen of mice (n = 5) after vehicle (blue) or PF-04449913 (green) treatment for 14 days with 100 mg/kg daily. f. GLI2 expression was determined after normalizing the area under the curve (AUC) to a β2-microglobulin (β2M) loading control (Student’s t-test *p = 0.001) g. Confocal fluorescence microscopic analysis of spleen sections from no transplant or LSC engrafted mice treated with vehicle or PF-04449913. Photomicrographs of sections stained with DAPI and antibodies specific for human CD45, human GLI2 and the merged image.
Figure 3
Figure 3
GLI2 induces cell cycle arrest in leukemic progenitors. a. Both the lentiviral GLI2 wild-type (GLI2) and transactivation domain deleted (GLI2 ΔTAD) expression constructs contain an N-terminus Flag epitope tag. The scheme depicts both wild type and mutant GLI2. GLI2 ΔTAD mutant harbors a deletion of the transactivation domain reported in [48]. b. Western blot of 293A cells transduced with GLI2 and immunoprecipitated using flag epitope. c. FACS based cell cycle analysis of patient samples (CD45+) that had either been transduced with vector, wild type (GLI2), or mutant (GLI2). d-e. Spearman correlation analysis comparing GLI2 expression levels, determined by quantitative PCR, and percent of cells in G0 after lentivital GLI2 or GLI2 ΔTAD compared with backbone vector controls.
Figure 4
Figure 4
Shh inhibition induces cycling of dormant leukemic progenitors. a. Heatmap from patient samples, unsupervised agglomerative hierarchical clustering of cell cycle pathway genes using RNA-Seq data from FACS-purified progenitors (CD34+CD38+linPI) from 8 chronic phase (CP) and 9 blast crisis (BC) patient samples. Bold indicates prior treatment before sample collection (Additional file 1: Table S1). Red indicates over- and green, under-expression relative to the median RPKM (Log2 scale). Grey represents no expression. b. Network analysis of BC and CP progenitors revealed CDKN1A and CDKN2A as cell cycle hub. c. Representative FACS plots in bone marrow CD45+ cells after 14 days of vehicle or PF-04449913 treatment. d. Cell cycle analysis of bone marrow from BC CML engrafted mice after 14 days of vehicle (n = 4) or PF-04449913 (n = 4). Student’s t-test *p < 0.05 for both G0` and G1 population compared with vehicle treatment. e. GSEA analysis summary table obtained from RNA sequencing data comparing PF-04449913 treated engrafted mice (n = 4) to control (n = 4) (average 24.7-58.0 million mapped reads/sample). “Regulation of Cell Cycle” pathway was significantly decreased in PF-04449913 purified human progenitors derived from treated mice (family-wise p value =0.02). f. GSEA enrichment plot of “Regulation of Cell Cycle” pathway gene expression following in vivo LSC treatment with PF-04449913. The horizontal heatmap shows SAM score in descending order for all 13,850 genes (SHH pathway genes indicated as vertical black bars). g. Normalized gene expression values for the 18 genes in the core enrichment subset from the “Regulation of Cell Cycle” pathway. All the genes had a negative SAM score and are sorted in order of descending SAM score along the x-axis. This order agrees with the order in the GSEA enrichment plot, where expression levels for these genes are significantly reduced in the PF-04449913 treated mice.
Figure 5
Figure 5
PF-04449913 induced cell cycle activation enhances TKI sensitivity. a. Schematic of in vivo experiments. RAG2−/−γc −/− pups were transplanted intrahepatically with 50,000 CD34+ BC CML cells within 48 hours of birth. Engrafted mice were treated daily for 14 days by oral gavage with vehicle, PF-04449913 (100 mg/kg), Dasatinib (50 mg/kg) or the combination. b. Graph of myeloid sarcoma count in blast crisis CML engrafted mice in vehicle (n =13, blue), PF-04449913 (n=7, purple), dasatinib (n =6, red) and combination (n =3, black) treated mice +/− SEM; *p < 0.05 and *p < 0.01 by ANOVA and Tukey post-hoc analysis c. FACS analysis showing percentage of marrow engrafted blast crisis progenitor LSC (n = 3 patients) after 14-day treatment with vehicle (n =31, blue), PF-04449913 (n =25, purple), dasatinib (n =27, maroon) and combination (n=27, grey). *p < 0.05 by ANOVA and Tukey post-hoc analysis d. BCR-ABL transcripts in the blast crisis CML engrafted marrow mice after 14 days of treatment. Graph shows normalized BCR-ABL expression (HPRT) +/− SEM; *p < 0.05 by ANOVA and Tukey post-hoc analysis e. Hedgehog pathway gene expression in FACS purified human progenitor cells from blast crisis LSC engrafted mouse marrow treated with vehicle (n = 3, blue), PF-04449913 (n = 4, purple) dasatinib (n = 4, maroon), combination (n=3, dark grey). Expression levels of seven genes were significantly altered by synergistic effect of PF-04449913 and Dasatinib (NUMB, PRKACB, CTNNB1, FKBP8, CSNK1A1, CSNK1D and STK36), where five represent SHH regulatory genes (graphed). f. Mice serially transplanted with FACS purified human progenitors from LSC engrafted mice treated with vehicle (n=12, green), PF-04449913 (n=12, purple), dasatinib (n = 8, maroon) or combination (n=7, grey) were examined for myeloid sarcomas; *p < 0.05 and *p < 0.01 by ANOVA and Tukey post-hoc analysis.

References

    1. Tkachuk DC, Westbrook CA, Andreeff M, Donlon TA, Cleary ML, Suryanarayan K, et al. Detection of bcr-abl fusion in chronic myelogeneous leukemia by in situ hybridization. Science. 1990;250(4980):559–62. doi: 10.1126/science.2237408. - DOI - PubMed
    1. Jamieson CH, Ailles LE, Dylla SJ, Muijtjens M, Jones C, Zehnder JL, et al. Granulocyte-macrophage progenitors as candidate leukemic stem cells in blast-crisis CML. N Engl J Med. 2004;351(7):657–67. doi: 10.1056/NEJMoa040258. - DOI - PubMed
    1. Levy JG, Dowding C, Mitchell D, Sorrenti R, Yip S, Jamieson C. Selective elimination of malignant stem cells using photosensitizers followed by light treatment. Stem Cells. 1995;13(4):336–43. doi: 10.1002/stem.5530130403. - DOI - PubMed
    1. Bonnet D, Dick JE. Human acute myeloid leukemia is organized as a hierarchy that originates from a primitive hematopoietic cell. Nat Med. 1997;3(7):730–7. doi: 10.1038/nm0797-730. - DOI - PubMed
    1. Holyoake T, Jiang X, Eaves C, Eaves A. Isolation of a highly quiescent subpopulation of primitive leukemic cells in chronic myeloid leukemia. Blood. 1999;94(6):2056–64. - PubMed

Publication types