. 2015 Apr 12:14:82.
doi: 10.1186/s12943-015-0355-8.

Long noncoding RNA PVT1 indicates a poor prognosis of gastric cancer and promotes cell proliferation through epigenetically regulating p15 and p16

Affiliations

Long noncoding RNA PVT1 indicates a poor prognosis of gastric cancer and promotes cell proliferation through epigenetically regulating p15 and p16

Rong Kong et al. Mol Cancer. .

Abstract

Background: Mounting evidence indicates that long noncoding RNAs (lncRNAs) could play a pivotal role in cancer biology. However, the overall biological role and clinical significance of PVT1 in gastric carcinogenesis remains largely unknown.

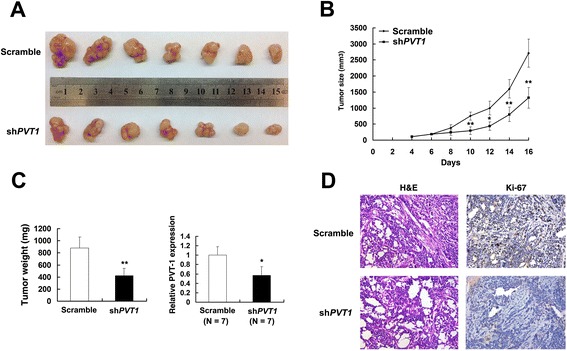
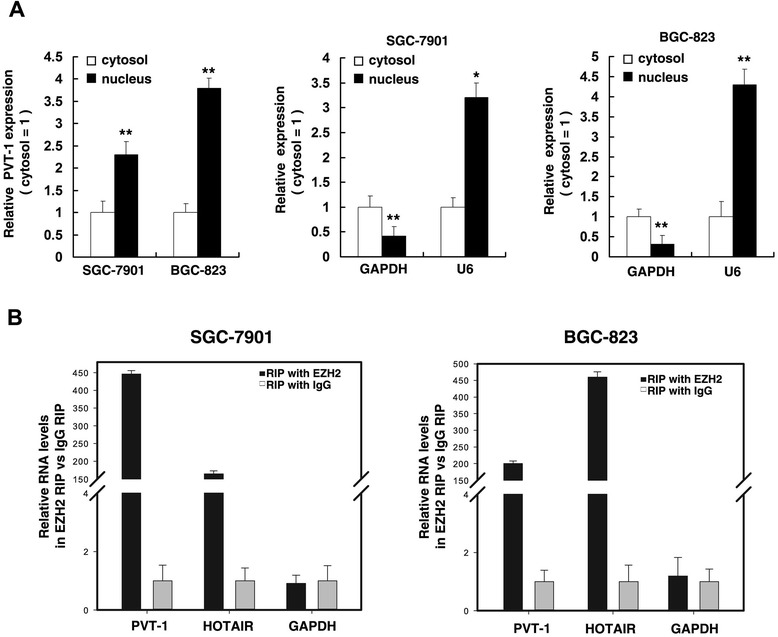
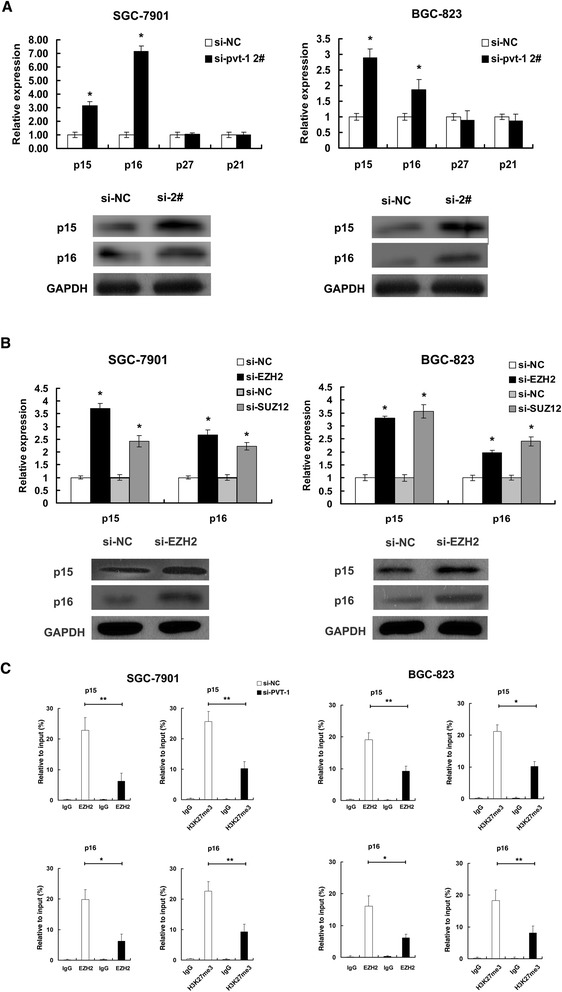
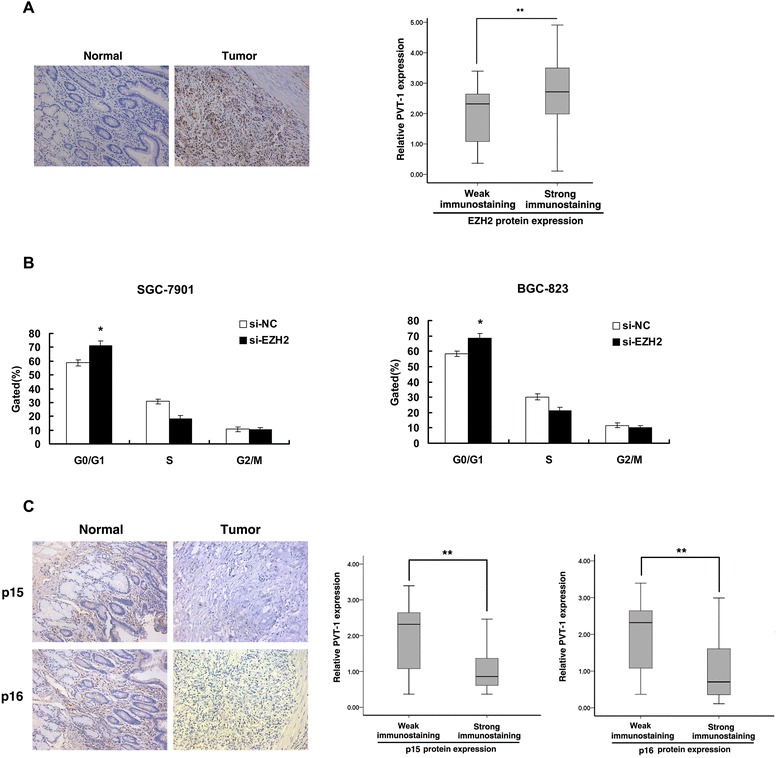
Methods: Expression of PVT1 was analyzed in 80 GC tissues and cell lines by qRT-PCR. The effect of PVT1 on proliferation was evaluated by MTT and colony formation assays, and cell apoptosis was evaluated by Flow-cytometric analysis. GC cells transfected with shPVT1 were injected into nude mice to study the effect of PVT1 on tumorigenesis in vivo. RIP was performed to confirm the interaction between PVT1 and EZH2. ChIP was used to study the promoter region of related genes.

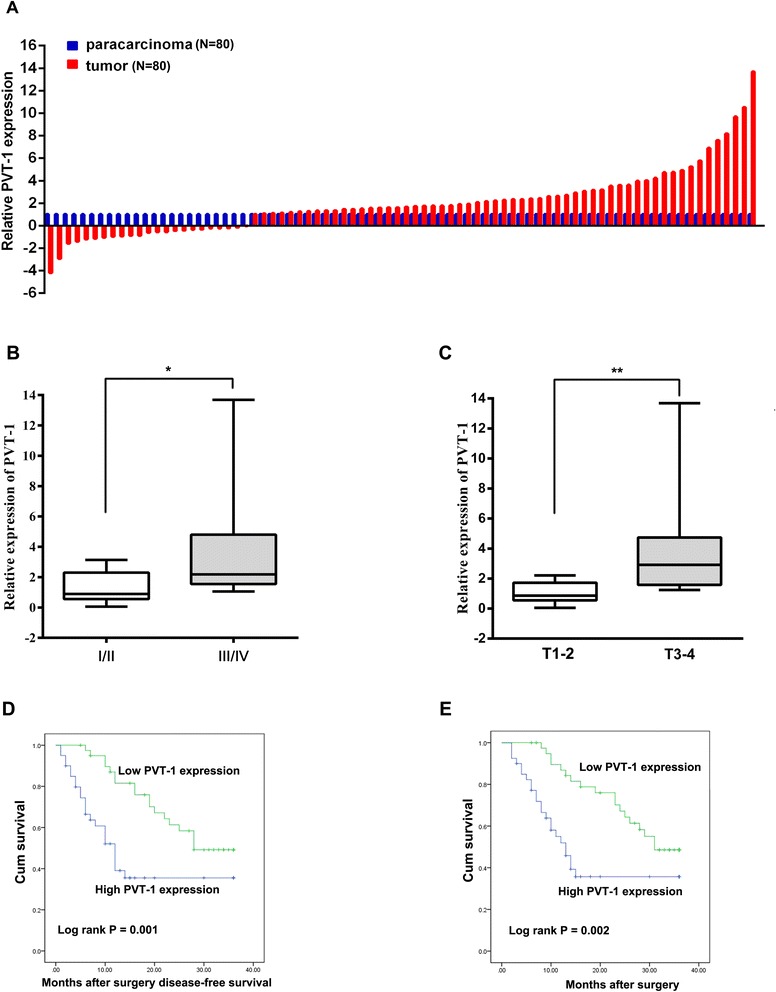
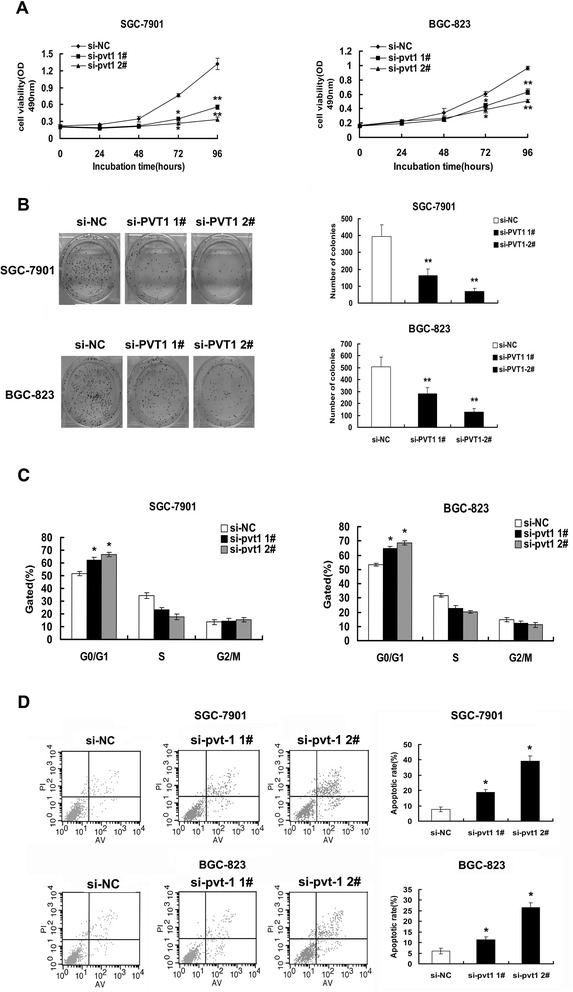
Results: The higher expression of PVT1 was significantly correlated with deeper invasion depth and advanced TNM stage. Multivariate analyses revealed that PVT1 expression served as an independent predictor for overall survival (p = 0.031). Further experiments demonstrated that PVT1 knockdown significantly inhibited the proliferation both in vitro and in vivo. Importantly, we also showed that PVT1 played a key role in G1 arrest. Moreover, we further confirmed that PVT1 was associated with enhancer of zeste homolog 2 (EZH2) and that this association was required for the repression of p15 and p16. To our knowledge, this is the first report showed that the role and the mechanism of PVT1 in the progression of gastric cancer.

Conclusions: Together, these results suggest that lncRNA PVT1 may serve as a candidate prognostic biomarker and target for new therapies in human gastric cancer.


Figures

Figure 1
Figure 1
PVT1 expression is increased in human gastric cancer tissues and correlates with poor prognosis. (A) Relative expression of PVT1 in GC tissues (N = 80) compared with corresponding non-tumor tissues (N = 80). PVT1 expression was detected by qPCR and normalized to GAPDH expression. (B) The PVT1 expression was significantly higher in patients with higher pathological stage (T3-4) than in those with lower pathological stage (T1-2). (C) The PVT1 expression was significantly higher in patients with deeper depth of invasion than in patients with shallower depth of invasion. Kaplan–Meier analysis of disease-free survival (D) or overall survival (E) was analyzed according to PVT1 expression levels. *, P < 0.05, **, P < 0.01.
Figure 2
Figure 2
Effect of PVT1 on gastric cell growth in vitro. (A) Forty-eight hours after transfection, MTT assay was performed to detect the proliferation of SGC-7901 and BGC-823 cells. (B) Colony-forming growth assays were performed to determine the proliferation of SGC-7901 and BGC-823 cells. The colonies were counted and captured. (C) Forty-eight hours after transfection, cell cycle was analyzed by flow cytometry. The bar chart represented the percentage of cells in G0/G1, S, or G2/M phase, as indicated. (D) Forty-eight hours after transfection, the apoptotic rates of cells were detected by flow cytometry. LR, early apoptotic cells. UR, terminal apoptotic cells. Error bars indicate means ± S.E.M. *, P < 0.05, **, P < 0.01.
Figure 3
Figure 3
The impact of PVT1 on tumorigenesis in vivo. (A) and (B) Scramble or shPVT1 was transfected into SGC-7901 cells, which were injected in the nude mice (n = 7), respectively. Tumor volumes were calculated every other day after 4 days of injection. Bars indicate SD. (C) Tumor weights are represented as means of tumor weights ± SD. qRT-PCR was performed to determine the average expression of PVT1. (D) Histopathology of xenograft tumors. The tumor sections were under H&E staining and IHC staining using antibodies against Ki-67. Error bars indicate means ± S.E.M. *, P < 0.05, **, P < 0.01.
Figure 4
Figure 4
Subcellular fractionation location of PVT1, and PVT1 could bind to EZH2. (A) After nuclear and cytosolic separation, RNA was extracted from the nuclear and the cytoplasmic fraction of SGC-7901 and BGC-823 cells and PVT1 expression was measured by qRT-PCR. GAPDH was used as a cytosol marker and U6 was used as a nucleus marker. (B) RIP experiments were performed in SGC-7901 and BGC-823 cells and the coprecipitated RNA were subjected to qRT-PCR for PVT1. HOTAIR was used as a positive control. The fold enrichment of PVT1 in EZH2 RIP is relative to its matching IgG control RIP. *, P < 0.05, **, P < 0.01.
Figure 5
Figure 5
PVT1 could regulate the expression of p15/p16 in epigenetic level. (A) qPCR and western blot assays were performed to determine the expression of p15, p16, p21 and p27 in SGC-7901 and BGC-823 cells after si-PVT1 2# transfection. (B) The expression level of p15 and p16 was detected in SGC-7901 and BGC-823 cells after si-EZH2 or si-SUZ12 transfection by qPCR and western blot asssy was performed to detect the protein level of p15 and p16 after si-EZH2 transfection. (C) ChIP of EZH2 and H3K27me3 of the promoter region of p15/p16 locus after siRNA treatment targeting si-NC or si-PVT1 2# in SGC-7901 and BGC-823 cells, qPCR was performed to detect the quantitation of ChIP assays. Enrichment was quantified relative to input controls. Antibody directed against IgG was used as a negative control. Error bars indicate means ± S.E.M. *, P < 0.05, **, P < 0.01.
Figure 6
Figure 6
The expression of PVT1 is inversely correlated with p15/p16 protein level in GC tissues. (A) Immunostaining of EZH2 was negatively or very weakly positive in non-tumor gastric tissues, but was strongly positive in corresponding tumor tissues. The immunoreactivity of EZH2 protein in GC tissues showed a statistically significant positive correlation with PVT1 expression. Error bars indicate means ± standard errors of the mean. (B) Flow cytometry assays were performed to detect the cell cycle after si-EZH2 transfection. (C) The level of p15/p16 in GC tissues was determined by immunohistochemistry. PVT1 expression was inversely correlated with p15/p16 protein level. *, P < 0.05, **, P < 0.01.

References

    1. Herszenyi L, Tulassay Z. Epidemiology of gastrointestinal and liver tumors. Eur Rev Med Pharmacol Sci. 2010;14(4):249–58. - PubMed
    1. Catalano V, Labianca R, Beretta GD, Gatta G, de Braud F, Van Cutsem E. Gastric cancer. Crit Rev Oncol Hematol. 2009;71(2):127–64. doi: 10.1016/j.critrevonc.2009.01.004. - DOI - PubMed
    1. Amaral PP, Mattick JS. Noncoding RNA in development. Mamm Genome. 2008;19(7-8):454–92. doi: 10.1007/s00335-008-9136-7. - DOI - PubMed
    1. Dinger ME, Amaral PP, Mercer TR, Pang KC, Bruce SJ, Gardiner BB, Askarian-Amiri ME, Ru K, Solda G, Simons C, et al. Long noncoding RNAs in mouse embryonic stem cell pluripotency and differentiation. Genome Res. 2008;18(9):1433–45. doi: 10.1101/gr.078378.108. - DOI - PMC - PubMed
    1. Rinn JL, Kertesz M, Wang JK, Squazzo SL, Xu X, Brugmann SA, Goodnough LH, Helms JA, Farnham PJ, Segal E, et al. Functional demarcation of active and silent chromatin domains in human HOX loci by noncoding RNAs. Cell. 2007;129(7):1311–23. doi: 10.1016/j.cell.2007.05.022. - DOI - PMC - PubMed

Publication types

MeSH terms

Substances