Increased levels of choline metabolites are an early marker of docetaxel treatment response in BRCA1-mutated mouse mammary tumors: an assessment by ex vivo proton magnetic resonance spectroscopy
- PMID: 25890200
- PMCID: PMC4404119
- DOI: 10.1186/s12967-015-0458-4
Increased levels of choline metabolites are an early marker of docetaxel treatment response in BRCA1-mutated mouse mammary tumors: an assessment by ex vivo proton magnetic resonance spectroscopy
Abstract
Background: Docetaxel is one of the most frequently used drugs to treat breast cancer. However, resistance or incomplete response to docetaxel is a major challenge. The aim of this study was to utilize MR metabolomics to identify potential biomarkers of docetaxel resistance in a mouse model for BRCA1-mutated breast cancer.
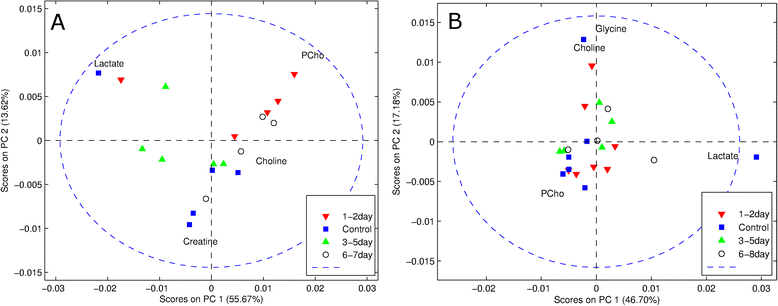
Methodology: High resolution magic angle spinning (HRMAS) (1)H MR spectroscopy was performed on tissue samples obtained from docetaxel-sensitive or -resistant BRCA1-mutated mammary tumors in mice. Measurements were performed on samples obtained before treatment and at 1-2, 3-5 and 6-7 days after a 25 mg/kg dose of docetaxel. The MR spectra were analyzed by multivariate analysis, followed by analysis of the signals of individual compounds by peak fitting and integration with normalization to the integral of the creatine signal and of all signals between 2.9 and 3.6 ppm.
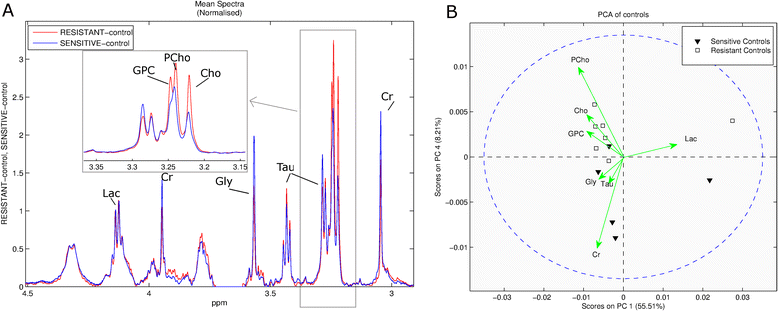
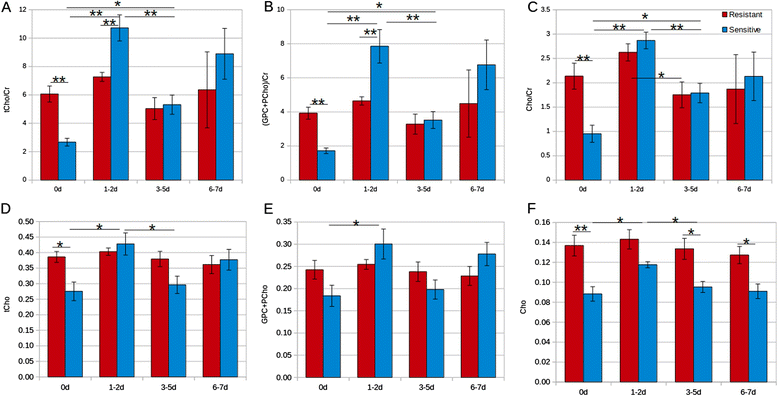
Results: The HRMAS spectra revealed significant metabolic differences between sensitive and resistant tissue samples. In particular choline metabolites were higher in resistant tumors by more than 50% with respect to creatine and by more than 30% with respect to all signals between 2.9 and 3.6 ppm. Shortly after treatment (1-2 days) the normalized choline metabolite levels were significantly increased by more than 30% in the sensitive group coinciding with the time of highest apoptotic activity induced by docetaxel. Thereafter, choline metabolites in these tumors returned towards pre-treatment levels. No change in choline compounds was observed in the resistant tumors over the whole time of investigation.
Conclusions: Relative tissue concentrations of choline compounds are higher in docetaxel resistant than in sensitive BRCA1-mutated mouse mammary tumors, but in the first days after docetaxel treatment only in the sensitive tumors an increase of these compounds is observed. Thus both pre- and post-treatment tissue levels of choline compounds have potential to predict response to docetaxel treatment.
Figures


References
Publication types
MeSH terms
Substances
LinkOut - more resources
Full Text Sources
Other Literature Sources
Miscellaneous

