. 2015 Mar 7:12:4.
doi: 10.1186/s12989-015-0080-x.

Cationic nanoparticles directly bind angiotensin-converting enzyme 2 and induce acute lung injury in mice

Affiliations

Cationic nanoparticles directly bind angiotensin-converting enzyme 2 and induce acute lung injury in mice

Yang Sun et al. Part Fibre Toxicol. .

Abstract

Background: Nanoparticles have become a key technology in multiple industries. However, there are growing reports of the toxicity of nanomaterials to humans. In particular, nanomaterials have been linked to lung diseases. The molecular mechanisms of nanoparticle toxicity are largely unexplored.

Methods: Acute lung injury was induced in wild-type mice and angiotensin-coverting enzyme 2 (ACE2) knockout mice by the intratracheal instillation of cationic polyamidoamine dendrimer (PAMAM) nanoparticles. For rescue experiments, losartan (15 mg/kg in PBS) was injected intraperitoneally 30 min before nanoparticle administration.

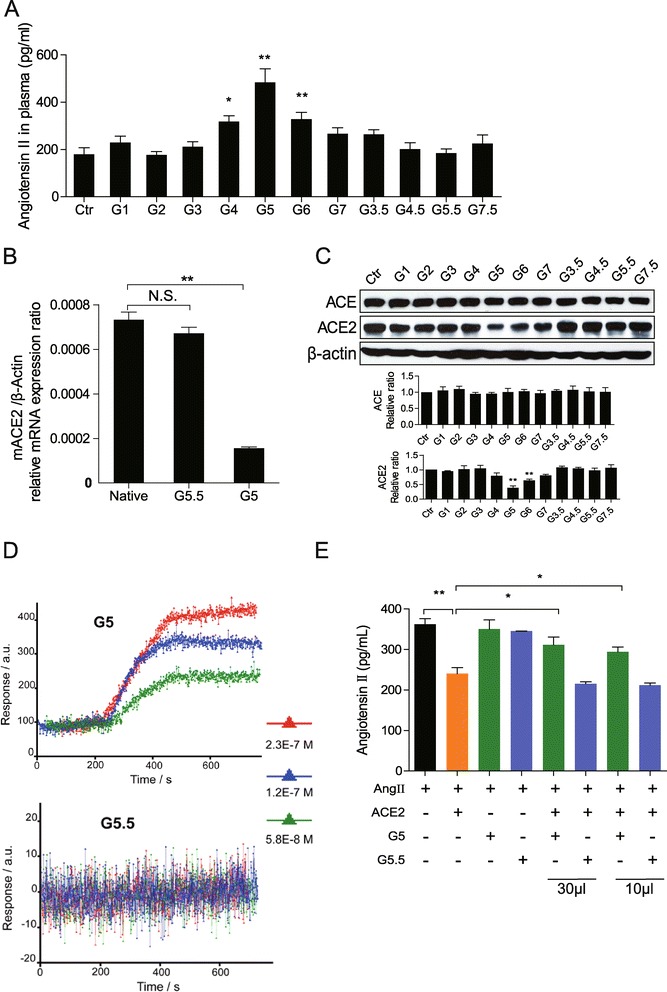
Results: Some PAMAM nanoparticles, but not anionic PAMAM nanoparticles or carbon nanotubes, triggered acute lung failure in mice. Mechanistically, cationic nanoparticles can directly bind ACE2, decrease its activity and down-regulate its expression level in lung tissue, resulting in deregulation of the renin-angiotensin system. Gene inactivation of Ace2 can exacerbate lung injury. Importantly, the administration of losartan, which is an angiotensin II type I receptor antagonist, can ameliorate PAMAM nanoparticle-induced lung injury.

Conclusions: Our data provide molecular insight into PAMAM nanoparticle-induced lung injury and suggest potential therapeutic and screening strategies to address the safety of nanomaterials.


Figures

Figure 1
Figure 1
G5 PAMAM dendrimers induce severe acute lung injury. (A) Wet-to-dry weight ratios of the lungs after the administration of nanoparticles (15 μg/g) at 10 hrs after administration. n = 4–6 mice per group. **p < 0.01 compared with the G4-, G5-, G6-, and G7-treated groups and the vehicle control cohort using two-tailed t-test analysis. (B) Survival rates. n = 10 mice per group. **p < 0.01 for the comparison of the G5 group with either the G5.5 or control group. (log-rank test). (C) Arterial blood partial oxygen pressure (PaO2) and (D) Lung wet-to-dry weight ratios 10 hrs after the intratracheal instillation of the vehicle control, G5.5 (15 μg/g), or G5 (15 μg/g). n = 5 mice per group. **p < 0.01 for the comparison of the G5-treated cohorts with the G5.5-treated and control groups. (two-tailed t-test). (E) Change in lung elastance following a challenge with nanoparticles (15 μg/g) or the vehicle. n = 5–6 mice per group. (ANOVA with Bonferroni post-hoc analysis). (F) Representative images of lung pathology 10 hrs after the administration of the vehicle control or G5.5 or G5 nanoparticles (15 μg/g). The mean number of infiltrating cells per microscopic field ± SEM is also shown. n = 100 fields analyzed for three mice for each treatment group. (two-tailed t-test). Scale bar = 100 μm. (G) Representative images of lungs injected with Evans blue 10 hrs after challenge with nanoparticles (15 μg/g) or the vehicle (control). The amount of extravascular Evans blue was determined 10 hrs after the injection of nanoparticles or vehicle. n = 4–5 mice per group. (two-tailed t-test). Data are shown as the mean values ± SEM, except the survival curve. *p < 0.05 or **p < 0.01.
Figure 2
Figure 2
Down-regulated ACE2 expression in mice challenged with cationic PAMAM dendrimers. (A) Levels of AngII in the plasma of the vehicle- (control) and nanoparticle-treated (15 μg/g) mice at 3 hrs after administration. AngII levels were determined using radioimmunoassays. n = 4–5 mice per group. *p < 0.05 or **p < 0.01 for the comparison of the G4, G5-, and G6-treated groups with the vehicle (control) group (two-tailed t-test). (B) The ACE2 mRNA relative expression level of the vehicle- (control) and nanoparticle-treated (15 μg/g) mice at 3 hrs after administration. Data were normalized to the expression of β-actin reference gene. (two-tailed t-test). (C) Western blots of total lung samples obtained 3 hrs after the instillation of nanoparticles (15 μg/g). The blots are representative of three different mice for each treatment. Quantitative analyses of the ACE and ACE2 protein levels are illustrated. The levels are shown as the mean ACE- and ACE2-to-β-actin ratios ± SEM. n = 3 mice per treatment. **p < 0.01 for the comparison of the G5-, and G6-treated groups with the vehicle group (two-tailed t-test). (D) Binding of G5 and G5.5 nanoparticles to recombinant human ACE2 at different concentrations was measured by surface plasmon resonance (SPR). The detailed dynamic binding constant and equilibrium dissociation constant are shown in Table S2. (E) G5 and G5.5 nanoparticles at different concentrations were incubated with recombinant ACE2 and AngII. The levels of AngII in the enzymatic activity measurement system were determined by radioimmunoassay. n = 3 tests per group. (two-tailed t-tests). Data are shown as the mean values ± SEM. *p < 0.05 or **p < 0.01; N.S. means not significant.
Figure 3
Figure 3
Ace2 deficiency increases the severity of G5 PAMAM nanoparticle-induced acute lung injury. (A) Survival rates of vehicle- (control) or G5 PAMAM-treated (15 μg/g) wild-type (WT) and Ace2-knockout (ACE2 KO) mice. n = 10 mice per group. **p < 0.01 for the comparison of the WT + G5 group with the ACE2 KO + G5 group (log-rank test). (B) Percent changes in the lung elastance of the vehicle control and PAMAM G5-treated (15 μg/g) WT and ACE2 KO mice at the indicated time points. n = 6 mice per group. **p < 0.01 for the comparison of the WT + G5 group with the ACE2 KO + G5 group at the indicated time points. (ANOVA with Bonferroni post-hoc analysis). (C) PaO2 in the arterial blood of vehicle- (control) or G5 PAMAM-treated (15 μg/g) WT and ACE2 KO mice. n = 4–7 mice per group. (two-tailed t-test). (D) Wet-to-dry weight ratios of the lungs of WT and ACE2 KO mice 10 hrs after intratracheal instillation of vehicle (control) or G5 PAMAM (15 μg/g). n = 4 mice per group. (two-tailed t-test). (E) Representative lung pathologies of WT and ACE2 KO mice 10 hrs after the administration of vehicle (control) or G5 PAMAM (15 μg/g). The numbers of infiltrating cells per microscopic field ± SEM are also shown. n = 100 fields analyzed for three mice for each treatment. (two-tailed t-test). Scale bar = 100 μm. Data are shown as the mean values ± SEM, except the survival curve. *p < 0.05 or **p < 0.01.
Figure 4
Figure 4
Losartan reduces the severity of G5 PAMAM nanoparticle-induced acute lung injury. (A) Survival rates at indicated times (log-rank test), (B) percent change in lung elastance at indicated times (ANOVA with Bonferroni post hoc analyses), (C) plasma AngII levels (at 3 hrs, two-tailed t-tests), (D) lung wet-to-dry weight ratios (at 10 hrs, two-tailed t-tests), (E) blood oxygenation (at 10 hrs, two-tailed t-tests), (F) vascular leakage (at 10 hrs, two-tailed t-tests), (G) histopathology, lung infiltrating cells counting (at 10 hrs) and (H) IL-6 concentration in BALF (at 10 hrs) of control WT mice, WT mice treated with G5 PAMAM nanoparticles (15 μg/g), and WT mice treated with G5 PAMAM nanoparticles (15 μg/g) plus losartan (15 mg/kg i.p.). n = 4–10 mice per group. (two-tailed t-tests). In (G), representative lung histopathologies and the mean numbers of lung-infiltrating cells ± SEM per microscopic field (100 fields were analyzed; n = 3 mice per group) are shown. Scale bar = 100 μm. Data are shown as the mean values ± SEM, except the survival curve. *p < 0.05 or **p < 0.01. N.D. means not detectable.

References

    1. Brumfiel G. Consumer products leap aboard the nano bandwagon. Nature. 2006;440:262. doi: 10.1038/440262b. - DOI - PubMed
    1. Yokel RA, Macphail RC. Engineered nanomaterials: exposures, hazards, and risk prevention. J Occup Med Toxicol. 2011;6:7. doi: 10.1186/1745-6673-6-7. - DOI - PMC - PubMed
    1. Oberdorster G. Safety assessment for nanotechnology and nanomedicine: concepts of nanotoxicology. J Intern Med. 2010;267:89–105. doi: 10.1111/j.1365-2796.2009.02187.x. - DOI - PubMed
    1. Nel A, Xia T, Madler L, Li N. Toxic potential of materials at the nanolevel. Science. 2006;311:622–7. doi: 10.1126/science.1114397. - DOI - PubMed
    1. Ai J, Biazar E, Jafarpour M, Montazeri M, Majdi A, Aminifard S, et al. Nanotoxicology and nanoparticle safety in biomedical designs. Int J Nanomedicine. 2011;6:1117–27. - PMC - PubMed

Publication types

MeSH terms