. 2015 Apr 19:29:224-36; discussion 236.
doi: 10.22203/ecm.v029a17.

Fact versus artifact: avoiding erroneous estimates of sulfated glycosaminoglycan content using the dimethylmethylene blue colorimetric assay for tissue-engineered constructs

Affiliations

Fact versus artifact: avoiding erroneous estimates of sulfated glycosaminoglycan content using the dimethylmethylene blue colorimetric assay for tissue-engineered constructs

C H Zheng et al. Eur Cell Mater. .

Abstract

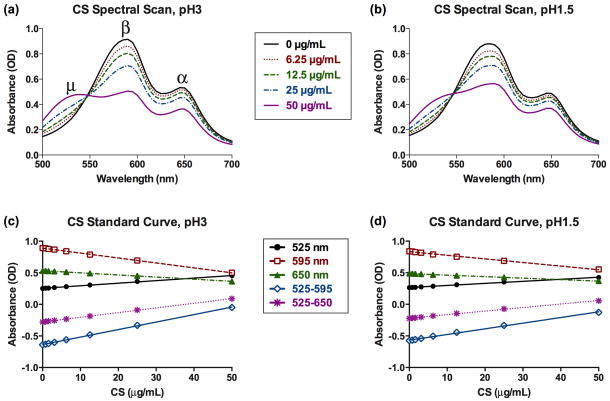
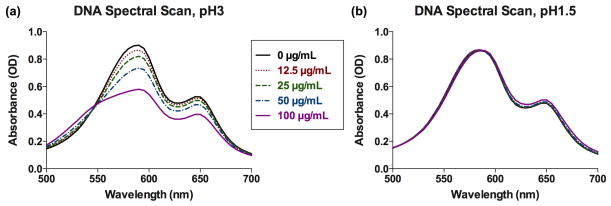
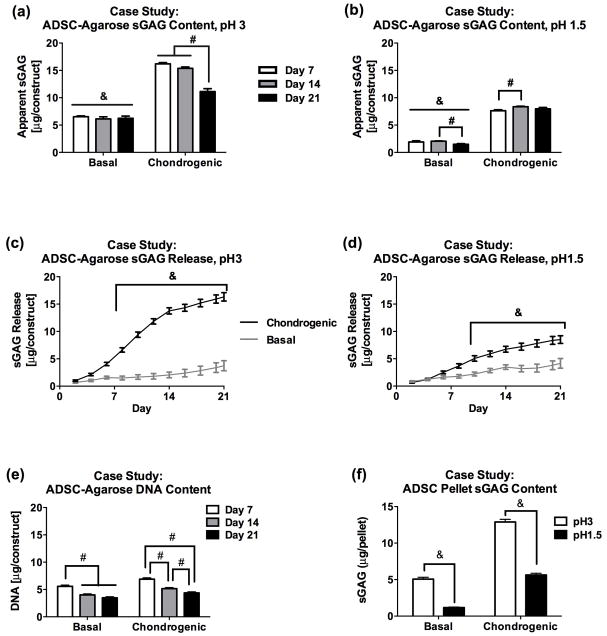
The 1,9-dimethylmethylene blue (DMMB) assay is widely used to quantify sulfated glycosaminoglycan (sGAG) contents of engineered tissues, culture media, tissue samples and bodily fluids, but the assay is subject to interference from polyanions such as hyaluronic acid (HA), DNA and RNA. We examined whether specific combinations of dye pH and absorbance wavelength could minimize non-sGAG artifacts without compromising DMMB assay sensitivity. HA and DNA solutions generated substantial signal at pH 3 but not at pH 1.5. Reducing dye pH did not significantly alter sGAG measurements for normal cartilage and meniscus tissues, but eliminated anomalously high apparent sGAG contents for enzymatically isolated chondrocytes, adipose-derived stem cell (ADSC)-agarose constructs and ADSC pellets. In a cartilage tissue-engineering case study, pH 3 dye indicated high apparent sGAG readings throughout culture in both basal and chondrogenic media, with a marked decline between day 14 and 21 for chondrogenic constructs. The pH 1.5 dye, however, indicated minimal sGAG accumulation in basal medium and stable sGAG content throughout culture in chondrogenic medium. As it is often difficult to know a priori whether all groups in a study will have sGAG contents high enough to overwhelm artifacts, we recommend modifying the standard DMMB assay to reduce the risk of spurious findings in tissue engineering and clinical research. Specifically, we recommend shifting to a pH 1.5 DMMB dye and basing quantification on the absorbance difference between 525 nm (µ peak) and 595 nm (β peak) to compensate for the moderate loss of sensitivity associated with reducing the dye pH.


Figures

Figure 1
Figure 1
(a) pH 3 and (b) pH 1.5 DMMB dyes react to increasing concentrations of chondroitin sulfate by shifting their spectral profiles; the β (590 nm) and α (650 nm) peaks decline while the μ (525 nm) peak emerges. Assay sensitivity, defined as slope of the standard curve, is greater for (c) pH 3 than for (d) pH 1.5 dye and is enhanced by using the difference between two wavelengths. The slopes of the standard curves for CS standards are significantly different from zero for all wavelengths, with P <0.0001 and R2> 0.99.
Figure 2
Figure 2
(a) pH 3 DMMB dye is sensitive to the presence of DNA, as evidenced by altered spectral profiles with increasing DNA concentrations, but (b) pH 1.5 DMMB dye is minimally sensitive to DNA.
Figure 3
Figure 3
Plot of DMMB assay sensitivity (standard curve slope) to (a) chondroitin sulfate (CS), (b) dermatan sulfate (DS), (c) heparan sulfate (HS), (d) hyaluronic acid, and (e) DNA as measured using dye ranging from pH 1 up to pH 6 at different absorbance wavelengths. Sensitivities were highest when using pH 3 or higher DMMB dye and when analyzed using 525–595 nm. Half maximal effective assay sensitivity (EC50) and standard error of EC50 are reported for all species but HA, whose transition was too abrupt to fit with the logistic dose-response model.
Figure 4
Figure 4
DMMB measurements of sGAG content for (a) cartilage and (b) meniscus were not significantly different at pH 3 compared with pH 1.5. (c) Isolated chondrocytes have negligible sGAG content when assayed at pH 1.5 but not at pH 3. (d) Freshly seeded ADSC-agarose constructs had significantly higher apparent sGAG content at pH 3 than at pH 1.5, even after combined DNase and chondroitinase treatment. Analyses were performed using OD525-OD595. & Significantly different when assayed using pH 3 and pH 1.5 DMMB dye. (P <0.05)
Figure 5
Figure 5
(a) Results from the pH 3 DMMB assay indicate that basal samples maintained approximately 6 μg sGAG throughout culture whereas the sGAG content of chondrogenic samples, although higher at day 7 (16.19 ± 0.24 μg), dropped by day 21 (11.12 + 0.53 μg). (b) Results from the pH 1.5 assay indicate that basal samples retained minimal sGAG while chondrogenic samples maintained stable sGAG content throughout culture. (c, d) Cumulative sGAG release measurements taken with pH 3 dye are almost double those assayed at pH 1.5 for chondrogenic samples. (e) DNA content for ADSC-agarose constructs cultured in either basal or chondrogenic medium decreased with time in culture, with day 21 DNA contents measuring lower than those on day 7. (f) ADSC pellets assayed after 28 days of culture in either basal or chondrogenic medium showed significantly lower sGAG measurements when assayed at pH 1.5 as compared with pH 3. Average DNA content per sample was 3.64 ± 0.13 μg for basal and 4.97 ± 0.16 μg for the chondrogenic group. Analyses were performed using OD525-OD595. & Significantly different between basal and chondrogenic groups. # Significantly different between time points. (P<0.05)
Figure 6
Figure 6
Citation patterns for the DMMB assay in (a) 111 research articles involving chondrogenic pellet culture over a 5 year period and (b) 164 research articles involving cartilage tissue engineering over a 1 year period, based on examination of articles identified through PubMed searches. In both literature segments, these articles employing some variant of the DMMB assay represent approximately 38% of the total number of identified articles.

References

    1. Barbosa I, Garcia S, Barbier-Chassefiere V, Caruelle JP, Martelly I, Papy-Garcia D. Improved and simple micro assay for sulfated glycosaminoglycans quantification in biological extracts and its use in skin and muscle tissue studies. Glycobiology. 2003;13:647–653. - PubMed
    1. Billington CJ. Cartilage proteoglycan release assay. Methods Mol Biol. 2001;151:451–456. - PubMed
    1. Bitter T, Muir HM. A modified uronic acid carbazole reaction. Anal Biochem. 1962;4:330–334. - PubMed
    1. Chandrasekhar S, Esterman MA, Hoffman HA. Microdetermination of proteoglycans and glycosaminoglycans in the presence of guanidine hydrochloride. Anal Biochem. 1987;161:103–108. - PubMed
    1. de Jong JG, Heijs WM, Wevers RA. Mucopolysaccharidoses screening: dimethylmethylene blue versus alcian blue. Ann Clin Biochem. 1994;31 (Pt 3):267–271. - PubMed

Publication types

MeSH terms