. 2015 Apr 20:6:6921.
doi: 10.1038/ncomms7921.

Epigenomic evolution in diffuse large B-cell lymphomas

Affiliations

Epigenomic evolution in diffuse large B-cell lymphomas

Heng Pan et al. Nat Commun. .

Abstract

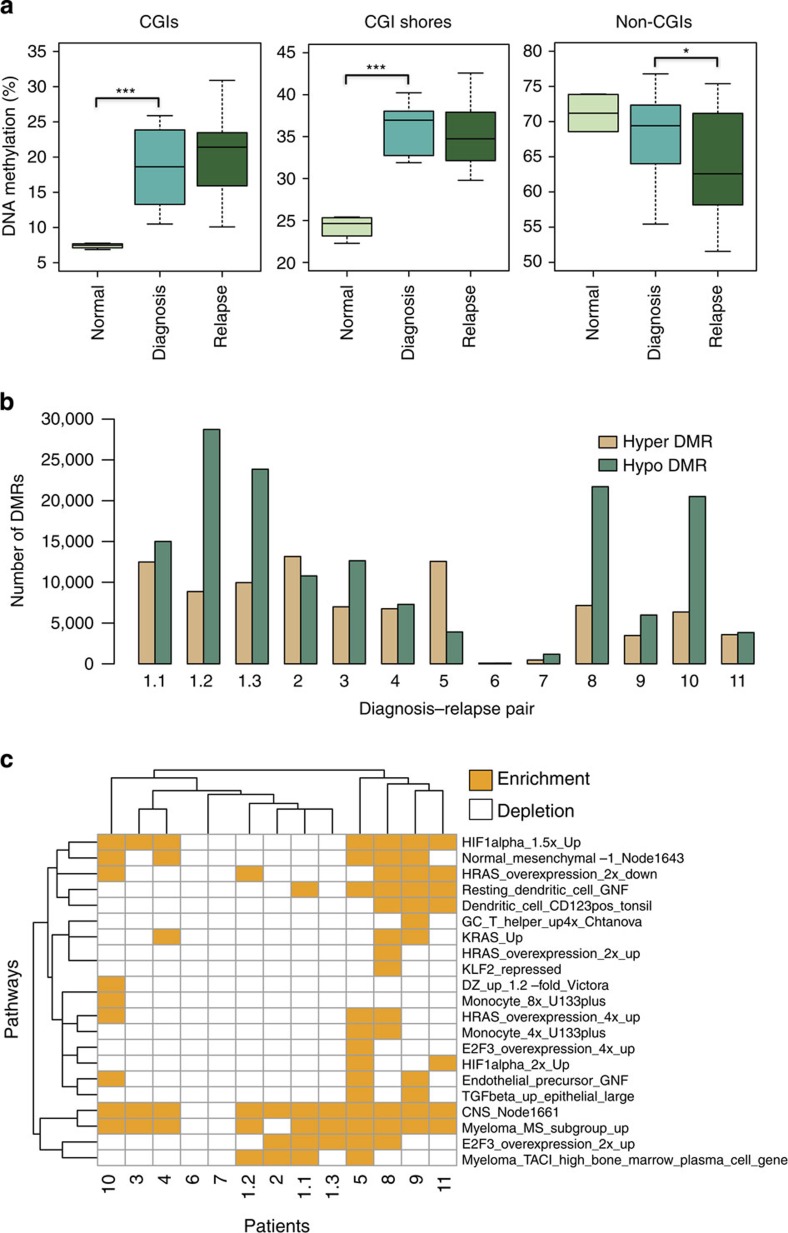
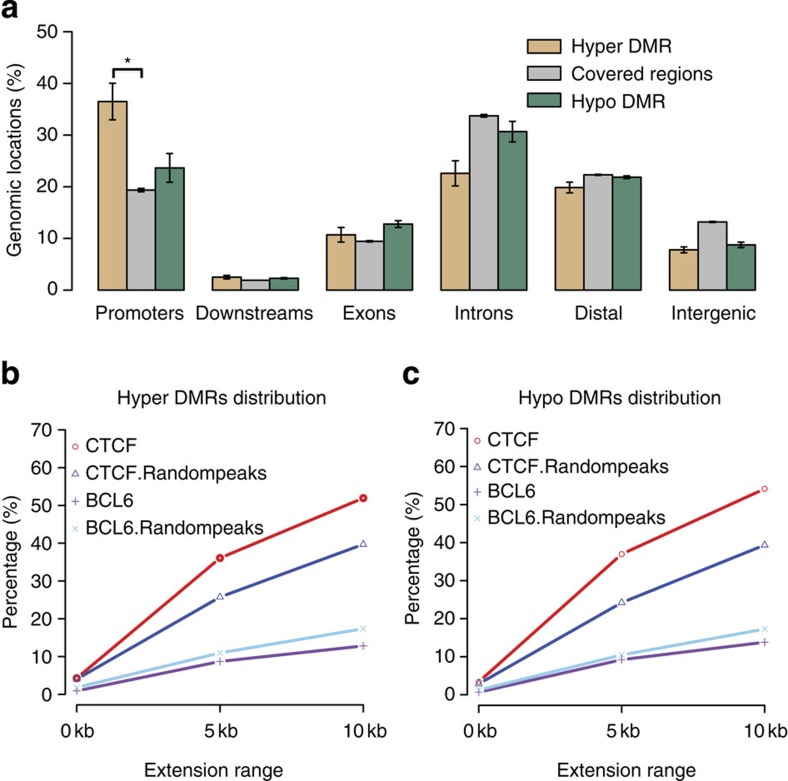
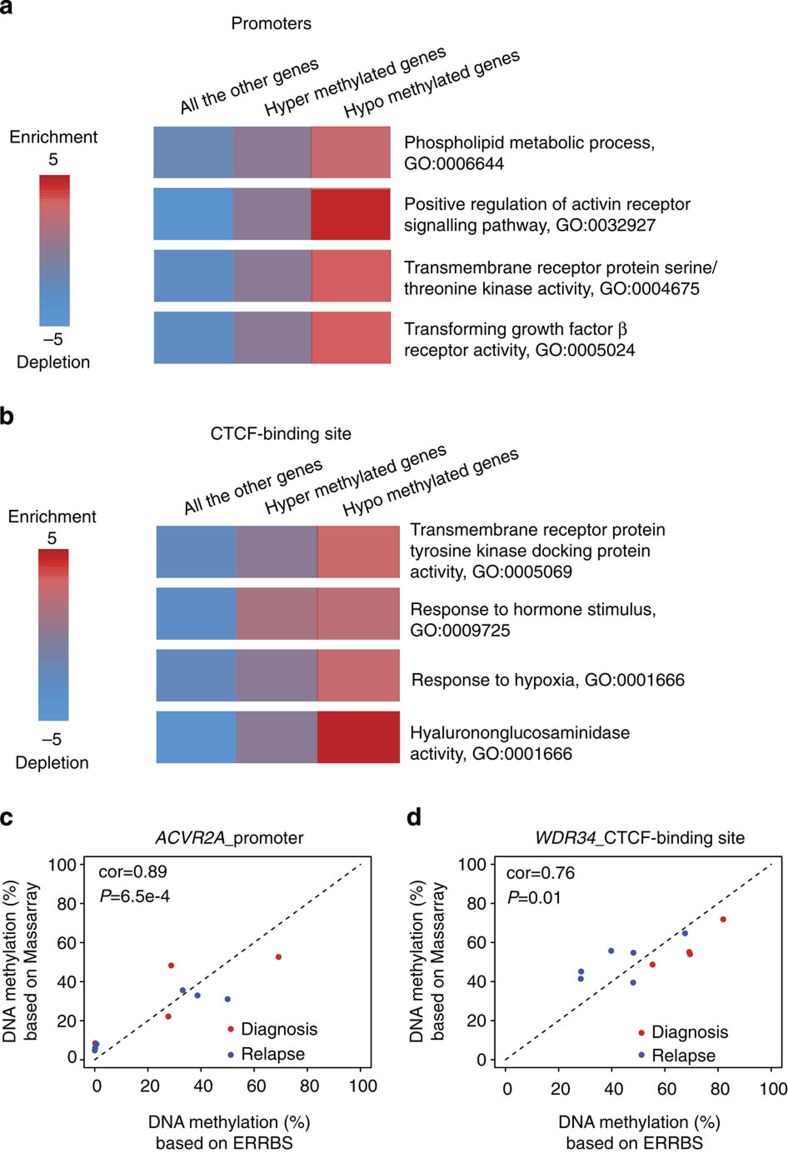
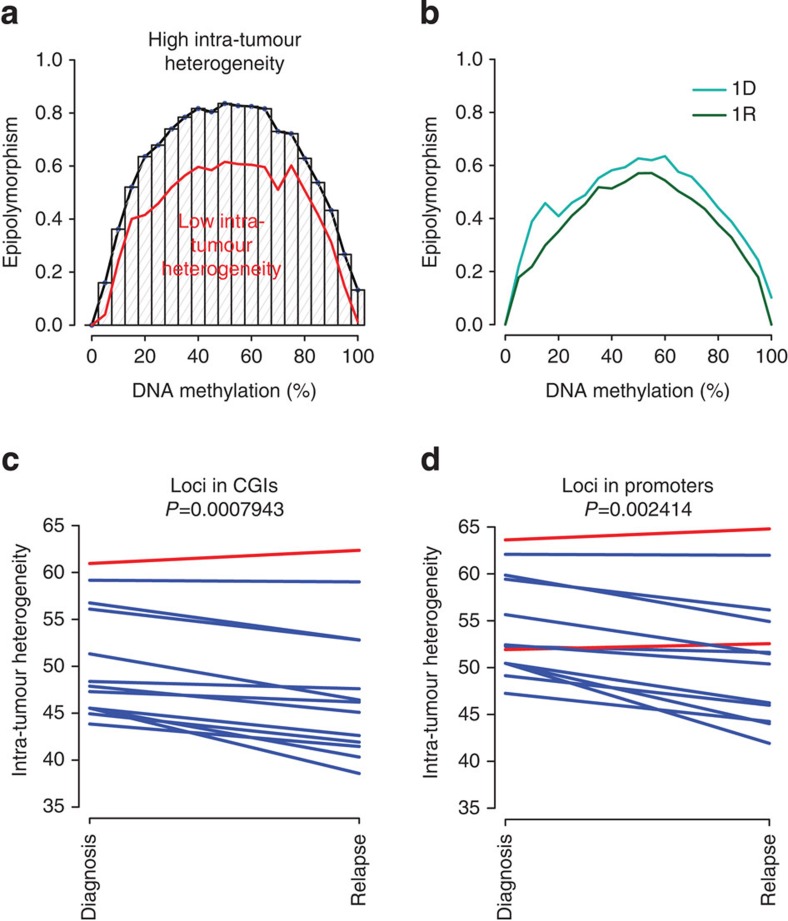
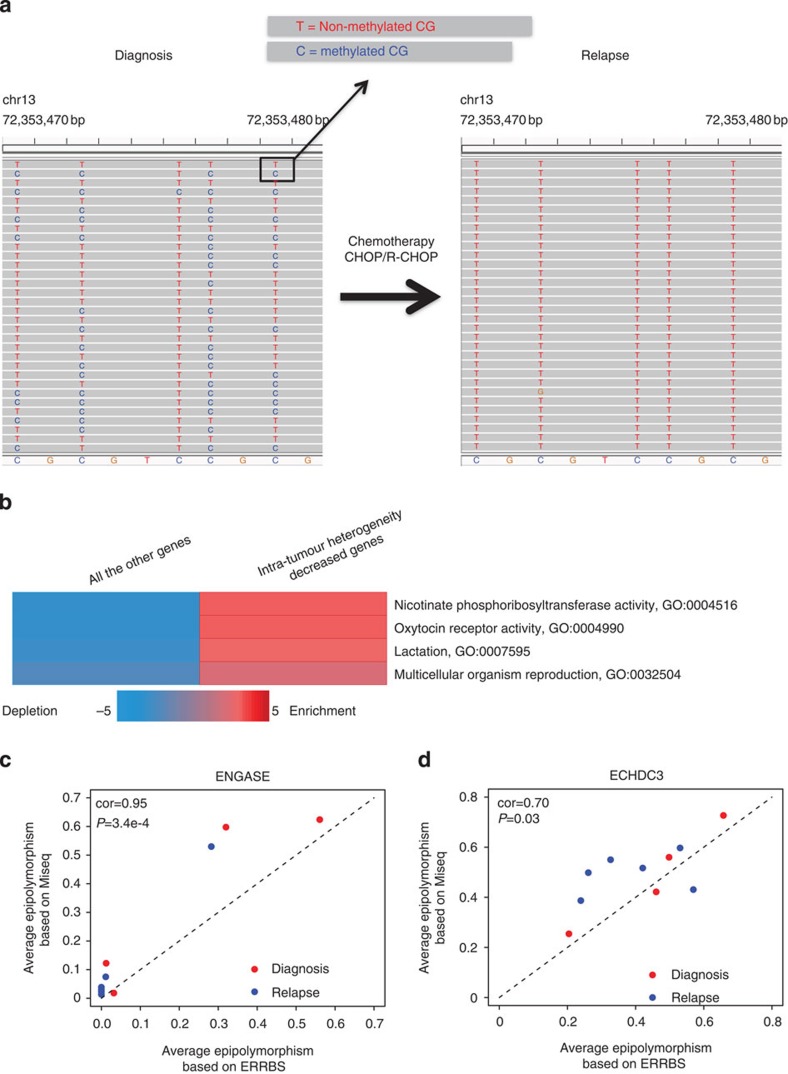
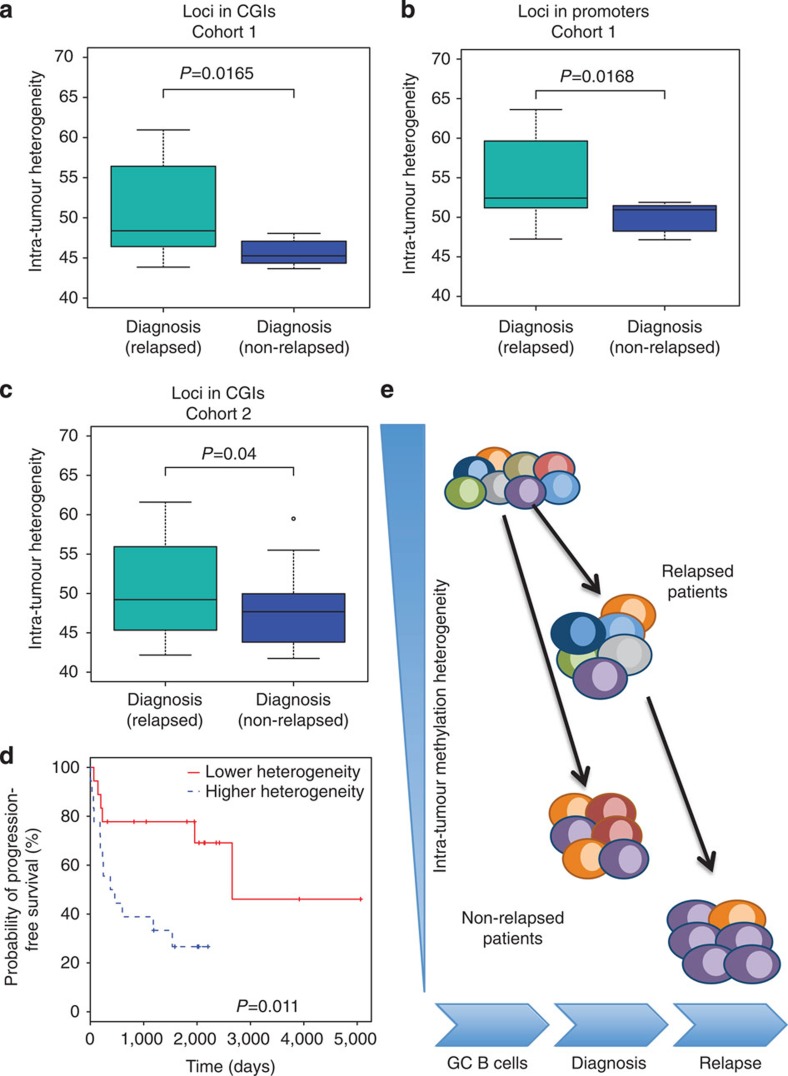
The contribution of epigenomic alterations to tumour progression and relapse is not well characterized. Here we characterize an association between disease progression and DNA methylation in diffuse large B-cell lymphoma (DLBCL). By profiling genome-wide DNA methylation at single-base pair resolution in thirteen DLBCL diagnosis-relapse sample pairs, we show that DLBCL patients exhibit heterogeneous evolution of tumour methylomes during relapse. We identify differentially methylated regulatory elements and determine a relapse-associated methylation signature converging on key pathways such as transforming growth factor-β (TGF-β) receptor activity. We also observe decreased intra-tumour methylation heterogeneity from diagnosis to relapsed tumour samples. Relapse-free patients display lower intra-tumour methylation heterogeneity at diagnosis compared with relapsed patients in an independent validation cohort. Furthermore, intra-tumour methylation heterogeneity is predictive of time to relapse. Therefore, we propose that epigenomic heterogeneity may support or drive the relapse phenotype and can be used to predict DLBCL relapse.


Figures

Figure 1
Figure 1. DNA methylation landscape changes in DLBCL patients.
(a) Percentage of DNA methylation in CGIs, CGI shores and non-CGIs of normal B cells (n=4) and diagnosis–relapse DLBCL sample pairs (n=13). For each CpG, we collected the number of methylated reads and the number of total reads. The DNA methylation for different genomic regions for each sample was calculated by the percentage of methylated reads out of total reads from all the CpGs inside corresponding regions. ***P<1e−5, *P<0.05 (t-test, normal versus diagnosis; paired t-test, diagnosis versus relapse). The median, upper and lower quartiles are shown. Whiskers represent upper quartile+1.5 IQR and lower quartile−1.5 IQR. (b) Numbers of hypermethylated or hypomethylated DMRs of individual DLBCL patients, between diagnosis and relapse. Patient 1 had 3 sites of relapse and consequently 3 diagnosis–relapse pairs were analysed (the same diagnosis sample was used for all comparisons). Out of 13, 11 pairs show more hypomethylated regions than hypermethylated regions. (c) Pathways overexpressed with hypermethylated genes (promoters overlapped with hypermethylation DMRs) of individual patients were illustrated here. Each row represents a single pathway and each column represents a patient pair. The enrichment of the pathways was determined in a patient-by-patient manner (n=1, P<0.005, randomization-based non-parametric testing). GO analyses were performed with iPAGE. Pathways from the lymphoid gene signature database for Staudt Lab were used here. The background included around 24,000 genes from Refseq. IQR, interquartile range.
Figure 2
Figure 2. Consistently differentially methylated regulatory elements between diagnosis and relapsed patients.
(a) Percentage of hypermethylated regions, ERRBS-covered regions and hypomethylated regions within indicated genomic locations. *P<2.2e−16 (binomial test). Standard errors are shown as error bars. (b) Percentage of hypermethylated DMRs occurring within CTCF peaks, CTCF random peaks, BCL6 peaks and BCL6 random peaks. (c) Percentage of hypomethylated DMRs occurring within CTCF peaks, CTCF random peaks, BCL6 peaks and BCL6 random peaks. In b,c, random peaks were generated randomly with the same genomic distribution as the true binding sites.
Figure 3
Figure 3. Methylation signature at relapse involves key genes and pathways.
(a) Pathways over-represented within consistently differentially methylated genes (based on promoters) across all the patients. P values were 0.0030, 0.0001, 0.0005 and 0.0009 from top to bottom (hypergeometric tests). (b) Pathways over-represented within genes in the neighbourhood of hypomethylation or hypermethylation CTCF peaks (≤10 kb). P values were 0.0036, 0.0024, 0.0029 and 0.0000 from top to bottom (hypergeometric tests). In a,b, GO analyses were performed with iPAGE. Known pathways in the GO were used here. The background included around 24,000 genes from Refseq gene annotation. The red colour indicates (in log10) the over-represented P values and the blue shows under-representation. (c) Correlations of average methylation level between ERRBS and MassArray in ACVR2A promoter. (d) Correlations of average methylation level between ERRBS and MassArray in CTCF-binding site near WDR34. In c,d, red and blue dots represent diagnosis and relapsed samples, respectively. P values were derived from correlation test (cor.test() function in R).
Figure 4
Figure 4. Intra-tumour MH decreases from diagnosis to relapse in DLBCL patients.
(a) Epipolymorphism levels are dependent on DNA methylation levels. All the loci were divided into different groups based on their methylation level and median epipolymorphism of each group is calculated. Genome-wide intra-tumour MH was quantified by area under the median line. (b) Median epipolymorphism lines for diagnosis and relapse tumors from patient 1.1 in our cohort. Intra-tumor MH visibly decreased with tumour evolution. (c) Relapsed samples displayed significant lower intra-tumour MH. Out of 13, 12 pairs displayed lower intra-tumour MH. All the loci were located in CGIs. (d) Relapsed samples displayed significant lower intra-tumour MH. All the loci located in gene promoter. Out of 13, 11 pairs displayed lower intra-tumour MH. In c,d, intra-tumour MH was measured by area under median epipolymorphism line in sample-by-sample manner. P values were obtained from paired t-test of intra-tumour MH between diagnosis and relapsed samples.
Figure 5
Figure 5. Convergence of methylation patterns at relapse involves key genes and pathways.
(a) A locus displayed decreased intra-tumour MH from diagnosis to relapse. T and C at CpG site indicate unmethylated and methylated CpG separately. The tumour cell population displayed diverse DNA methylation patterns at diagnosis and the diversity is complete loss at relapse. (b) Pathways over-represented with decreased intra-tumour MH genes. P values were 0.0005, 0.0005, 0.0015 and 0.0048 from top to bottom (hypergeometric tests). GO analyses were performed with iPAGE. Known pathways in the GO were used here. The background included around 24,000 genes from Refseq gene annotation. The red colour indicates (in log10) the over-represented P values and the blue shows under-representation. (c) Correlations between the average intra-tumour MH derived from ERRBS or Bisulfite-PCR-MiSeq in ENGASE promoters. (d) Correlations between the average intra-tumour MH derived from ERRBS or Bisulfite-PCR-MiSeq in ECHDC3 promoters. In c,d, MiSeq based intra-tumour MH was calculated using the same analytical approach as the one used for ERRBS. Red and blue dots represent diagnosis and relapsed samples, respectively. P values were derived from correlation test (cor.test() function in R).
Figure 6
Figure 6. Intra-tumour MH at diagnosis is predictive of relapse occurrence.
(a) Non-relapsed patients (n=7) had lower intra-tumour MH compared with relapsed ones (n=11; Cohort 1). All the loci analysed were located in CGIs. (b) Non-relapsed patients (n=7) had lower intra-tumour MH compared with relapsed ones (n=11; Cohort 1). All the loci located in promoters. (c) Patients who had not relapsed in 5 years after diagnosis (n=19) had lower intra-tumour MH compared with relapsed one (n=29; Cohort 2). All the loci analysed here were located in CGIs. In ac, P values were obtained using t-test. The median, upper and lower quartiles are shown. Whiskers represent upper quartile+1.5 IQR and lower quartile−1.5 IQR. (d) Kaplan–Meier plot comparing the progression-free survival between DLBCL patients with higher (30%, n=18) versus lower (30%, n=18) intra-tumour MH (Cohort 2). P value was obtained using log-rank test. (e) Schematic of our epigenetic evolution model. Different colours represent different cell subgroups with different DNA methylation patterns. Intra-tumour MH decreased with tumour evolution. Non-relapse patients displayed lower intra-tumour MH compared with relapse ones.

References

    1. Armitage J. O. & Weisenburger D. D. New approach to classifying non-Hodgkin's lymphomas: clinical features of the major histologic subtypes. J. Clin. Oncol. 16, 2780–2795 (1998). - PubMed
    1. Morton L. M. et al. Lymphoma incidence patterns by WHO subtype in the United States, 1992-2001. Blood 107, 265–276 (2006). - PMC - PubMed
    1. Coiffier B. et al. CHOP chemotherapy plus rituximab compared with CHOP alone in elderly patients with diffuse large-B-cell lymphoma. N. Engl. J. Med. 346, 235–242 (2002). - PubMed
    1. Larouche J.-F. et al. Lymphoma recurrence 5 years or later following diffuse large B-cell lymphoma: clinical characteristics and outcome. J. Clin. Oncol. 28, 2094–2100 (2010). - PubMed
    1. Abramson J. S. & Shipp M. A. Advances in the biology and therapy of diffuse large B-cell lymphoma: moving toward a molecularly targeted approach. Blood 106, 1164–1174 (2005). - PubMed

Publication types

Substances

Associated data