

Local adaptation and oceanographic connectivity patterns explain genetic differentiation of a marine diatom across the North Sea-Baltic Sea salinity gradient
- PMID: 25892181
- PMCID: PMC4692096
- DOI: 10.1111/mec.13208
Local adaptation and oceanographic connectivity patterns explain genetic differentiation of a marine diatom across the North Sea-Baltic Sea salinity gradient
Abstract
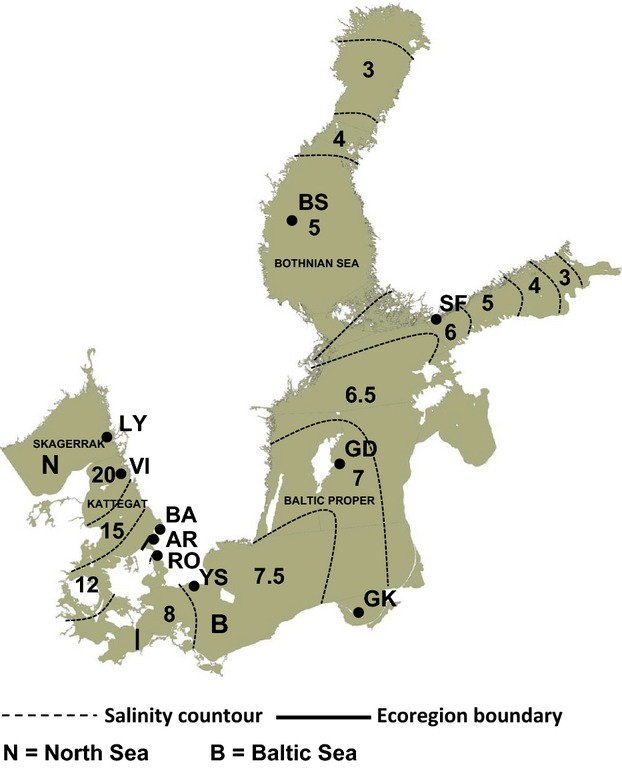
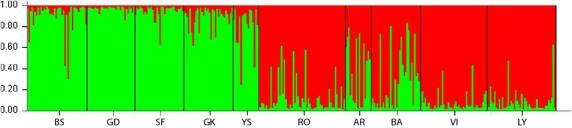
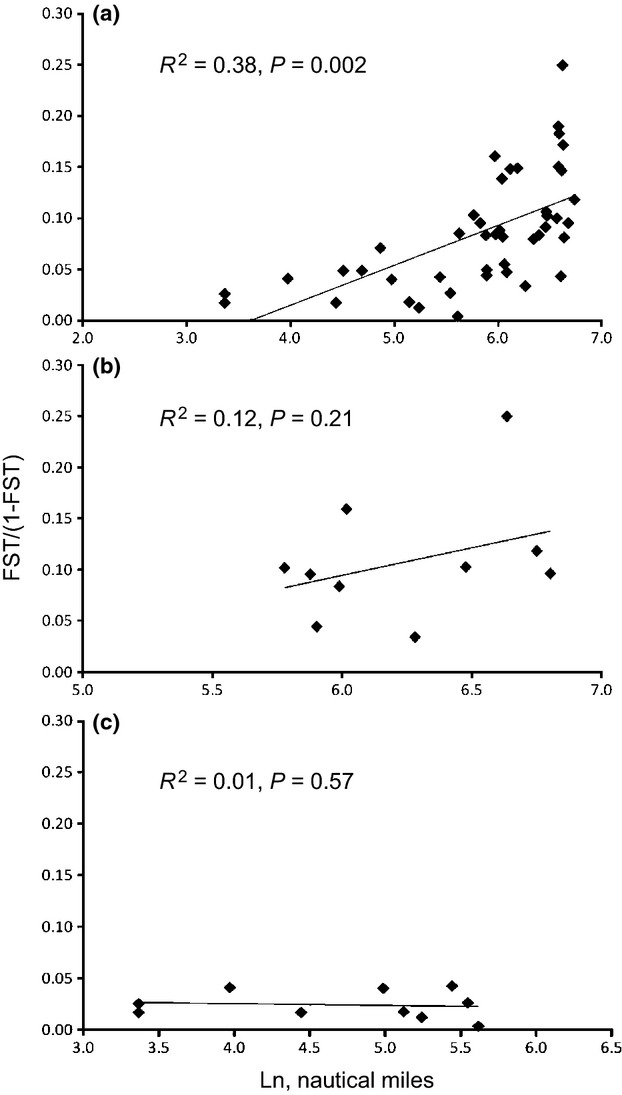
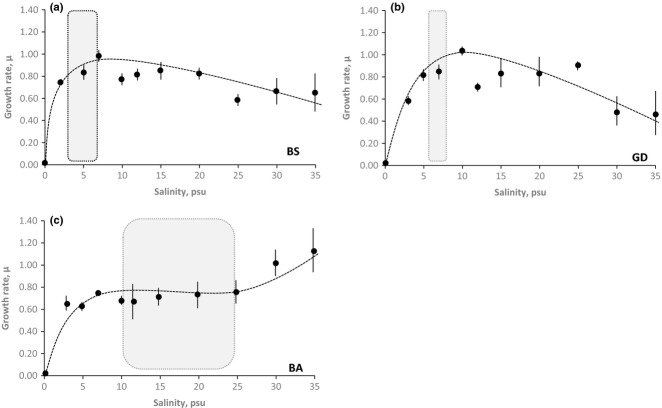
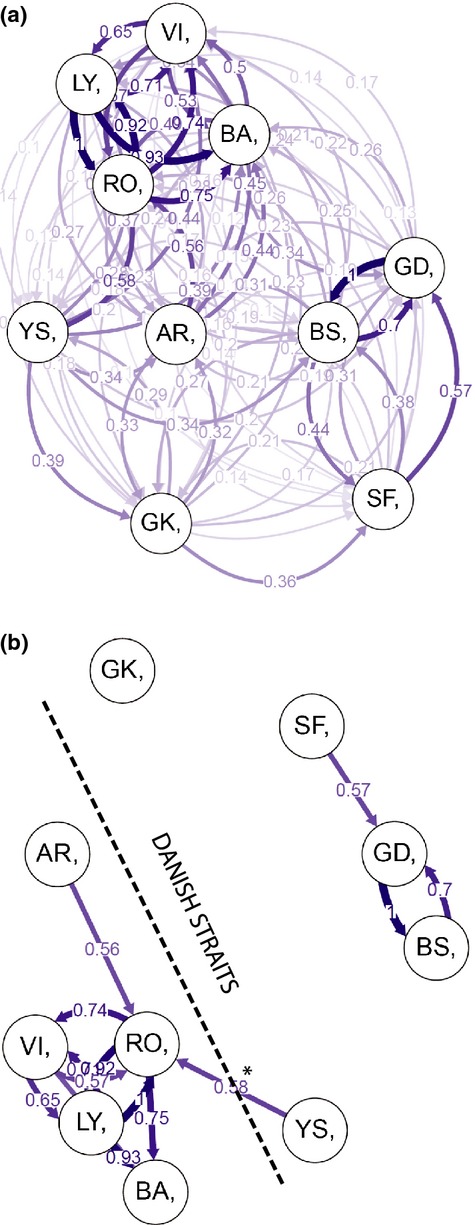
Drivers of population genetic structure are still poorly understood in marine micro-organisms. We exploited the North Sea-Baltic Sea transition for investigating the seascape genetics of a marine diatom, Skeletonema marinoi. Eight polymorphic microsatellite loci were analysed in 354 individuals from ten locations to analyse population structure of the species along a 1500-km-long salinity gradient ranging from 3 to 30 psu. To test for salinity adaptation, salinity reaction norms were determined for sets of strains originating from three different salinity regimes of the gradient. Modelled oceanographic connectivity was compared to directional relative migration by correlation analyses to examine oceanographic drivers. Population genetic analyses showed distinct genetic divergence of a low-salinity Baltic Sea population and a high-salinity North Sea population, coinciding with the most evident physical dispersal barrier in the area, the Danish Straits. Baltic Sea populations displayed reduced genetic diversity compared to North Sea populations. Growth optima of low salinity isolates were significantly lower than those of strains from higher native salinities, indicating local salinity adaptation. Although the North Sea-Baltic Sea transition was identified as a barrier to gene flow, migration between Baltic Sea and North Sea populations occurred. However, the presence of differentiated neutral markers on each side of the transition zone suggests that migrants are maladapted. It is concluded that local salinity adaptation, supported by oceanographic connectivity patterns creating an asymmetric migration pattern between the Baltic Sea and the North Sea, determines genetic differentiation patterns in the transition zone.
Keywords: local adaptation; marine phytoplankton; oceanographic connectivity; population genetics.
© 2015 John Wiley & Sons Ltd.
Figures
References
-
- Almany GR, De Arruda MP, Arthofer W, et al. Permanent genetic resources added to molecular ecology resources database 1 May 2009–31 July 2009. Molecular Ecology Resources. 2009;9:1460–1466. - PubMed
-
- Alpermann TJ, Beszteri B, John U, Tillmann U, Cembella AD. Implications of life-history transitions on the population genetic structure of the toxigenic marine dinoflagellate Alexandrium tamarense. Molecular Ecology. 2009;18:2122–2133. - PubMed
-
- Axe P. 2010. Baltic Sea environment fact sheet. HELCOM Baltic Sea Environment Fact Sheets. Online. 17.9.2014, http://www.helcom.fi/baltic-sea-trends/environment-fact-sheets/
-
- Balzano S, Sarno D, Kooistra WH. Effects of salinity on the growth rate and morphology of ten Skeletonema strains. Journal of Plankton Research. 2011;33:937–945.
Publication types
MeSH terms
Associated data
- Actions
- Actions
- Actions
- Actions
- Actions
- Actions
- Actions
LinkOut - more resources
Full Text Sources
Other Literature Sources
