. 2015 Apr 23;161(3):555-568.
doi: 10.1016/j.cell.2015.03.017. Epub 2015 Apr 16.

Pioneer transcription factors target partial DNA motifs on nucleosomes to initiate reprogramming

Affiliations

Pioneer transcription factors target partial DNA motifs on nucleosomes to initiate reprogramming

Abdenour Soufi et al. Cell. .

Abstract

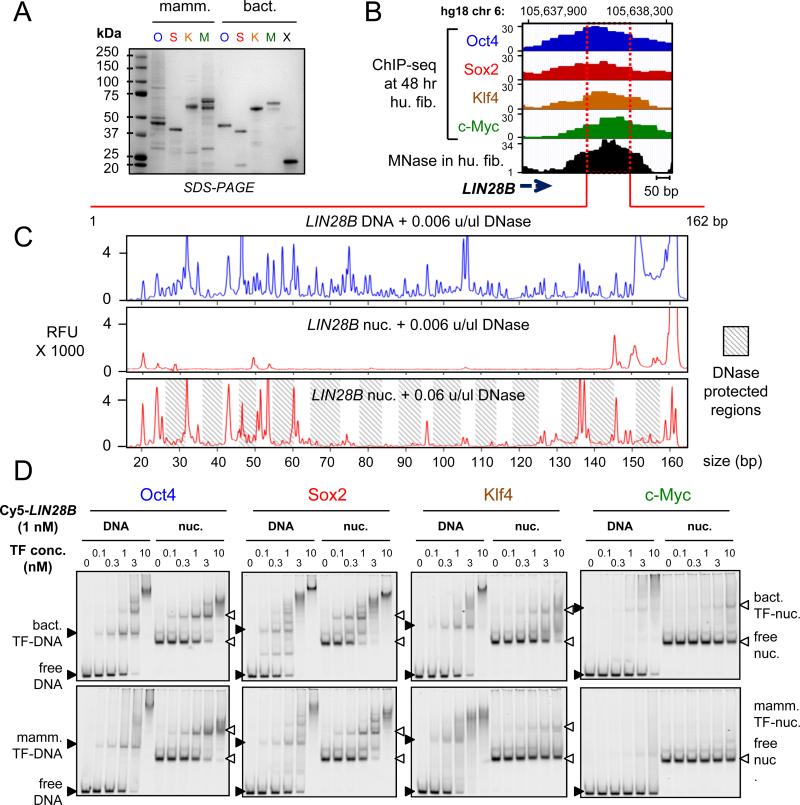
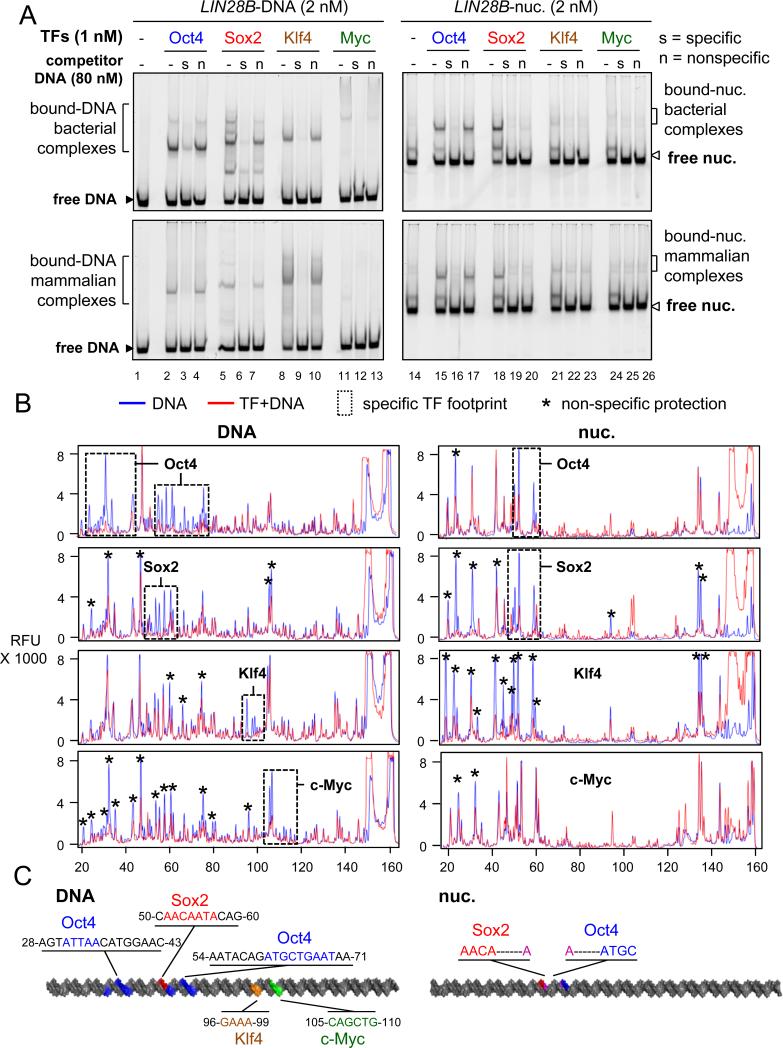
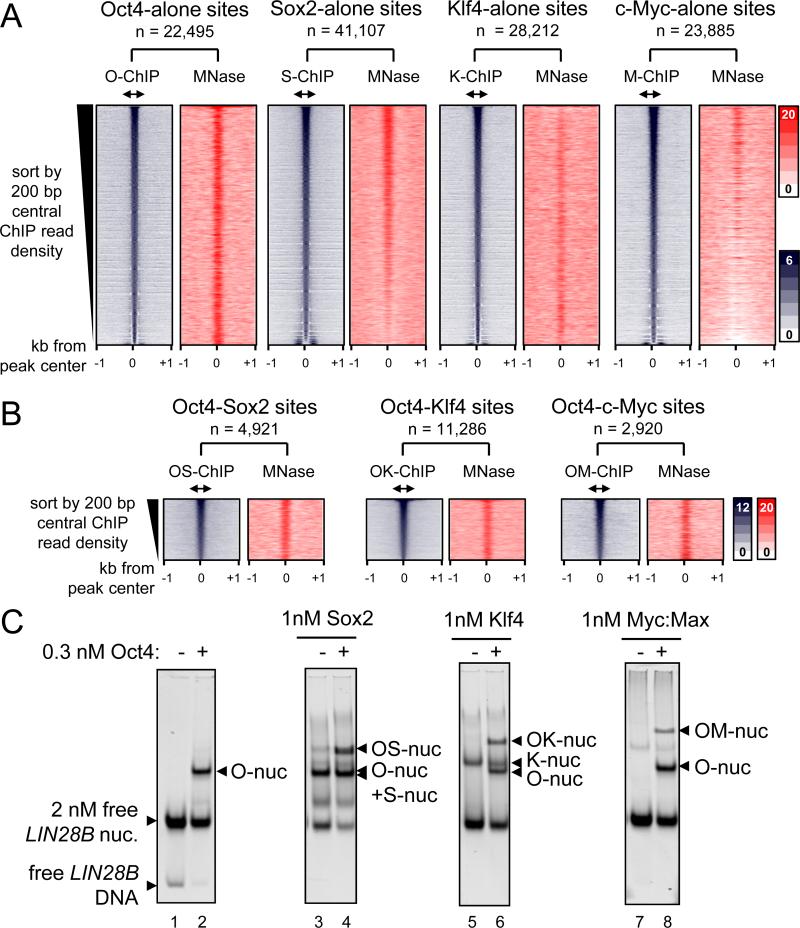
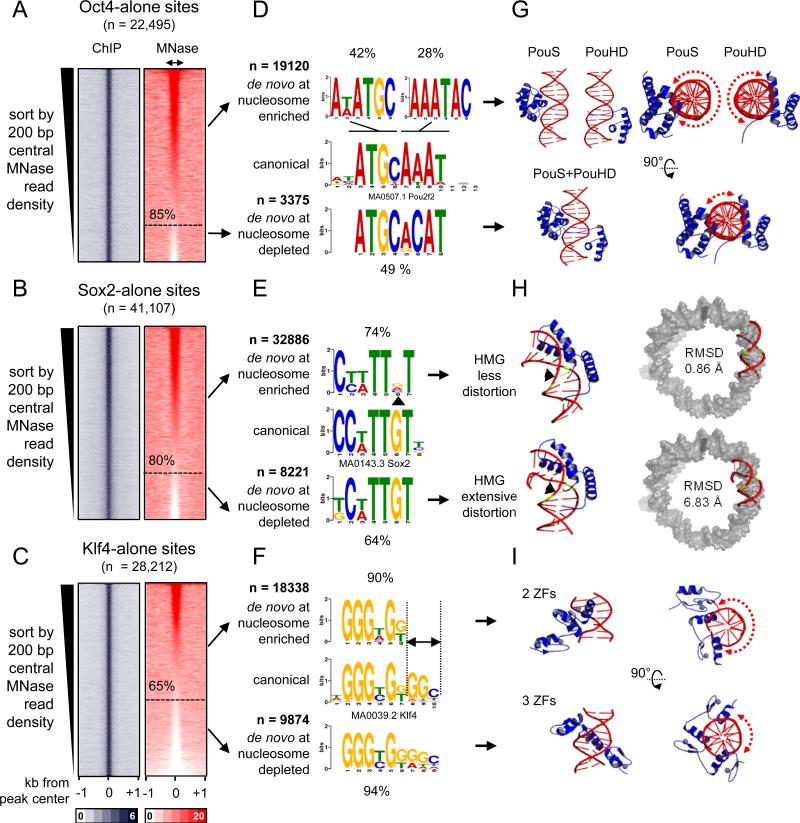
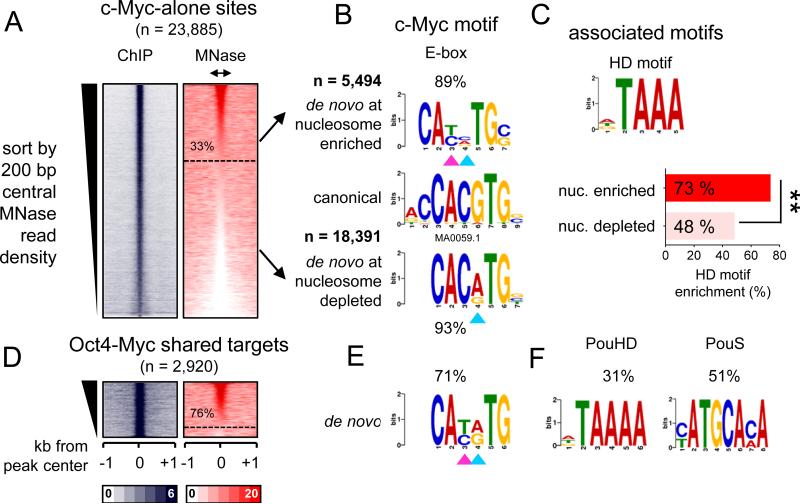
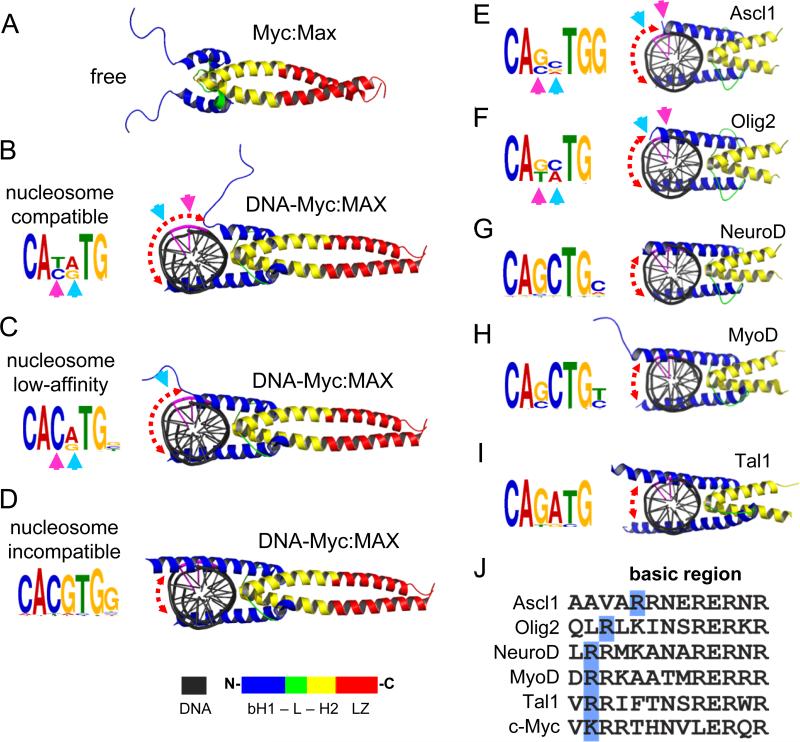
Pioneer transcription factors (TFs) access silent chromatin and initiate cell-fate changes, using diverse types of DNA binding domains (DBDs). FoxA, the paradigm pioneer TF, has a winged helix DBD that resembles linker histone and thereby binds its target sites on nucleosomes and in compacted chromatin. Herein, we compare the nucleosome and chromatin targeting activities of Oct4 (POU DBD), Sox2 (HMG box DBD), Klf4 (zinc finger DBD), and c-Myc (bHLH DBD), which together reprogram somatic cells to pluripotency. Purified Oct4, Sox2, and Klf4 proteins can bind nucleosomes in vitro, and in vivo they preferentially target silent sites enriched for nucleosomes. Pioneer activity relates simply to the ability of a given DBD to target partial motifs displayed on the nucleosome surface. Such partial motif recognition can occur by coordinate binding between factors. Our findings provide insight into how pioneer factors can target naive chromatin sites.


Figures

Figure 1
Figure 1. O, S, K, and M display differential affinity to nucleosomes in vitro
(A) Recombinant purified mammalian and bacterial O, S, K, M, and bacterial Max (X) proteins analyzed bySDS-PAGE and Coomassie staining. The respective OSKMX bands run at the expected sizes when compared to the sizes of protein standards. The OSKM DNA binding activity and specificity is shown in Figure S1A-C. (B) O, S, K, and M ChIP-seq profiles (blue, red, orange, and green, respectively) 48 hr post-induction, and MNase-seq profile (black) in fibroblasts across the LIN28B locus within the displayed genomic location. (C) DNase-I footprinting showing the protection of LIN28B-DNA before and after nucleosome reconstitution in vitro. Electropherograms of 5’-6FAM end-labeled LIN28B (top strand) oligonucleotides generated by digesting free DNA (blue) and nucleosomal DNA (red) with DNaseI. The amount of DNase-I used are indicated on top of each panel. Shaded boxes represent the DNase-I protected regions within LIN28B-nuc in the expected ~ 10 bp pattern. See Figure S1D for details about nucleosome reconstitution. (D) Representative EMSA showing the affinity of increasing amounts of recombinant O, S, K, and M proteins (bact. top panels and mamm. bottom panels) to Cy5-labelled LIN28B-DNA (left panels) and LIN28B-nucleosome (right panels). EMSA of O, S K, and M to DNA probes containing specific and non-specific targets are shown in Figure S1B and S1C.
Figure 2
Figure 2. The contribution of non-specific binding to nucleosome targeting in vitro
(A) Representative EMSA showing the affinity of recombinant O, S, K, M proteins (bact. top panels and mamm. bottom panels) to LIN28B-DNA (left panels) and LIN28B-nucleosome (right panels) in the presence of 40 fold molar excess of specific competitor ( “s” lanes) or non-specific competitor (“n” lanes) or absence of competitor (“-“ lanes). Competition assays showing the specificity of O, S, K, and M to their canonical DNA probes and to LIN28B DNA and nucleosome under lower titration of competitor is shown in Figure S2. (B) DNase-I footprinting showing the protection of LIN28B-DNA (left panels) and LIN28B-nuc (right panels) in the absence (blue lines) or presence (red lines) of O, S, K, and M. Electropherograms of 5’-6FAM end-labeled LIN28B (top strand) oligonucleotides generated by DNase-I digestion of DNA (0.006 U) and nucleosomal DNA (0.06 U). Dashed boxes and stars represent specific and non-specific sites protected by O, S, K, and M, respectively. (C) A cartoon representation of the 162 bp LIN28B DNA (left) and nucleosome (right) highlighting the binding sites of O, S, K, and M in vitro in blue, red, orange, and green, respectively, as measured by DNase-I footprining. The protected DNA sequences are indicated.
Figure 3
Figure 3. O, S, K, and M display a range of nucleosome targeting in vivo
(A) Read density heatmaps (in color scales) showing the intensity of O, S, K, and M ChIP-seq signal (blue) and MNase-seq (red) spanning ± 1 kb from the center of the O, S, K, and M peaks where each factor binds alone within 500 bp threshold. The analyzed sequences were organized in rank order, from high to low number ChIP-seq reads within the central 200 bp (double arrows). The number of targeted sites is indicated. (B) As in (A), but showing where the OS, OK, and OM factors peaks are within 100 bp or less apart from each other. The full possible OSKM combinations are shown in Figure S3. (C) The binding affinity of S, K, and M (1 nM) in the presence of Oct4 (0.3 nM) to LIN28B nucleosomal DNA (lanes; 4, 6, and 8, respectively) or absence of Oct4 (lanes; 3, 5, and 7). The binding of Oct4 on its own (lane 2) and free LIN28B nucleosomes (lane 1) are indicated. The histone content of the nucleosome bound complexes are shown in Figure S4.
Figure 4
Figure 4. O, S, and K recognize partial motifs on nucleosomes
(A-C) Same as in Figure 3A, but the sites were organizing in a descending rank order according to the MNase-seq tags within the central 200 bp. The nucleosome enriched sites were separated from the nucleosome depleted sites (dashed line) for each factor. (D-F) Logo representations of de novo motifs identified in the O, S, and K nucleosome-enriched targets (top) and nucleosome-depleted targets (bottom). The motifs were aligned to canonical motifs (middle). The number of targets analyzed and percentage of motif enrichments are indicated. (G-I) Cartoon representations of the 3-D structures of O (PDB-3L1P), S (PDB-1GT0), and K (PDBs-2WBS and 2WBU) DBDs in complexes with DNA containing canonical motifs. Side and top views are shown for O and K and dashed curved arrows are shown to represent the extent of exposed DNA surface (G and I). The 3-D structure of the less distorted DNA (top) and extensively distorted DNA (bottom) were superimposed on nucleosomal DNA (PDB-3LZ0, gray) to display the extent Sox2-nucleosome binding compatibility by measuring RMSD of the fit.
Figure 5
Figure 5. c-Myc recognition of degenerate E-box on nucleosome is assisted by binding with co-factors
(A-F) Same as shown in Figure 4A-F, but for c-Myc alone and OM targets. (C) The enrichment of an associated motif (HD) is measured within c-Myc alone targets containing or depleted from nucleosomes. The data indicate that c-Myc is driven to a degenerate E-box on nucleosomes, in part, by homeodomain factors **p<0.001.
Figure 6
Figure 6. The folding extent of bHLH basic helix-1 on DNA anti-correlates with targeting centrally-degenerate E-box motifs on nucleosomes
(A-D) The folding trajectory of basic helix-1 of c-Myc upon DNA-binding showing the possible conformations of c-Myc:Max heterodimers (B and C) that are compatible with nucleosome binding. See Figure S6A for c-Myc Morph. The initial DNA-free state (A) and the fully folded DNA-bound state (D), which is incompatible with nucleosome-binding, are indicated. The associated motifs for each c-Myc:Max conformation are shown in the left. See Figure S6B for Mitf structure in complexes with E-box with variable central nucleotides. (E-I) Cartoon representations of various bHLH reprogramming factors in complexes with DNA containing their canonical motifs (right). The de novo motifs identified for each factor from ChIP-seq data are indicated (left). The cyan and pink arrows represent the position of the exposed nucleotides within the central E-box motif not making base-contacts with the relative bHLH conformation. The central two nucleotides (CANNTG) are colored in purple in the DNA cartoon. The color scheme of the bHLH along with leucine zipper (LZ) is shown at the bottom. (J) Alignment of amino-acid sequences of the basic region of Ascl1, Olig2, NeuroD, MyoD, Tal1 and c-Myc. The last basic residue at the C-terminal end is highlighted in blue. See Figure S6D, E for MNase enrichment and motif analysis of Asl1.

Comment in

  • How to Be a Pioneer: A One-Sided View.
    Mancini EJ, West MJ. Mancini EJ, et al. Trends Biochem Sci. 2015 Oct;40(10):547-548. doi: 10.1016/j.tibs.2015.08.011. Epub 2015 Sep 8. Trends Biochem Sci. 2015. PMID: 26358228 No abstract available.

References

    1. Adams CC, Workman JL. Binding of disparate transcriptional activators to nucleosomal DNA is inherently cooperative. Mol. Cell. Biol. 1995;15:1405–1421. - PMC - PubMed
    1. Badis G, Berger MF, Philippakis AA, Talukder S, Gehrke AR, Jaeger SA, Chan ET, Metzler G, Vedenko A, Chen X, et al. Diversity and complexity in DNA recognition by transcription factors. Science. 2009;324:1720–1723. - PMC - PubMed
    1. Barozzi I, Simonatto M, Bonifacio S, Yang L, Rohs R, Ghisletti S, Natoli G. Coregulation of Transcription Factor Binding and Nucleosome Occupancy through DNA Features of Mammalian Enhancers. Mol. Cell. 2014;54:844–857. - PMC - PubMed
    1. Biggin MD. Animal transcription networks as highly connected, quantitative continua. Dev. Cell. 2011;21:611–626. - PubMed
    1. Budry L, Balsalobre A, Gauthier Y, Khetchoumian K, L'honoré A, Vallette S, Brue T, Figarella-Branger D, Meij B, Drouin J. The selector gene Pax7 dictates alternate pituitary cell fates through its pioneer action on chromatin remodeling. Genes Dev. 2012;26:2299–2310. - PMC - PubMed

Publication types

MeSH terms