. 2015 Apr 23;161(3):513-525.
doi: 10.1016/j.cell.2015.03.012. Epub 2015 Apr 16.

Single-molecule studies of origin licensing reveal mechanisms ensuring bidirectional helicase loading

Affiliations

Single-molecule studies of origin licensing reveal mechanisms ensuring bidirectional helicase loading

Simina Ticau et al. Cell. .

Abstract

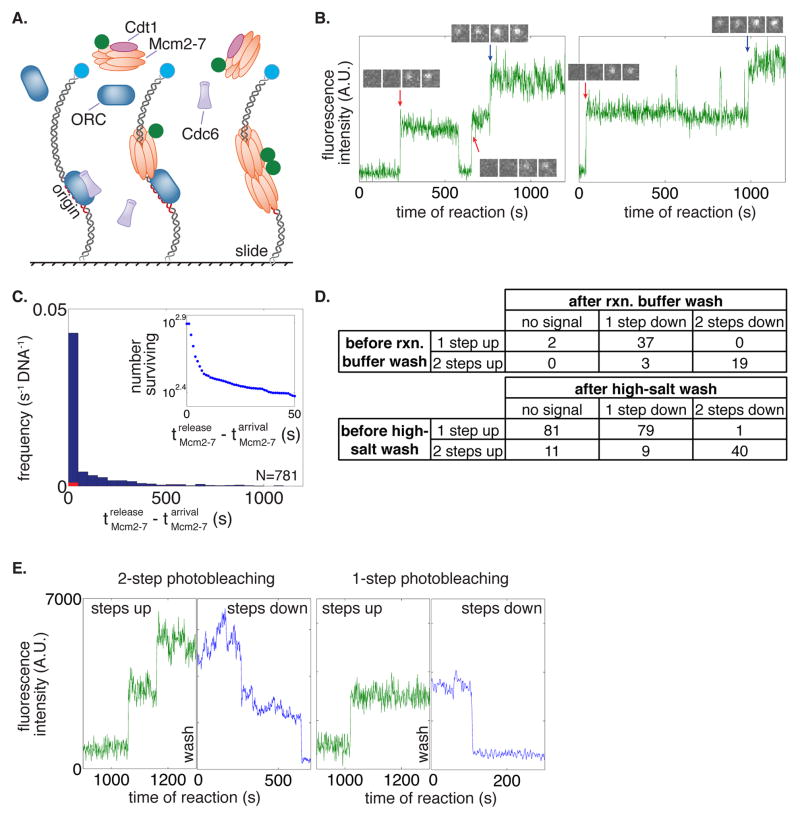
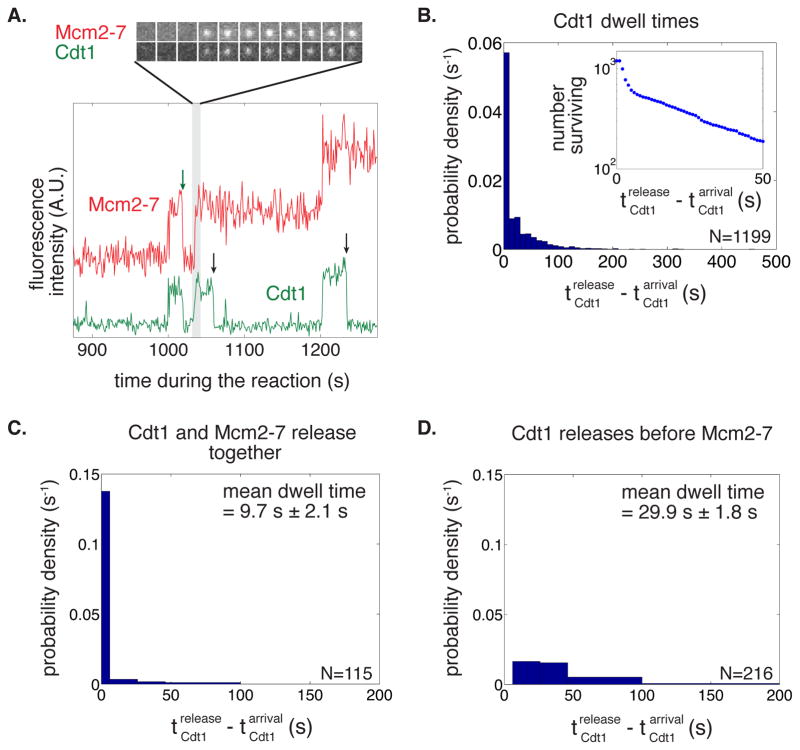
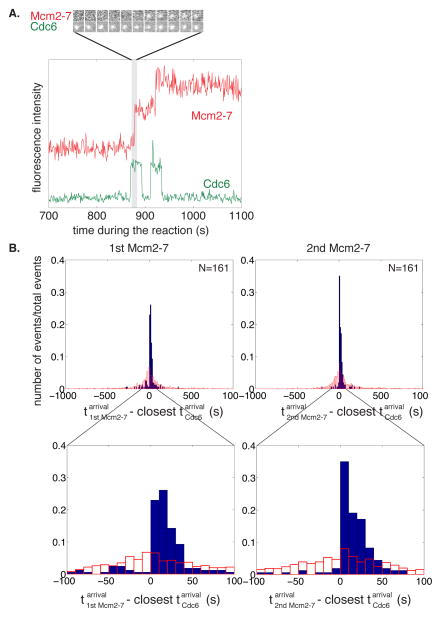
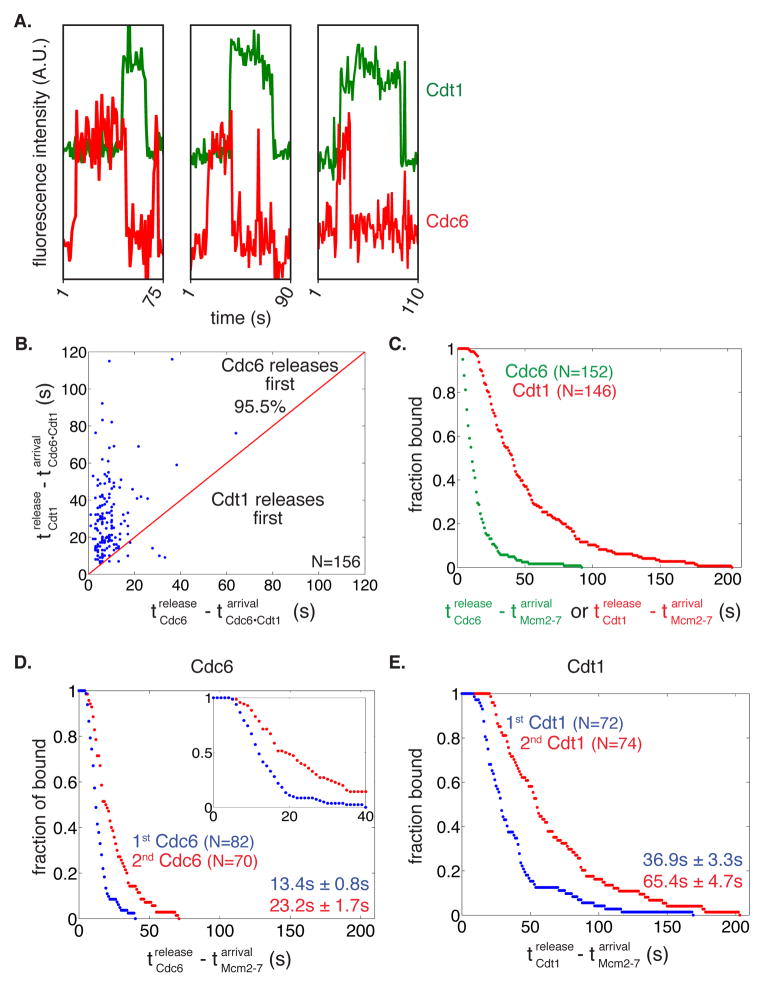
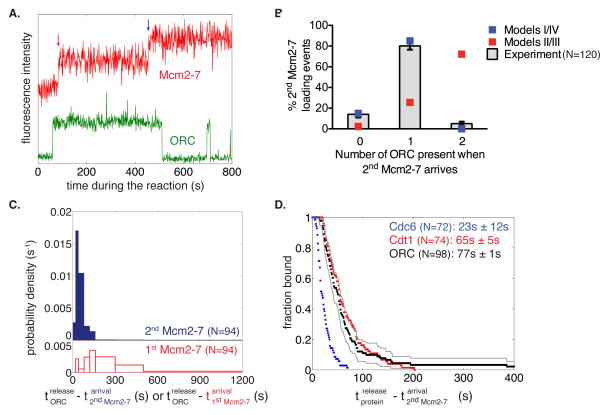
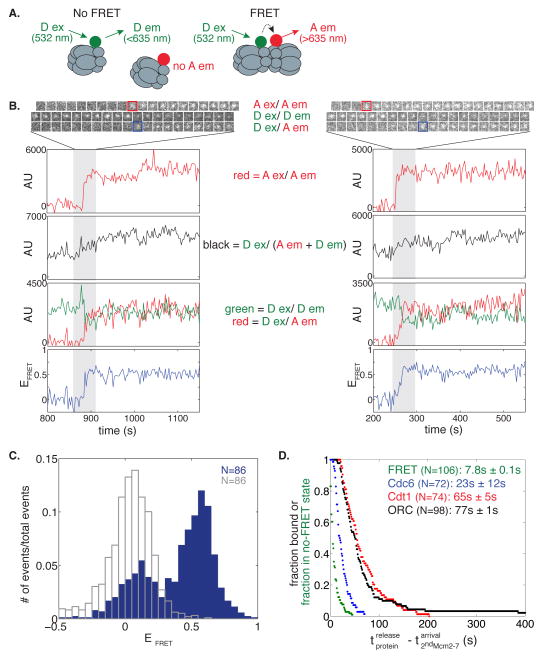
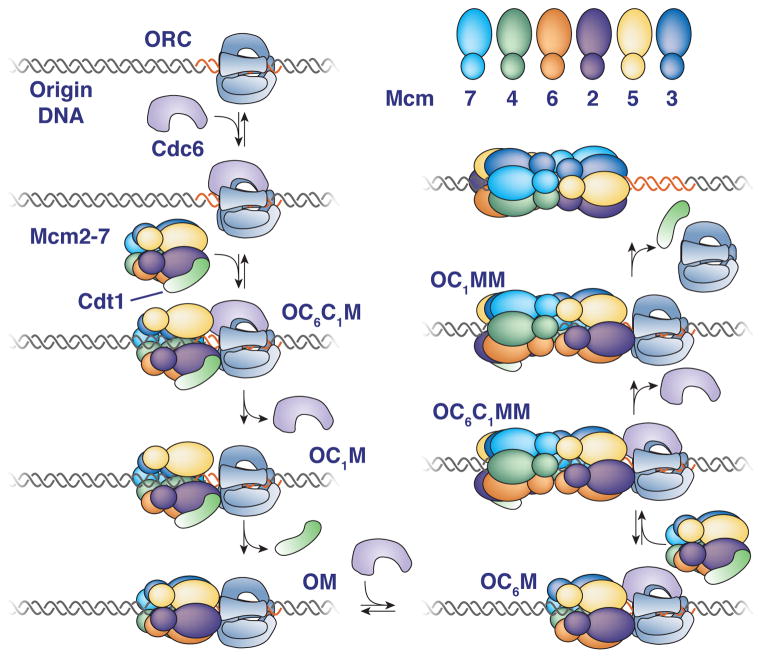
Loading of the ring-shaped Mcm2-7 replicative helicase around DNA licenses eukaryotic origins of replication. During loading, Cdc6, Cdt1, and the origin-recognition complex (ORC) assemble two heterohexameric Mcm2-7 complexes into a head-to-head double hexamer that facilitates bidirectional replication initiation. Using multi-wavelength single-molecule fluorescence to monitor the events of helicase loading, we demonstrate that double-hexamer formation is the result of sequential loading of individual Mcm2-7 complexes. Loading of each Mcm2-7 molecule involves the ordered association and dissociation of distinct Cdc6 and Cdt1 proteins. In contrast, one ORC molecule directs loading of both helicases in each double hexamer. Based on single-molecule FRET, arrival of the second Mcm2-7 results in rapid double-hexamer formation that anticipates Cdc6 and Cdt1 release, suggesting that Mcm-Mcm interactions recruit the second helicase. Our findings reveal the complex protein dynamics that coordinate helicase loading and indicate that distinct mechanisms load the oppositely oriented helicases that are central to bidirectional replication initiation.


Figures

Figure 1
Figure 1. Mcm2-7 hexamers associate with and are loaded on DNA in a one-at-a-time manner
(A) Schematic for the single-molecule helicase-loading assay. Alexa488-labeled (blue circle) 1.3kb origin-DNAs were coupled to microscope slides. Purified ORC, Cdc6, and Cdt1/Mcm2-7 (at least one fluorescently labeled, Mcm2-7 in this illustration) were incubated with slide-coupled DNA and colocalization of the fluorescently-labeled protein with the DNA was monitored. (B) Mcm2-7 complexes sequentially associate with origin DNA. Plots display the Mcm2-74SNAP549 fluorescence intensity recorded at two representative DNA molecules. Insets show fluorescence images (4 × 1 s) taken during the sequential association of first (red arrow) and second (blue arrow) Mcm2-7. (C) Mcm2-7 dwell times on DNA have a multiexponential distribution. Mcm2-7 dwell times were plotted as a histogram. Combined data from first and second Mcm2-7 associations are included; vertical axis represents the number of dwells of the specified duration per s per DNA molecule. Red bars are results from a separate experiment using mutant origin DNA. Inset shows the distribution of Mcm2-7 dwell times on DNA molecules as a semilogarithmic cumulative survival plot; only a portion of the entire plot is shown to emphasize that the distribution has at least two exponential components. (D) Mcm2-7 associates with DNA one at a time. The number of associations present at standard protein concentrations before a reaction-buffer (top) or high-salt-buffer (0.5 M NaCl; bottom) wash is compared to the number of fluorophores that are detected by photobleaching immediately after the wash. (E) Two representative traces before and after a high-salt wash and photobleaching. Reactions were washed twice with a high-salt buffer and imaged at higher laser power in the absence of an oxygen scavenging system until all fluorophores were photobleached. Traces of Mcm2-74SNAP549 associations during the reaction (green) are plotted adjacent to photobleaching steps after a high-salt wash (blue).
Figure 2
Figure 2. Distinct Cdt1 molecules load the first and the second Mcm2-7 hexamer
(A) Cdt1 molecules arrive with Mcm2-7 but release quickly after the complex arrives. A representative two-color recording of Mcm2-74SNAPJF646 and Cdt1SORT549 fluorescence at an origin-DNA location is shown. The baseline of the red plot (Mcm2-7) is shifted up relative to the green plot (Cdt1) throughout the manuscript when two-color recordings are displayed together. The sequence of single-frame images of the Cdt1- and Mcm2-7-fluorescent spots illustrates the concurrent arrival of Cdt1 and Mcm2-7. Cdt1 release occurs either with (green arrow) or without (black arrows) concurrent Mcm2-7 release. (B) Cdt1 dwell times on DNA have a multiexponential distribution. Cdt1 dwell times were plotted as a histogram. Inset shows semilogarithmic cumulative survival plot as in Fig. 1C. (C–D) There are two types of Cdt1 release events. (C) Histogram shows the duration of Cdt1 origin-DNA associations when Cdt1 releases with Mcm2-7. The mean dwell time ± standard error of the mean (s.e.m.) is reported. (D) Histogram shows the duration of Cdt1 origin-DNA associations when Cdt1 releases before Mcm2-7. The mean dwell time ± s.e.m. is reported.
Figure 3
Figure 3. Distinct Cdc6 molecules recruit and load the first and the second Mcm2-7 hexamer
(A) Distinct Cdc6 molecules anticipate each Mcm2-7 association. A representative fluorescence intensity record for Mcm2-74SNAPJF646 and Cdc6SORT549 at origin-DNA. Images of the Cdc6- and Mcm2-7-associated fluorescent spots show Cdc6 binds before the arrival of the first Mcm2-7 complex. (B) Cdc6 association anticipates binding of the first and second Mcm2-7. Full histogram (top) and expanded view (bottom) of Mcm2-7 arrival time minus the closest Cdc6 arrival time on the same DNA molecule (blue bars). Data is separated into Mcm2-7 complexes arriving at the DNA first (left) or second (right). In >85% of the observations the difference was greater than zero, indicating that Cdc6 arrived before Mcm2-7; in the remaining <15%, Mcm2-7 arrived before Cdc6 (likely due to an unlabeled Cdc6 molecule). Red bars show a control analysis in which each Mcm2-7 arrival time was paired with the closest Cdc6 arrival time on a different, randomly selected DNA molecule. The randomized control does not show the prominent peak at differences between 0 and +50 s indicating the sequential association of Cdc6 and Mcm2-7 was not coincidental.
Figure 4
Figure 4. Cdc6 release occurs before Cdt1 release
(A) Three representative fluorescence intensity records for Cdc6SORT649 and Cdt1SORT549 showing arrival and departure of Cdc6 before Cdt1. (B) Release of Cdc6 anticipates Cdt1 release in a majority of cases. Time of Cdt1 release (y-axis) is plotted against time of Cdc6 release (x-axis, both times are measured from start of simultaneous presence of Cdc6 and Cdt1). The red line represents where points would fall if Cdc6 and Cdt1 released simultaneously. The fraction of measurements in which Cdc6 is released before Cdt1 is reported. (C) Release of Cdc6 occurs before release of Cdt1 during double hexamer formation. Survival function for Cdc6SORT549 and Cdt1SORT549 dwell times after the first or second Mcm2-7 associates with origin DNA. The y-axis represents the fraction of Cdc6 or Cdt1 molecules that are still associated after the time represented on the x-axis. (D-E) Cdc6 and Cdt1 release events are slower for the second versus the first Mcm2-7 loading events. (D) The time of Cdc6 release after Mcm2-7 association is plotted for the first (blue) and second (red) Mcm2-7 association as a survival plot (the fraction of Cdc6 molecules that remain DNA-associated is plotted against time). Inset shows the first 40 s of the entire plot to emphasize the presence of a lag prior to DNA release. Numbers are mean release times ± s.e.m. for the first or second Mcm2-7-associated Cdc6 molecule. (E) Cdt1 release after the first (blue) and second Mcm2-7 association (red) as a survival plot as described for 4D.
Figure 5
Figure 5. A single ORC complex directs recruitment and loading of the first and second Mcm2-7 hexamer
(A) Representative fluorescence intensity record for ORC1SORT549 and Mcm2-74SNAPJF646 at an origin-DNA location. Association of first and second Mcm2-7 are marked with red and blue arrows, respectively. (B) A single ORC complex directs recruitment of two hexamers. The fraction (± s.e.) of DNA molecules observed to have zero, one or two ORC fluorophores bound when the second Mcm2-7 was recruited, is plotted (bars) together with the predicted number of associated fluorophores (red and blue squares) of different models (see Fig. S5A). (C) ORC is released rapidly after recruitment of the second Mcm2-7 hexamer. Histograms showing the time between the association of the second Mcm2-7 and ORC release (top), or association of the first Mcm2-7 and ORC release (bottom). (D) Release of Cdc6SORT549 (blue), Cdt1SORT549 (red), and ORC1SORT549 (black) after the association of the second Mcm2-74SNAPJF646 complex is plotted as a survival function. There are two ORC molecules that associate for >400s (1033.8s and 709.6s) that are not shown and disproportionately affect the mean dwell time. Grey lines represent a 95% confidence interval for the ORC dataset showing that there is no significant difference between Cdt1 and ORC release time distributions. Numbers in parentheses represent the mean release times ± s.e.m.
Figure 6
Figure 6. Double hexamer formation occurs quickly upon recruitment of the second Mcm2-7 hexamer
(A) When the two fluorophores (green circle = Dy549, red circle = Dy649) are not associated, excitation of the donor (D ex) will only yield emission from the donor (D em). However when the two fluorophores are in close proximity, we observe acceptor emission (A em) upon D ex, and a weaker D em signal. Wavelengths represent laser excitation and emissions that were monitored. (B) Representative fluorescence records for experiments using a mixture of Mcm2-77SORT549 and Mcm2-77SORT649 showing FRET upon arrival of the second Mcm2-7. Red squares highlight when Mcm2-77SORT649 associates with DNA (Mcm2-77SORT549 is already present), and blue squares highlight when FRET occurs. Images and records of fluorescence intensity for D ex/D em (Mcm2-77SORT549), A ex/A em (Mcm2-77SORT649), total emission (D ex / (D em + A em), and FRET (D ex/A em) are shown together with calculated EFRET. (C) Histogram of EFRET is plotted for times when a single Mcm2-77SORT549 and a single Mcm2-77SORT649 are present (blue bars) or when only Mcm2-77SORT549 is associated with the DNA (unfilled grey bars). The histogram displays the first ten consecutive EFRET measurements after arrival of the second Mcm2-7 for 86 DNA molecules (the same number of molecules and time points were used for the control). EFRET data below −0.5 was excluded from the plot (3/860 signal points and 17/860 control points). (D) Double-hexamer formation anticipates Cdc6, Cdt1 and ORC release. Survival after the association of the second Mcm2-7 complex of the no-FRET state (green) and of DNA-bound Cdc6SORT549 (blue), Cdt1SORT549 (red), and ORC1SORT549 (black). Mean times ± s.e.m. until FRET increase and ORC, Cdt1, Cdc6 release are reported for comparison.
Figure 7
Figure 7. Proposed model for helicase loading
Proteins present are indicated adjacent to each illustration (O=ORC, C6=Cdc6, C1=Cdt1, M=Mcm2-7). Reversible steps that are observed are indicated. See text for details.

Comment in

References

    1. Bochman ML, Schwacha A. The Mcm2-7 complex has in vitro helicase activity. Mol Cell. 2008;31:287–293. - PubMed
    1. Bowers JL, Randell JCW, Chen S, Bell SP. ATP hydrolysis by ORC catalyzes reiterative Mcm2-7 assembly at a defined origin of replication. Mol Cell. 2004;16:967–978. - PubMed
    1. Costa A, Ilves I, Tamberg N, Petojevic T, Nogales E, Botchan MR, Berger JM. The structural basis for MCM2-7 helicase activation by GINS and Cdc45. Nat Struct Mol Biol. 2011;18:471–477. - PMC - PubMed
    1. Costa A, Renault L, Swuec P, Petojevic T, Pesavento JJ, Ilves I, MacLellan-Gibson K, Fleck RA, Botchan MR, Berger JM. DNA binding polarity, dimerization, and ATPase ring remodeling in the CMG helicase of the eukaryotic replisome. eLife. 2014;3:e03273. - PMC - PubMed
    1. Coster G, Frigola J, Beuron F, Morris EP, Diffley JFX. Origin licensing requires ATP binding and hydrolysis by the MCM replicative helicase. Mol Cell. 2014;55:666–677. - PMC - PubMed

Publication types

MeSH terms

Substances