. 2015 Apr 23;161(3):486-500.
doi: 10.1016/j.cell.2015.03.005. Epub 2015 Apr 16.

Immunosurveillance of the liver by intravascular effector CD8(+) T cells

Affiliations

Immunosurveillance of the liver by intravascular effector CD8(+) T cells

Luca G Guidotti et al. Cell. .

Abstract

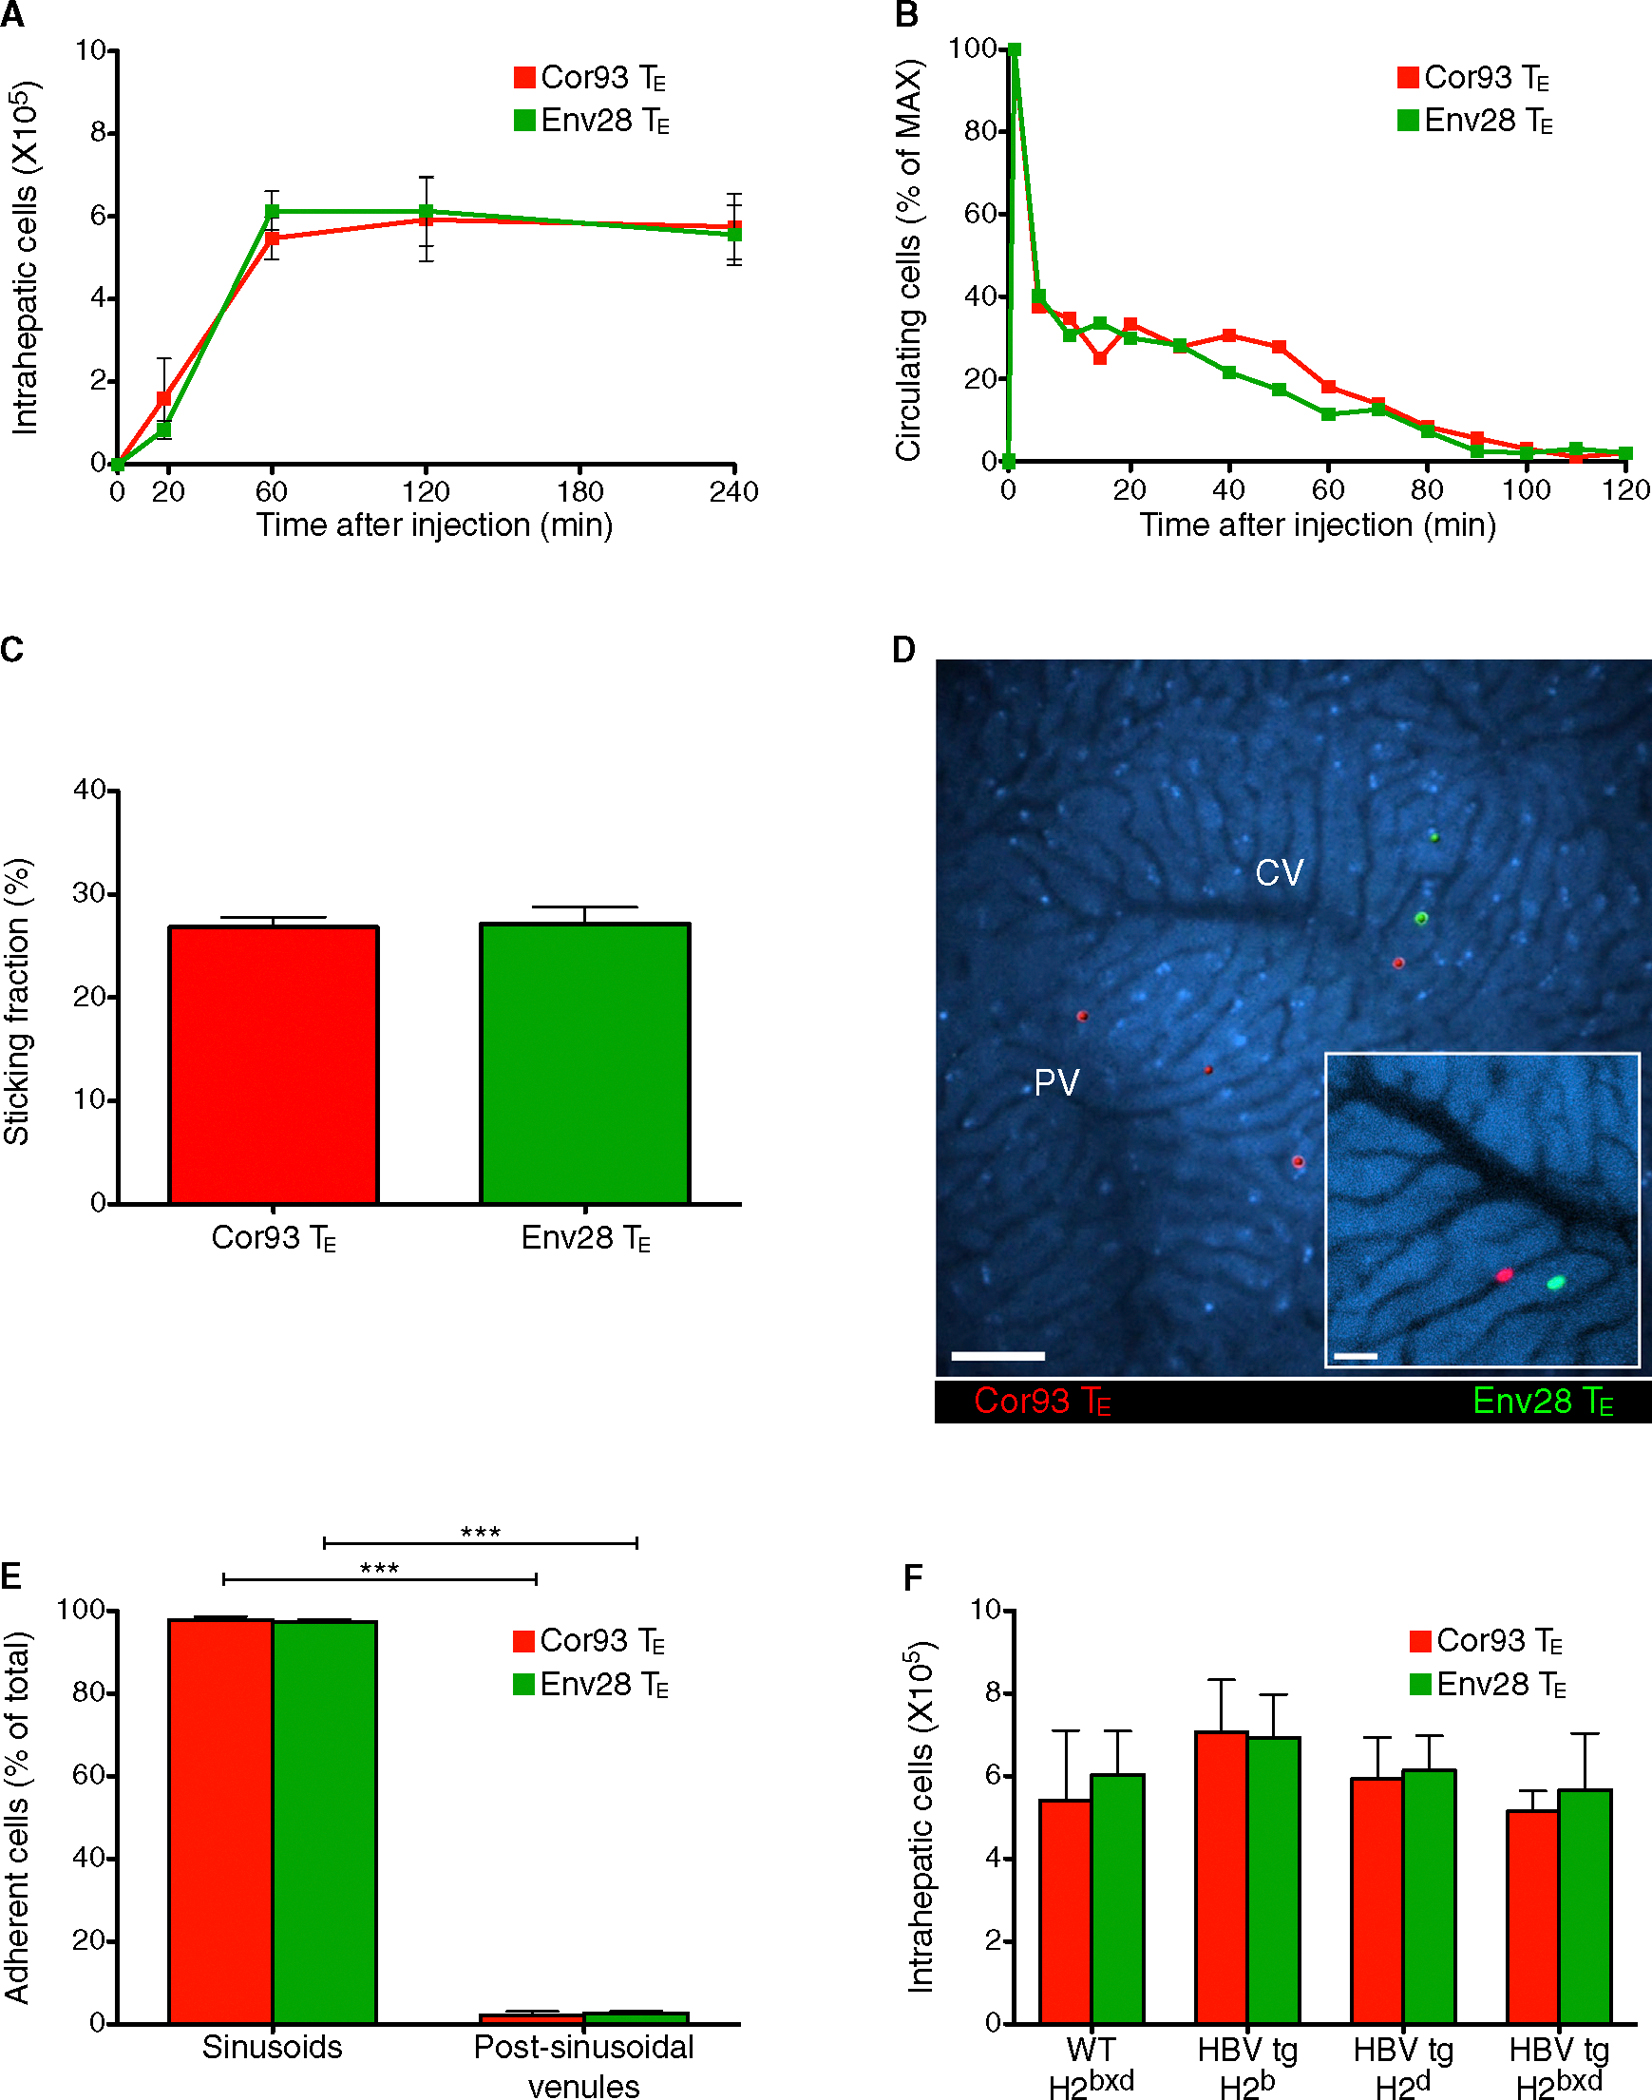
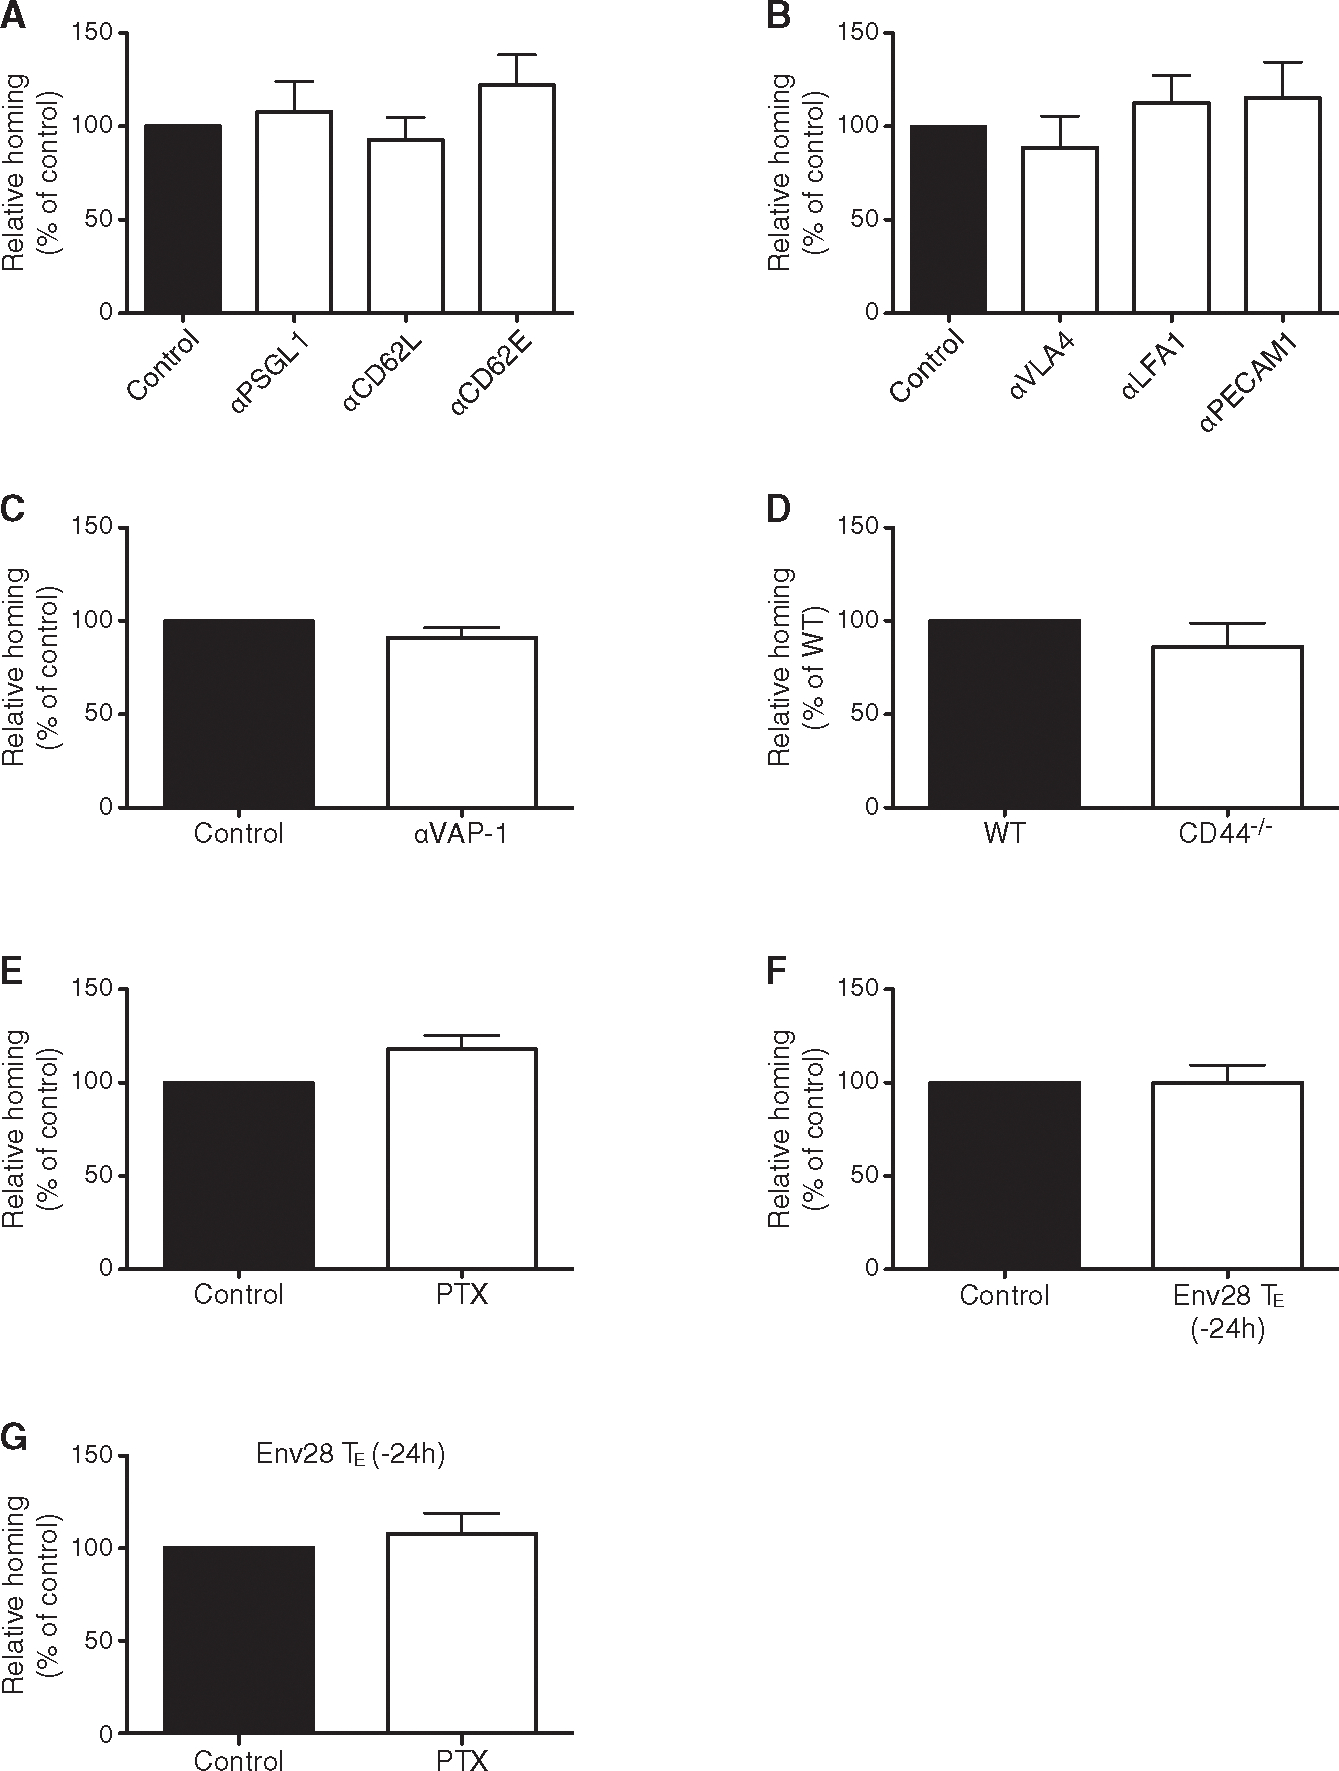
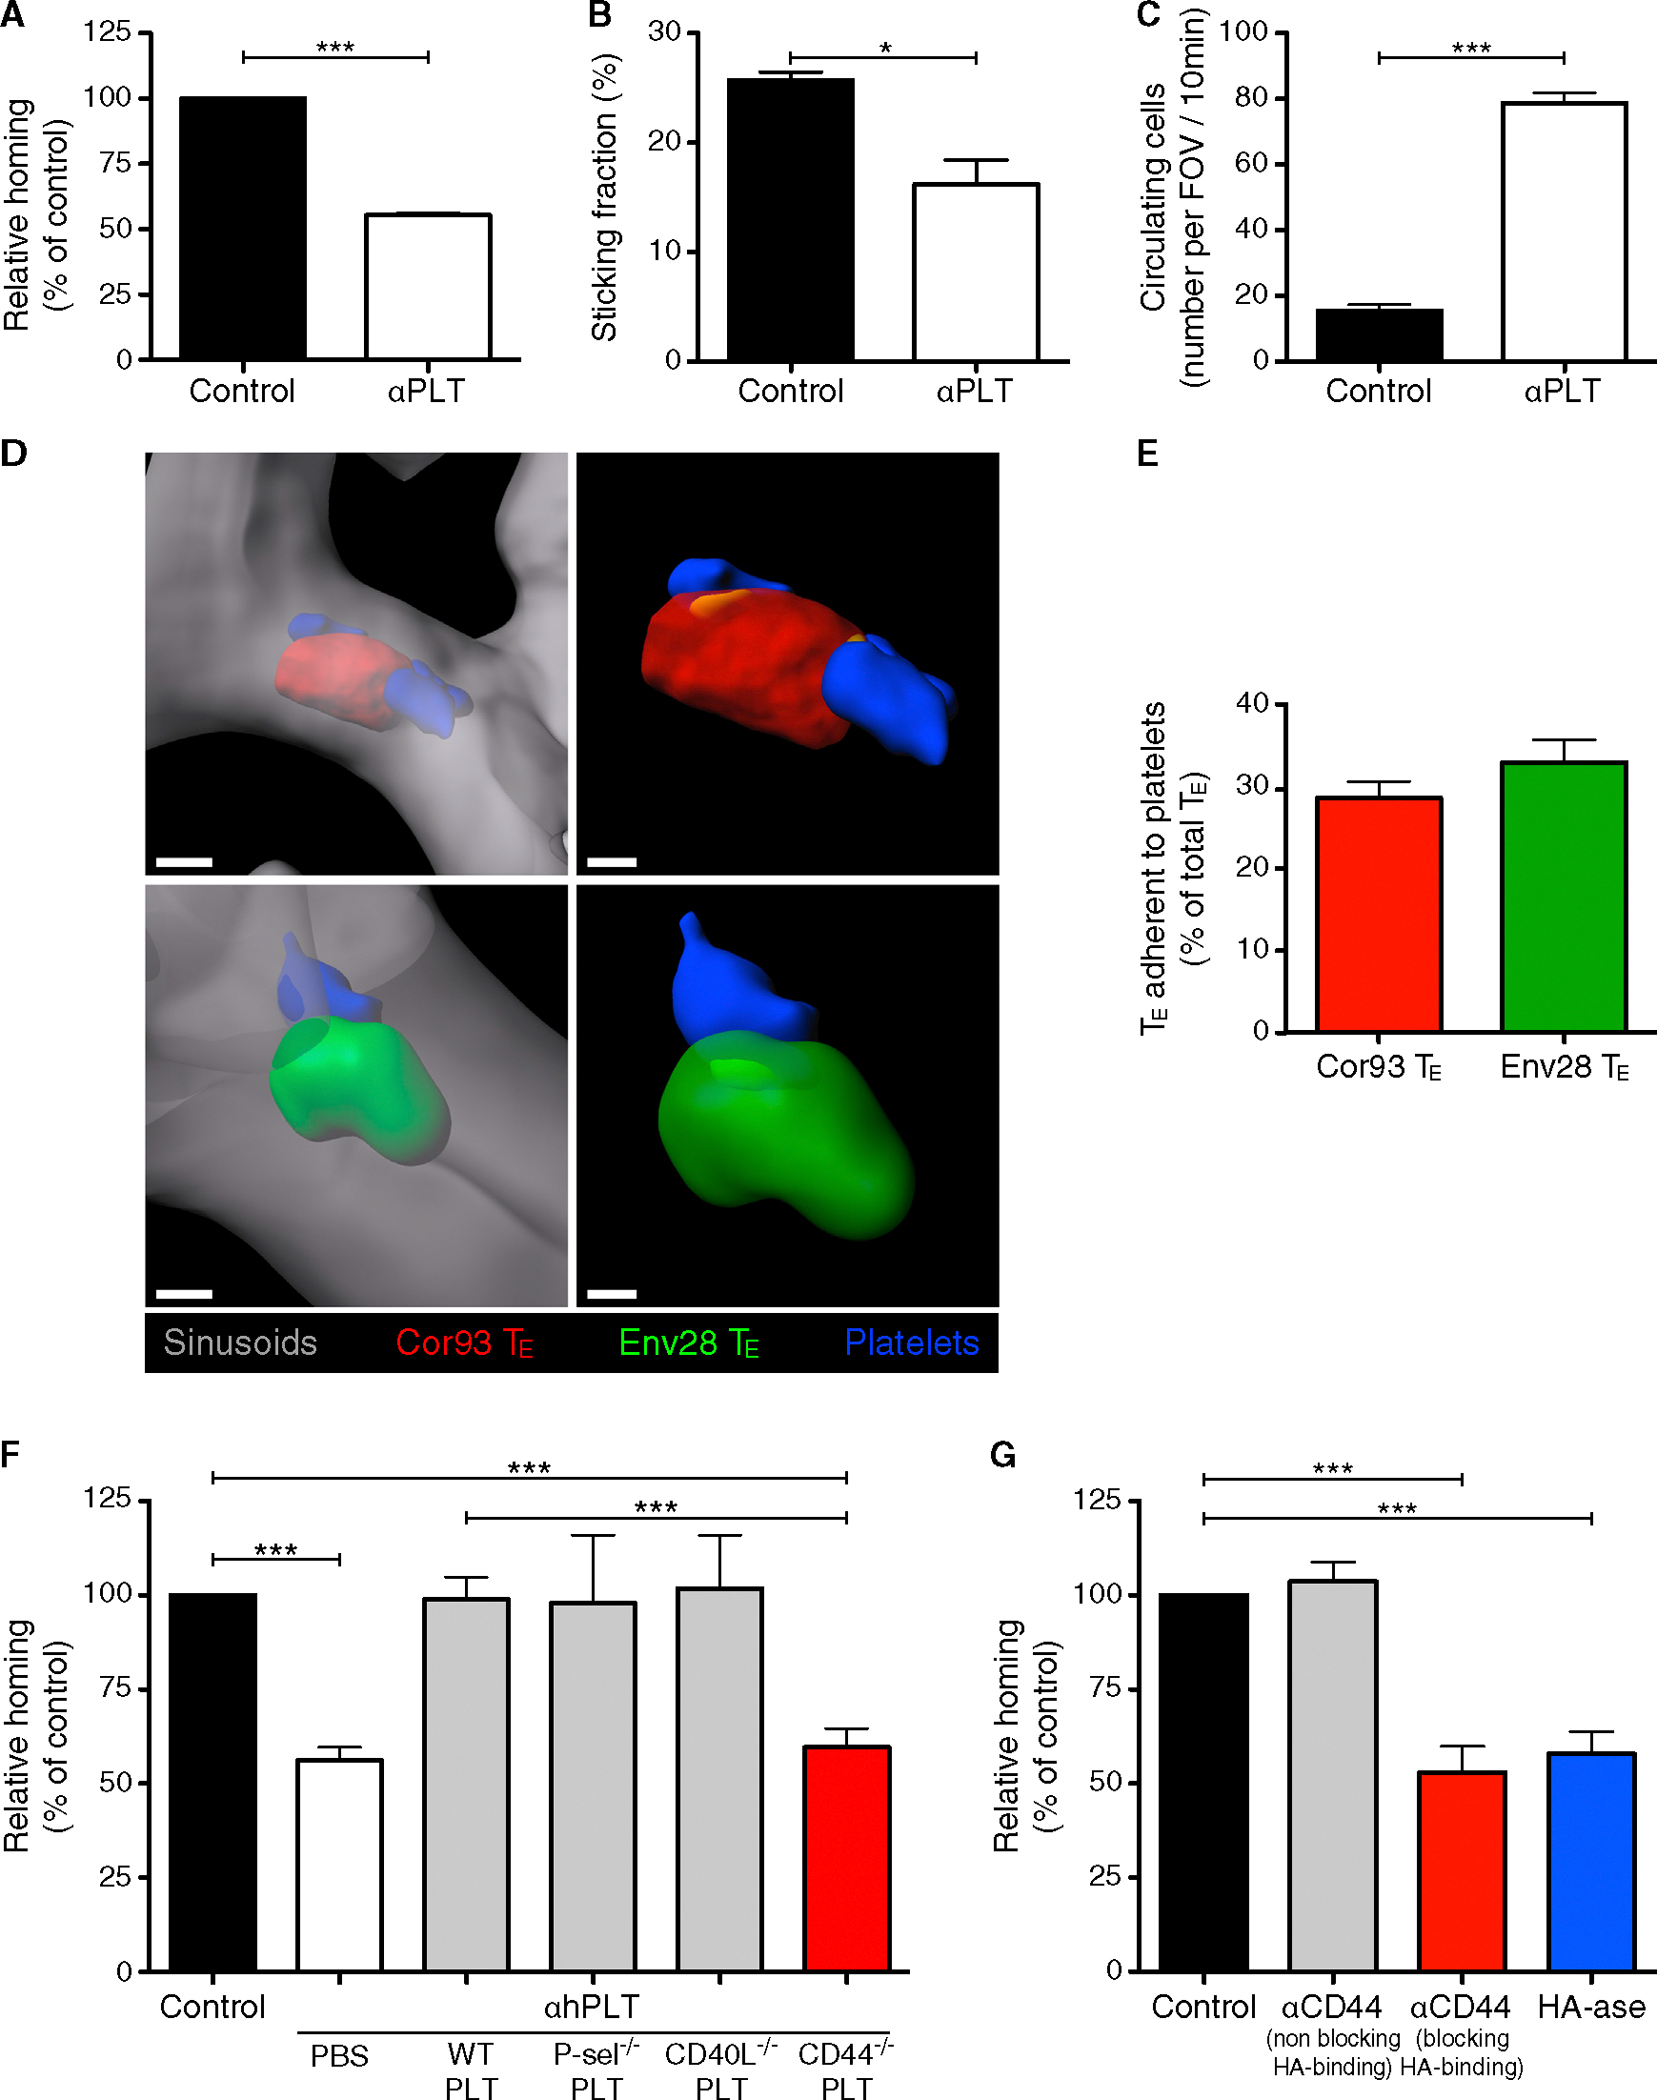
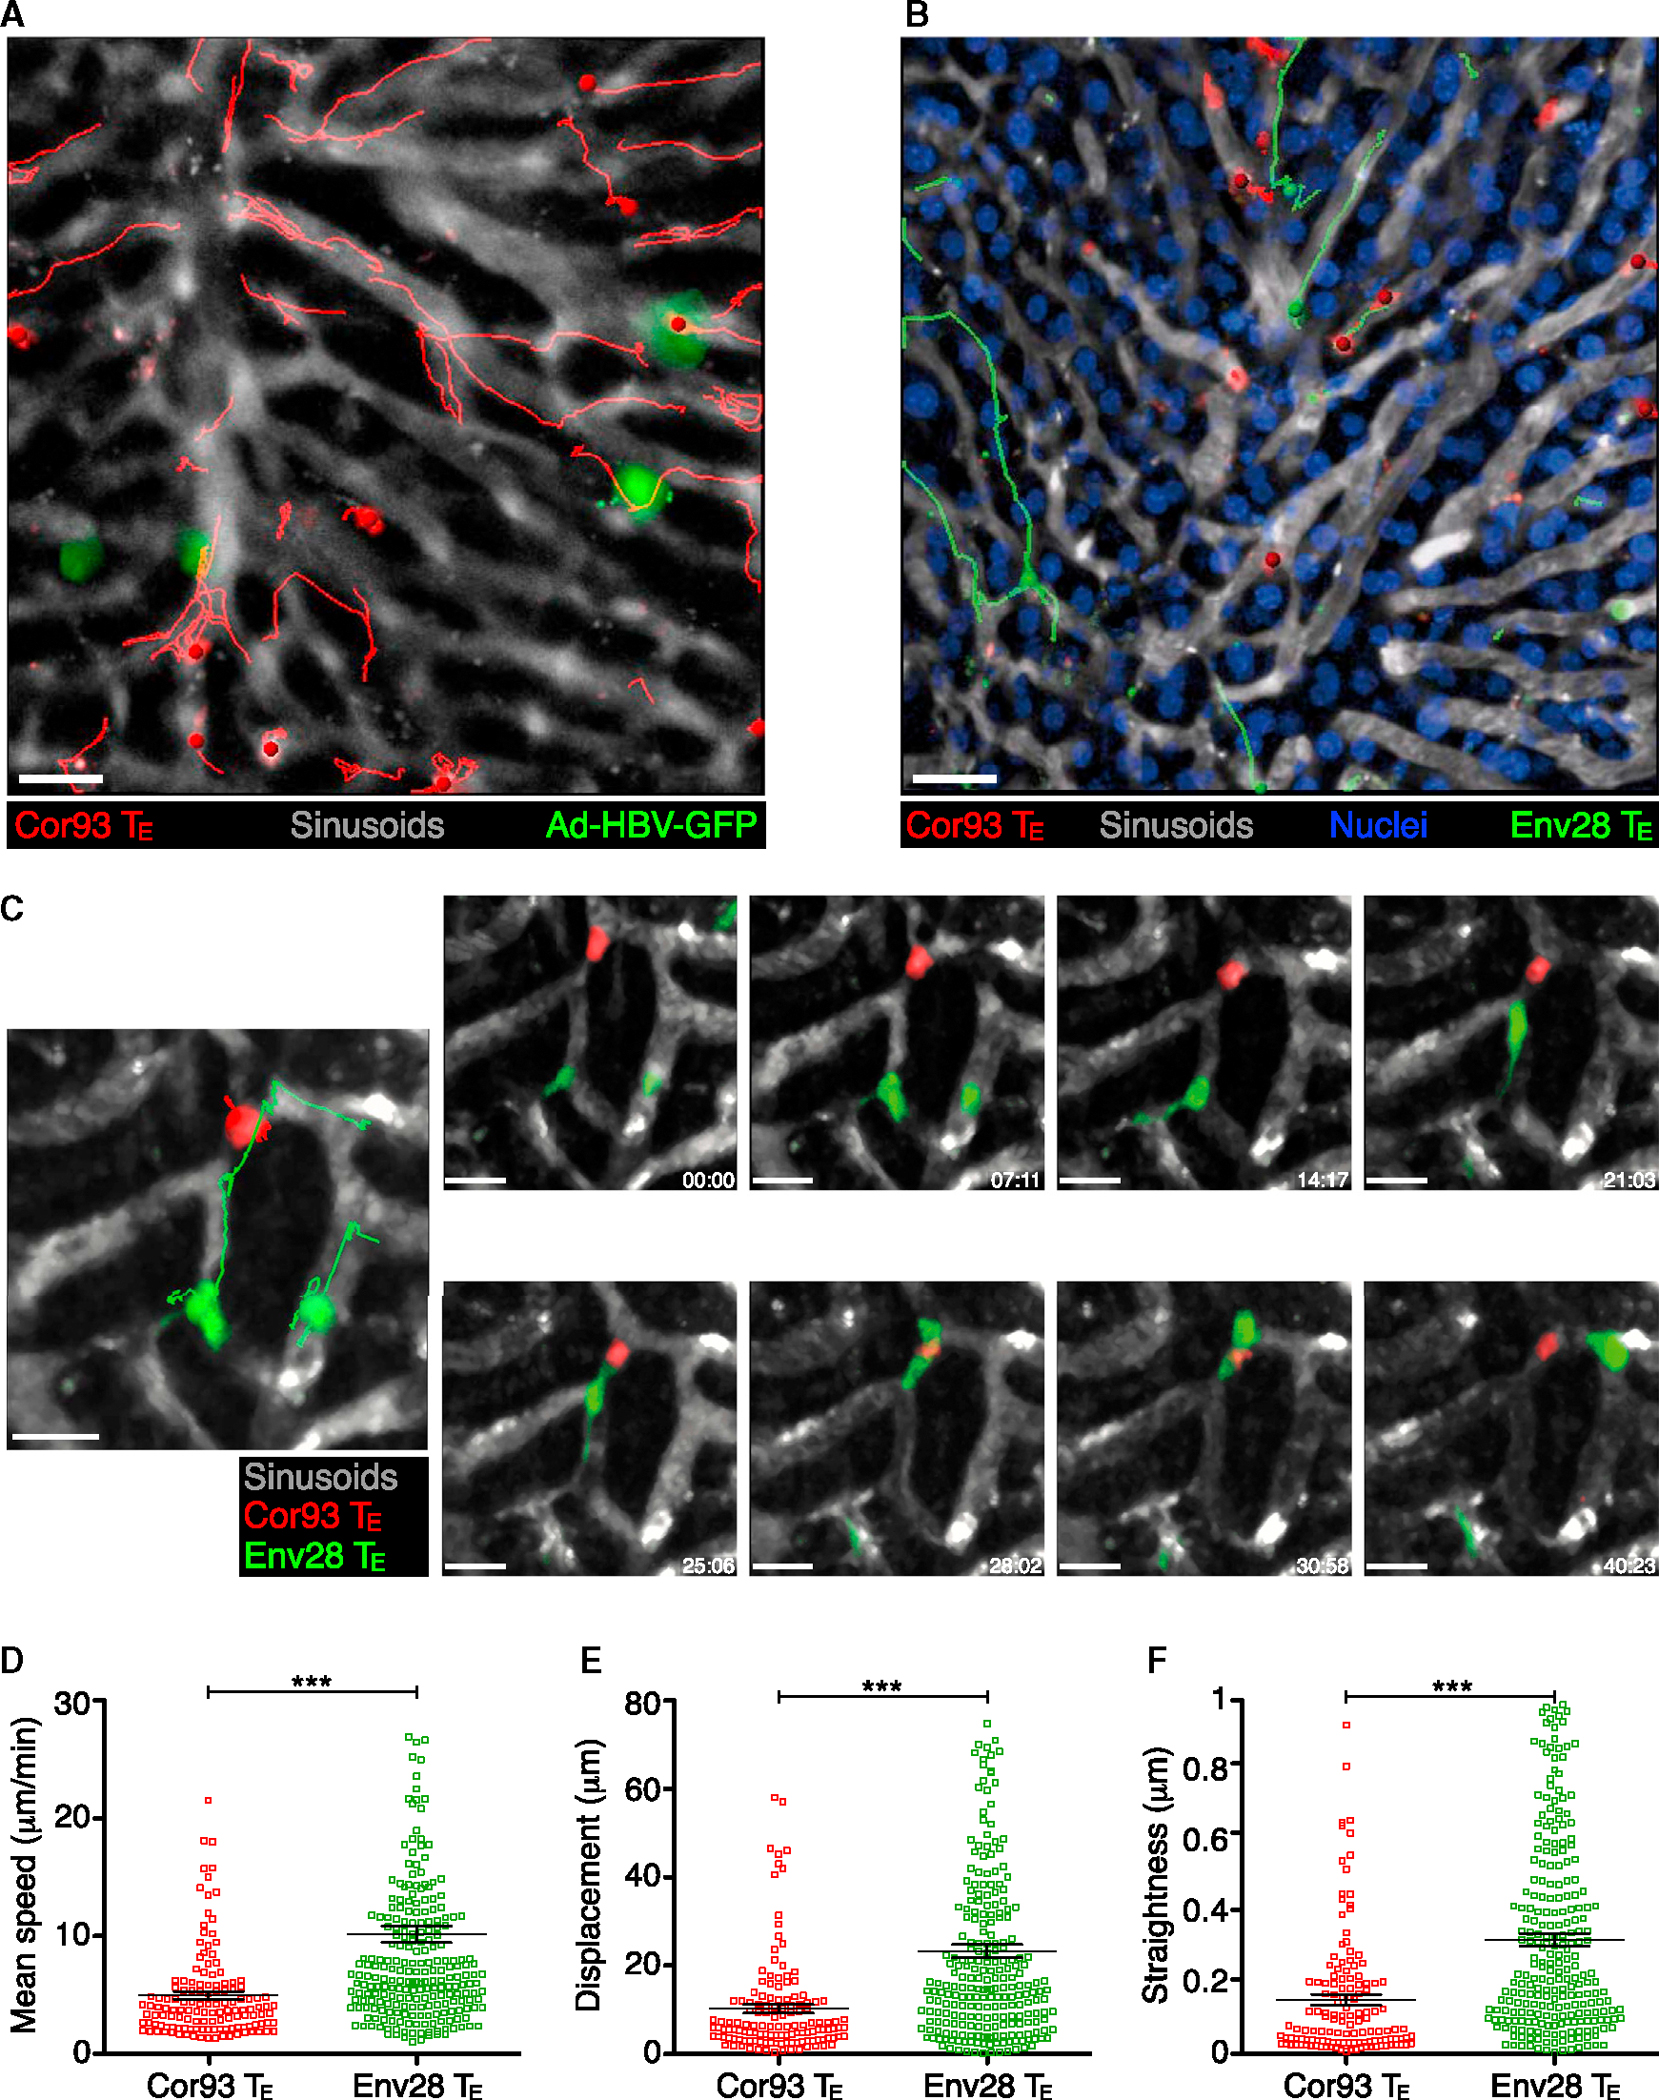
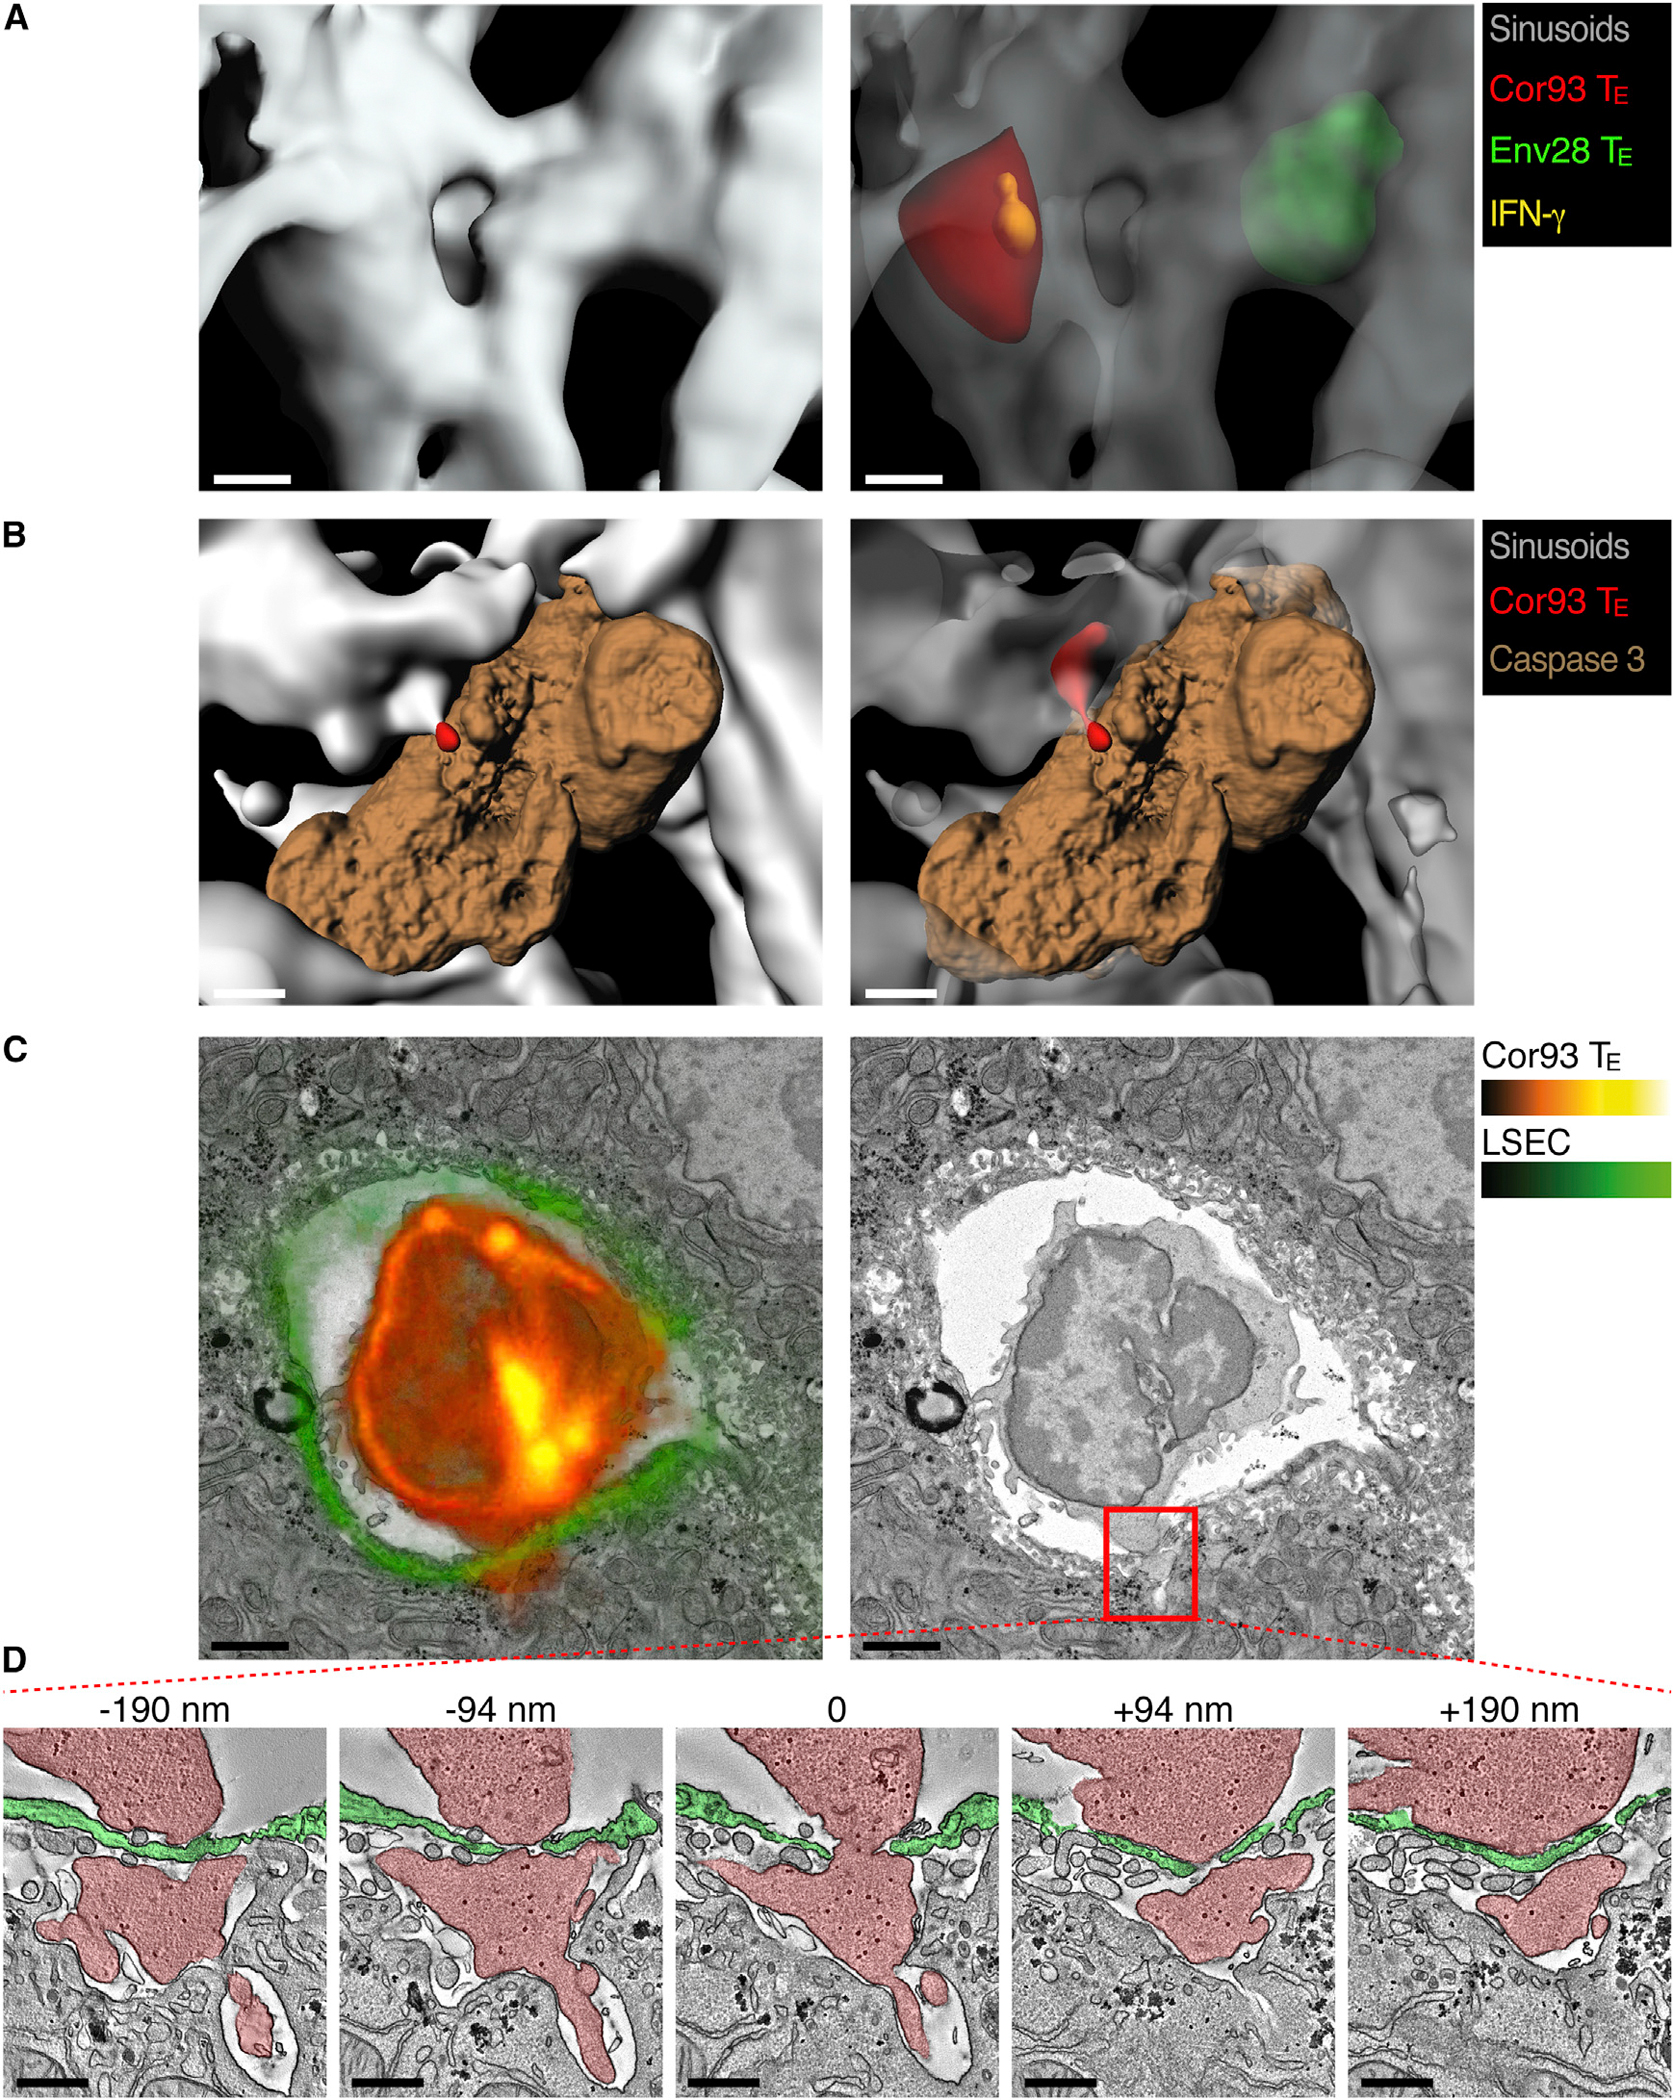
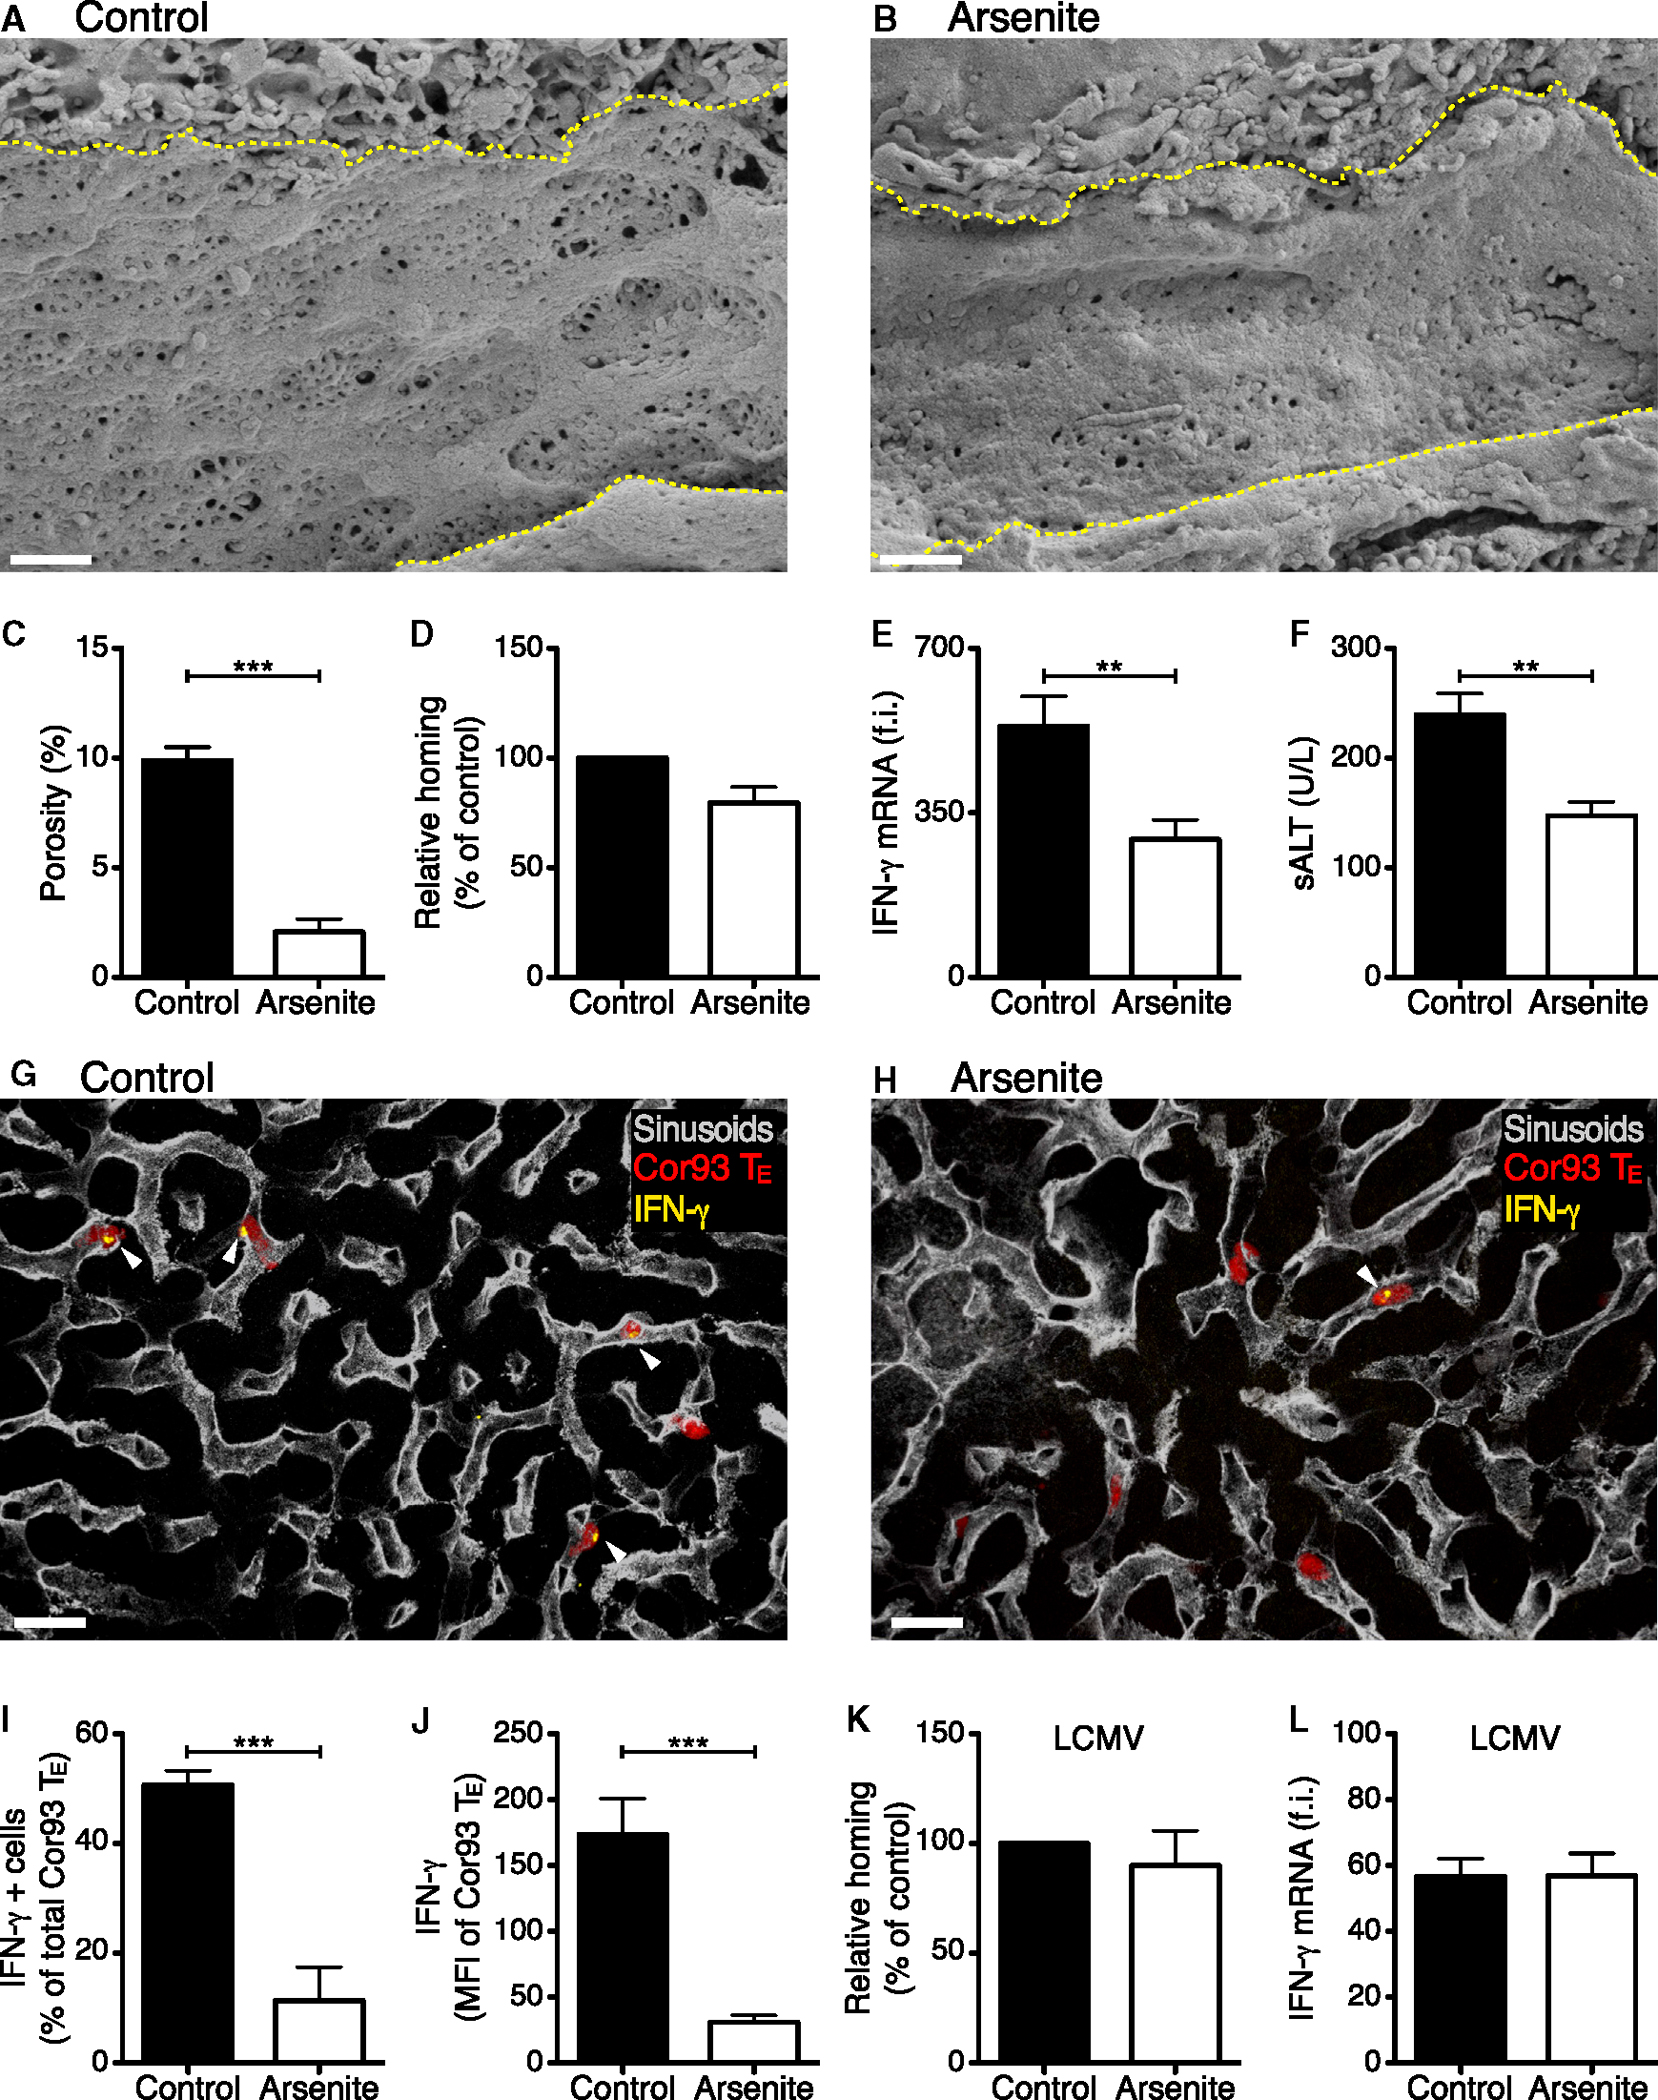
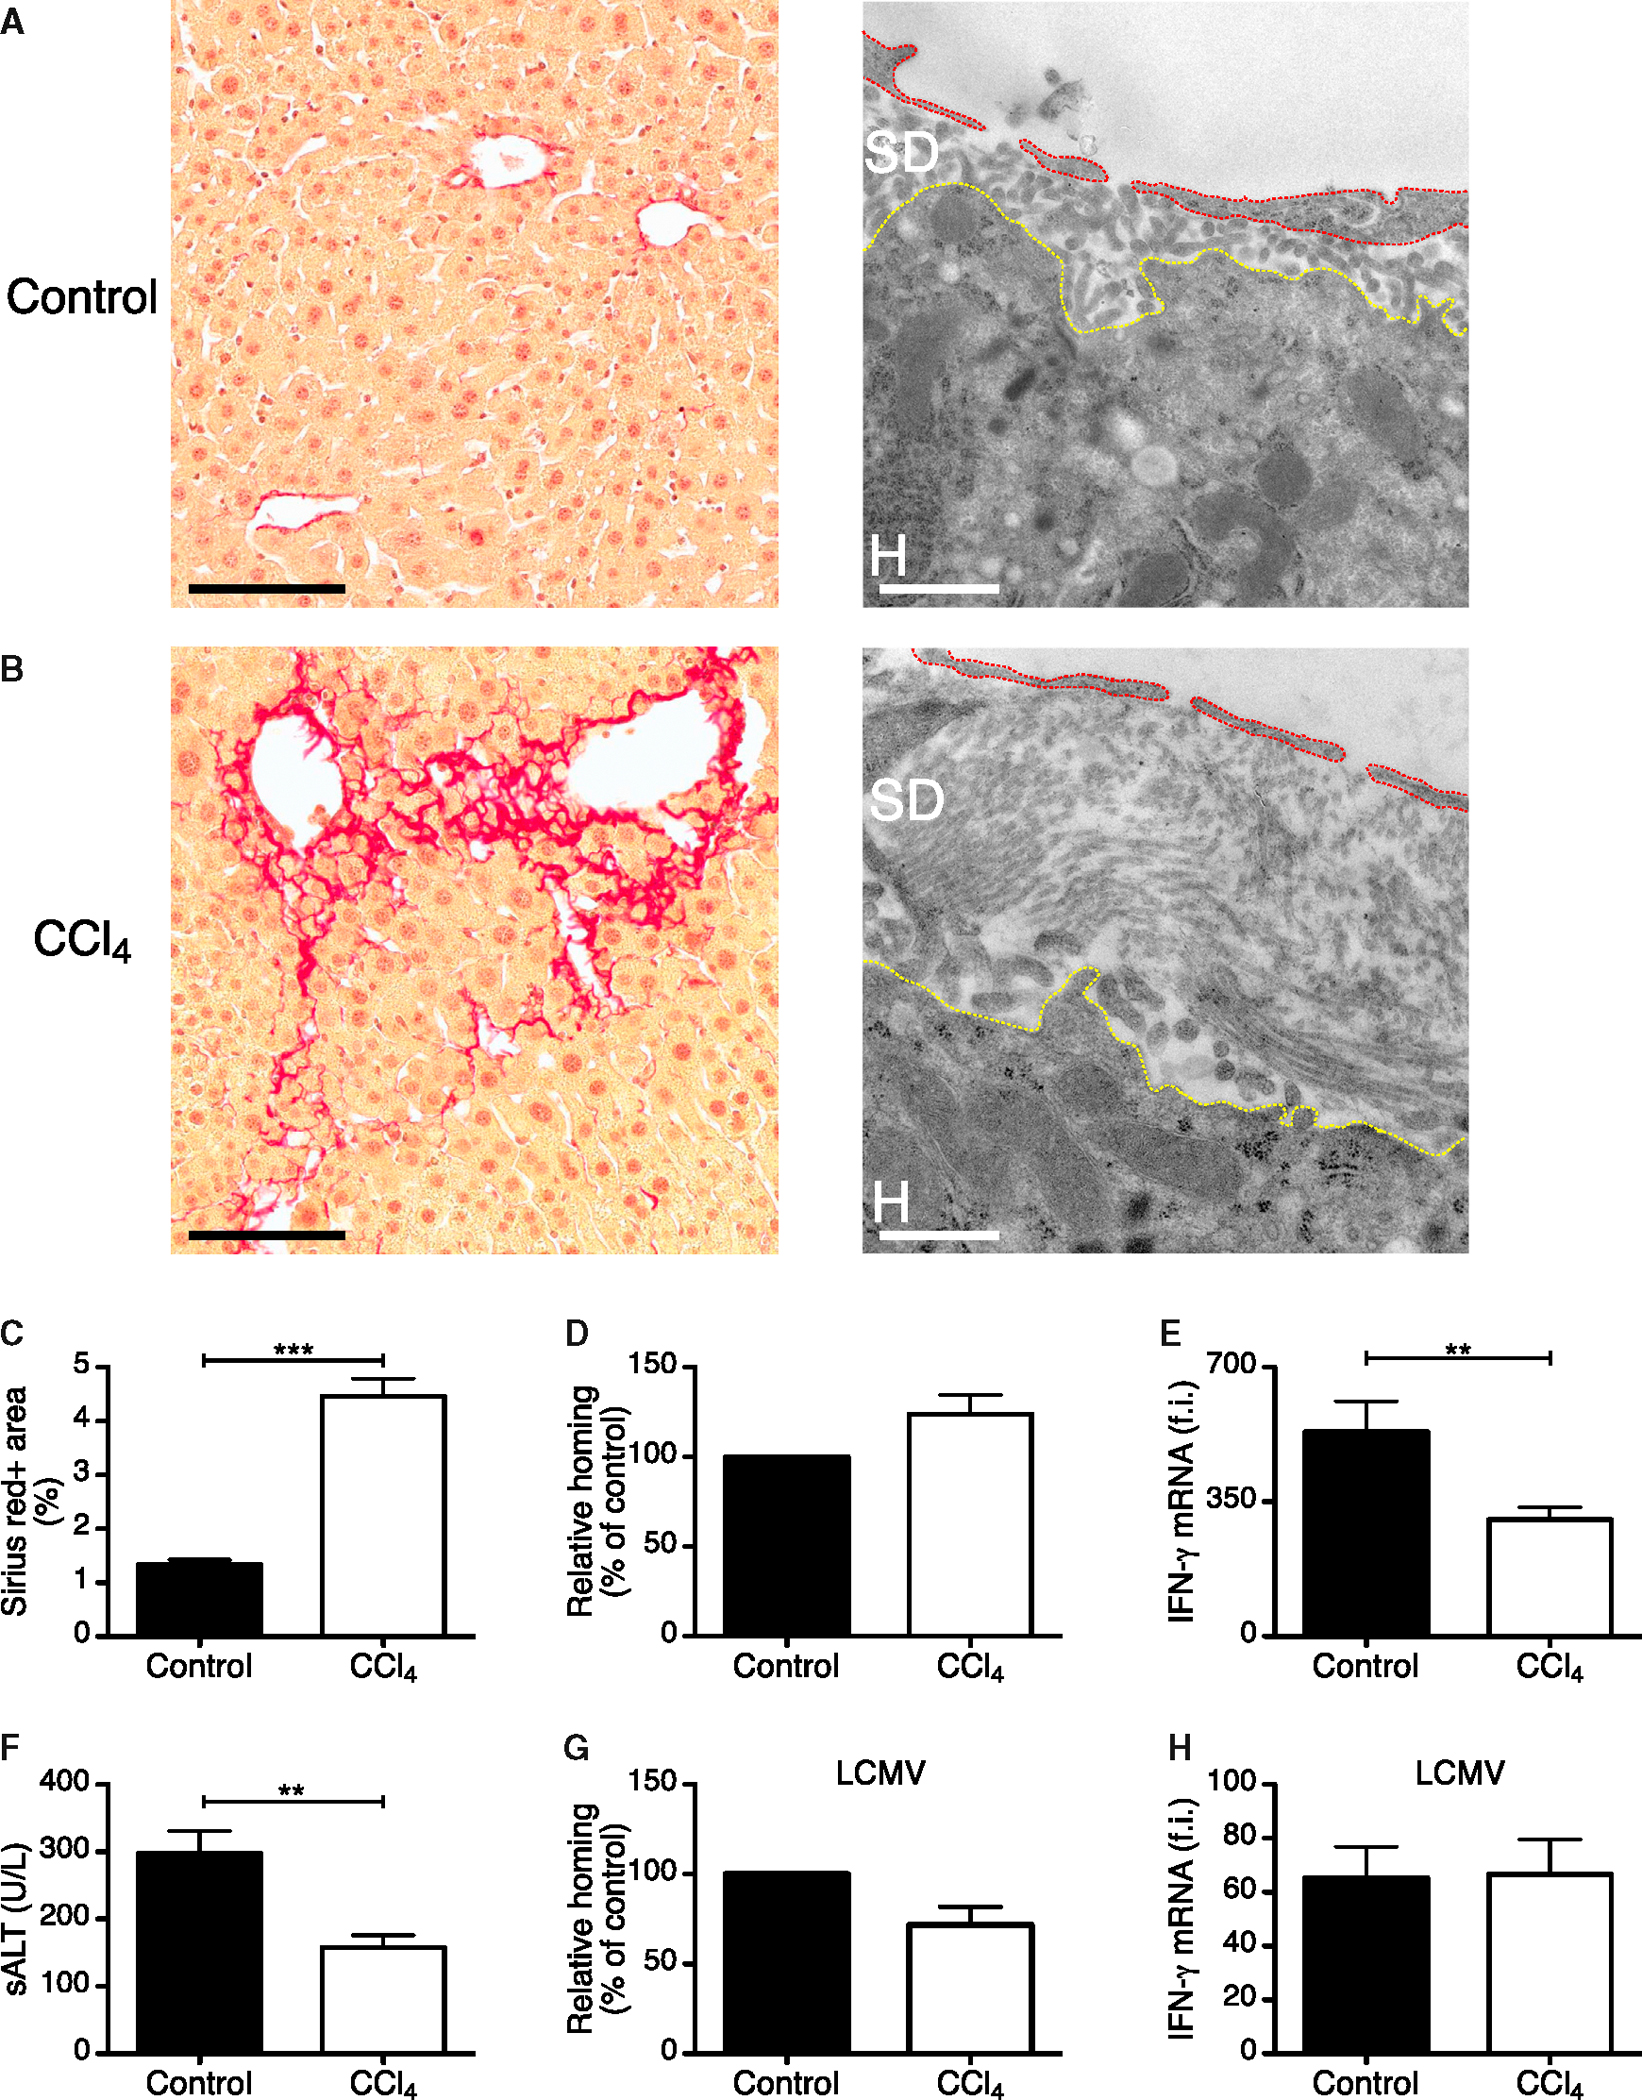
Effector CD8(+) T cells (CD8 TE) play a key role during hepatotropic viral infections. Here, we used advanced imaging in mouse models of hepatitis B virus (HBV) pathogenesis to understand the mechanisms whereby these cells home to the liver, recognize antigens, and deploy effector functions. We show that circulating CD8 TE arrest within liver sinusoids by docking onto platelets previously adhered to sinusoidal hyaluronan via CD44. After the initial arrest, CD8 TE actively crawl along liver sinusoids and probe sub-sinusoidal hepatocytes for the presence of antigens by extending cytoplasmic protrusions through endothelial fenestrae. Hepatocellular antigen recognition triggers effector functions in a diapedesis-independent manner and is inhibited by the processes of sinusoidal defenestration and capillarization that characterize liver fibrosis. These findings reveal the dynamic behavior whereby CD8 TE control hepatotropic pathogens and suggest how liver fibrosis might reduce CD8 TE immune surveillance toward infected or transformed hepatocytes.


Figures

Figure 1.
Figure 1.. CD8 TE Arrest within Liver Sinusoids Independently of Ag Recognition
Cor93 (107) CD8 TE (red) and Env28 (107) CD8 TE (green) were intravenously injected into HBV replication-competent transgenic mice (H2bxd) or into the indicated mouse strains. (A) Absolute number of hepatic Cor93 (red) and Env28 (green) CD8 TE recovered at the indicated time points after injection. n = 8; results are representative of three independent experiments. (B) Quantification of the number of circulating Cor93 (red) and Env28 (green) CD8 TE detected at the indicated time points within the field of a view (see Experimental Procedures). Results are representative of at least five experiments. (C) Quantification of the sticking fractions for Cor93 (red) and Env28 (green) CD8 TE. n = 5. (D) Representative images of Cor93 (red) and Env28 (green) CD8 TE within the liver vasculature. Images are representative of at least ten experiments. Scale bars represent 50 μm and 20 μm (inset). (E) Quantification of the localization (sinusoids versus post-sinusoidal venules) of adherent Cor93 (red) and Env28 (green) CD8 TE. Cells were defined as adherent when they arrested for >30 s. n = 5. (F) Absolute number of hepatic Cor93 (red) and Env28 (green) CD8 TE recovered 2 hr after injection from the livers of WT or HBV replication-competent transgenic mice (H2b, H2d or H2bxd). n = 8; results are representative of two independent experiments. Results are expressed as mean ± SEM. ***p < 0.001. See also Movie S1.
Figure 2.
Figure 2.. Adhesion Molecules that Govern Leukocyte Trafficking in Other Organs Are Not Required for CD8 TE Accumulation in the Liver
(A) Percentage of Cor93 CD8 TE that accumulated within the liver 2 hr upon transfer into HBV replication-competent transgenic mice (H2bxd) that were previously treated with anti-PSGL1, anti-CD62L or anti-CD62E Abs relative to control (control = 100%). n = 5; results are representative of two independent experiments. Similar results were obtained with Env28 CD8 TE (data not shown). (B) Percentage of Cor93 CD8 TE that accumulated within the liver 2 hr upon transfer into HBV replication-competent transgenic mice (H2bxd) that were previously treated with anti-VLA-4, anti-LFA-1 or anti-PECAM-1 Abs relative to control (control = 100%). n = 8; results are representative of two independent experiments. Similar results were obtained with Env28 CD8 TE (data not shown).(C) Percentage of Cor93 CD8 TE that accumulated WT CD44−/− within the liver 2 hr upon transfer into HBV replication-competent transgenic mice (H2bxd) that were previously treated with anti-VAP-1 Abs relative to control (control = 100%). n = 5; results are representative of two independent experiments. Similar results were obtained with Env28 CD8 TE (data not shown). (D) Percentage of CD44−/− Cor93 CD8 TE that accumulated within the liver 2 hr upon transfer into HBV replication-competent transgenic mice (H2bxd) relative to WT Cor93 CD8 TE (WT = 100%). n = 10; results are representative of two independent experiments. (E) Percentage of PTX-treated Cor93 CD8 TE that accumulated within the liver 2 hr upon transfer into HBV replication-competent transgenic mice (H2bxd) relative to control Cor93 CD8 TE (control = 100%). n = 5; results are representative of two independent experiments. Similar results were obtained with Env28 CD8 TE (data not shown). (F) Percentage of Cor93 CD8 TE that accumulated within the liver 2 hr upon transfer into HBV replication-competent transgenic mice (H2bxd) that were injected 24 hr earlier with 5 × 10⁶ Env28 CD8 TE relative to control (control = 100%). n = 5; results are representative of two independent experiments. (G) Percentage of PTX-treated Cor93 CD8 TE (relative to untreated Cor93 CD8 TE controls) that accumulated within the liver 2 hr upon transfer into HBV replication-competent transgenic mice (H2bxd) that were treated 24 hr earlier with Env28 CD8 TE. n = 5; results are representative of two independent experiments. Results are expressed as mean ± SEM. See also Figure S1.
Figure 3.
Figure 3.. Hepatic CD8 TE Accumulation Requires Platelets that Have Adhered to Sinusoidal Hyaluronan via CD44
(A) Percentage of Cor93 CD8 TE that accumulated within the liver 2 hr upon transfer into HBV replication-competent × mGP-Ibαnull;hGP-IbαTg mice that were previously depleted of platelets (aPLT) relative to control (control = 100%). n = 4; results are representative of three independent experiments. (B) Quantification of the sticking fraction for Cor93 CD8 TE injected into HBV replication-competent 3 mGP-Ibαnull;hGP-IbαTg mice that were platelet-depleted (aPLT) or left untreated (control). Results are representative of three experiments. (C) Quantification of the number of Cor93 CD8 TE that were still circulating 2 hr after transfer into HBV replication-competent × mGP-Ibαnull;hGP-IbαTg mice that were platelet-depleted (aPLT) or left untreated (control). Results are representative of three experiments. (D) Representative confocal micrographs of the liver of a HBV replication-competent × mGP-Ibαnull;hGP-IbαTg mouse (H2b) that was injected 2 hr earlier with Cor93 (red) and Env28 (green) CD8 TE. Platelets are shown in blue and sinusoids in gray. To allow visualization of intravascular event and to enhance image clarity, the transparency of the sinusoidal rendering was set to 45% (left panels) and the transparency of the cell rendering to 48% (right panels). Scale bars represent 3 μm (left panels) and 1.5 μm (right panels). (E) Percentage of Cor93 (red) and Env28 (green) CD8 TE that were adherent to endogenous platelets in the liver of a HBV replication-competent × mGP-Ibαnull;hGP-IbαTg mouse (H2b) that was injected 2 hr earlier with these cells. 300 of each cell type from 30 random 40× fields of view were analyzed. Results are representative of two independent experiments. (F) Percentage of Cor93 CD8 TE that accumulated within the liver 2 hr upon transfer into HBV replication-competent × mGP-Ibαnull;hGP-IbαTg mice that were previously depleted of platelets (aPLT) and then injected with PBS, WT platelets, P-selectin−/−platelets, CD40L−/−platelets, or CD44−/−platelets relative to control (control = 100%). n = 6; results are representative of three independent experiments. For the role of platelet-derived serotonin see Figure S2. (G) Percentage of Cor93 CD8 TE that accumulated within the liver 2 hr upon transfer into HBV replication-competent × mGP-Ibαnull;hGP-IbαTg mice that were previously injected with anti-CD44 Abs (clones KM81 or IM7 that either block or not the capacity of CD44 to bind to hyaluronan [HA], respectively) or hyaluronidase (HA-ase) relative to control (control = 100%). n = 7; results are representative of two independent experiments. Results are expressed as mean ± SEM. *p < 0.05, ***p < 0.001. Figure S2 and Movies S2 and S3.
Figure 4.
Figure 4.. CD8 TE Crawl along Liver Sinusoids until Hepatocellular Ags Are Recognized
(A) Intrasinusoidal crawling of CD8 TE, visualized by multiphoton IVM (still image from Movie S4) in the liver of a WT mouse that was injected with Ad-HBV-GFP 2 days prior to Cor93 CD8 TE transfer. The movie was recorded ~1 hr after Cor93 CD8 TE transfer. Red lines denote tracks of individual Cor93 CD8 TE. Sinusoids are in gray. Scale bar represents 50 μm. Similar results were obtained when Env28 CD8 TE were transferred into Ad-HBV-GFP-injected mice or when Cor93 or Env28 CD8 TE were transferred into WT mice previously injected with AAV-HBcAg-GFP or AAV-HBsAg-GFP, respectively (data not shown). (B) Intrasinusoidal crawling of CD8 TE, visualized by multiphoton IVM (still image from Movie S5) in the liver of a HBcAg transgenic mouse (H2b) that was injected with H2b-restricted Cor93 (red) and H2d-restricted Env28 (green) CD8 TE. Red and green lines denote tracks of individual Cor93 and Env28 CD8 TE, respectively. Sinusoids are in gray and hepatocellular nuclei are in blue. Scale bar represents 50 μm. (C) Still image (large left panel) and time lapse recording (small right panels) in the liver of a HBcAg transgenic mouse (H2b) that was injected with Cor93 (red) and Env28 (green) CD8 TE. Red and green lines denote tracks of individual Cor93 and Env28 CD8 TE, respectively. Sinusoids are in gray. Elapsed time in minutes:seconds. Scale bar represents 15 μm (left) and 10 μm (right). (D–F) Mean speed (D), displacement (E), and straightness (F) (see Experimental Procedures) of individual Cor93 (red) and Env28 (green) CD8 TE in the liver of a HBcAg transgenic mouse (H2b). Data are representative of two independent experiments. Results are expressed as mean ± SEM. ***p < 0.001. Figures S3 and S4 and Movies S4 and S5.
Figure 5.
Figure 5.. CD8 TE Recognize Hepatocellular Ags and Perform Effector Functions in a Diapedesis-Independent Manner
(A) Representative confocal micrographs of the liver of a HBV replication-competent transgenic mouse (H2b) that was injected 2 hr earlier with Cor93 (red) and Env28 (green) CD8 TE. Sinusoids are shown in gray and IFN-γ in yellow. To allow visualization of intravascular events and to enhance image clarity, the transparency of the sinusoidal rendering in the right panel was set to 70% and that of T cells to 60%. Scale bars represent 4 μm. See also Movie S6 and Figure S5. Similar results were obtained in similarly treated HBcAg transgenic mice (data not shown). (B) Representative confocal micrographs of the liver of a HBV replication-competent transgenic mouse (H2b) that was injected 2 hr earlier with Cor93 CD8 TE (red). Sinusoids are shown in gray and caspase 3 in brown. To allow visualization of intravascular events and to enhance image clarity, the transparency of the sinusoidal rendering in the right panel was set to 50%. Scale bars represent 5 μm. See also Movie S6 and Figure S6. Similar results were obtained in similarly treated HBcAg transgenic mice (data not shown). (C) Correlative confocal and transmission electron microscopy of the liver of an HBcAg transgenic mouse whose LSEC express membrane-targeted tdTomato (see Experimental Procedures) that was injected 30 min earlier with Cor93 CD8 TE. Left: overlay of the Cor93 CD8 TE and LSEC fluorescence (red and green, respectively) with the electron micrograph of the same section. Right: electron micrograph alone. Scale bars represent 2 μm. (D) Transmission electron tomograms of five selected serial slices from the area delineated by the red inset in (C). The numbers indicate the z-distance from the middle section. Cor93 CD8 TE and LSEC are indicated by the red and green overlay, respectively. Scale bars represent 500 nm. See Movie S7 for the complete tomographic reconstruction of 289 sections with a 1.95 nm z-step. See also Figures S5, S6, and S7 and Movies S6 and S7.
Figure 6.
Figure 6.. Reducing Sinusoidal Porosity Limits Hepatocellular Ag Recognition by CD8 TE
(A and B) Representative scanning electron micrographs from liver sections of control (A) or arsenite-treated (B) HBV replication-competent transgenic mice (H2bxd) mice. Yellow dotted lines denote sinusoidal edges. Scale bars represent 1 μm. (C) Porosity (the percentage of liver endothelial surface area occupied by fenestrae) was measured in control and arsenite-treated mice. n = 3; results are representative of two independent experiments. (D) Percentage of Cor93 CD8 TE that accumulated within the liver 2 hr upon transfer into HBV replication-competent transgenic mice (H2bxd) that were previously treated with arsenite relative to control (control = 100%). n = 20; results are representative of two independent experiments. Similar results were obtained with Env28 CD8 TE (data not shown). (E) Total hepatic RNA from the same mice described in (D) was analyzed for the expression of IFN-γ by qPCR. Results are expressed as fold induction (f.i.) over HBV replication-competent transgenic mice injected with PBS, after normalization to the housekeeping gene GAPDH. (F) ALT activity measured in the serum of the same mice described in (D). (G and H) Representative confocal micrographs from the same mice described in (D). Cor93 CD8 TE are shown in red, sinusoids in gray and IFN-γ in yellow. Arrowheads denote IFN-γ+ cells. Scale bars represent 20 μm. (I) The percentage of Cor93 CD8 TE that stained positive for IFN-γ was quantified in liver sections from the same mice described in (D). n = 90. (J) IFN-γ mean fluorescence intensity (MFI) of Cor93 CD8 TE was quantified in liver sections from the same mice described in (D). n = 90. (K) Percentage of GP33 CD8 TE that accumulated within the liver 2 hr upon transfer into LCMV-infected mice that were previously treated with arsenite, relative to control (control = 100%). n = 5; results are representative of two independent experiments. (L) Total hepatic RNA from the same mice described in (K) was analyzed for the expression of IFN-γ by qPCR. Results are expressed as fold induction (f.i.) over LCMV-infected mice injected with PBS, after normalization to the housekeeping gene GAPDH. Results are expressed as mean ± SEM. **p < 0.01, ***p < 0.001.
Figure 7.
Figure 7.. Liver Fibrosis Limits Hepatocellular Ag Recognition by CD8 TE
(A and B) Representative Sirius Red (left) or transmission electron (right) micrographs from liver sections of control (A) or carbon tetrachloride (CCl4)-treated (B) HBV replication-competent transgenic mice. Sirius Red staining is shown in red. Scale bars represent 100 μm (Sirius Red) and 1.5 μm (transmission electron micrographs). Red and yellow dotted lines denote LSEC and the hepatocyte body, respectively. SD, space of Disse; H, hepatocyte. (C) Quantification of Sirius red staining in HBV replication-competent transgenic mice that were treated or not with CCl4. n = 3; results are representative of two independent experiments. (D) Percentage of Cor93 CD8 TE that accumulated within the liver 2 hr upon transfer into HBV replication-competent transgenic mice (H2bxd) that were previously treated with carbon tetrachloride (CCl4) relative to control (control = 100%). n = 15; results are representative of two independent experiments. (E) Total hepatic RNA from the same mice described in (D) was analyzed for the expression of IFN-γ by qPCR. n = 15; results are representative of two independent experiments. (F) ALT activity measured in the serum of the same mice described in (D). n = 15; results are representative of two independent experiments. (G) Percentage of GP33 CD8 TE that accumulated within the liver 2 hr upon transfer into LCMV-infected mice that were previously treated with CCl4 relative to control (control = 100%). n = 7; results are representative of two independent experiments. (H) Total hepatic RNA from the same mice described in (G) was analyzed for the expression of IFN-γ by qPCR. Results are expressed as fold induction (f.i.) over LCMV-infected mice injected with PBS, after normalization to the housekeeping gene GAPDH. Results are expressed as mean ± SEM. **p < 0.01, ***p < 0.001.

References

    1. Ando K, Guidotti LG, Cerny A, Ishikawa T, and Chisari FV (1994). CTL access to tissue antigen is restricted in vivo. J. Immunol. 153, 482–488. - PubMed
    1. Bajénoff M, Egen JG, Koo LY, Laugier JP, Brau F, Glaichenhaus N, and Germain RN (2006). Stromal cell networks regulate lymphocyte entry, migration, and territoriality in lymph nodes. Immunity 25, 989–1001. - PMC - PubMed
    1. Benseler V, Warren A, Vo M, Holz LE, Tay SS, Le Couteur DG, Breen E, Allison AC, van Rooijen N, McGuffog C, et al. (2011). Hepatocyte entry leads to degradation of autoreactive CD8 T cells. Proc. Natl. Acad. Sci. USA 108, 16735–16740. - PMC - PubMed
    1. Borges E, Tietz W, Steegmaier M, Moll T, Hallmann R, Hamann A, and Vestweber D (1997). P-selectin glycoprotein ligand-1 (PSGL-1) on T helper 1 but not on T helper 2 cells binds to P-selectin and supports migration into inflamed skin. J. Exp. Med. 185, 573–578. - PMC - PubMed
    1. Dustin ML, and Groves JT (2012). Receptor signaling clusters in the immune synapse. Annu. Rev. Biophys. 41, 543–556. - PMC - PubMed

Publication types

Substances