. 2015 Apr 28;11(4):551-63.
doi: 10.1016/j.celrep.2015.03.045. Epub 2015 Apr 16.

Mechanism and regulation of rapid telomere prophase movements in mouse meiotic chromosomes

Affiliations

Mechanism and regulation of rapid telomere prophase movements in mouse meiotic chromosomes

Chih-Ying Lee et al. Cell Rep. .

Abstract

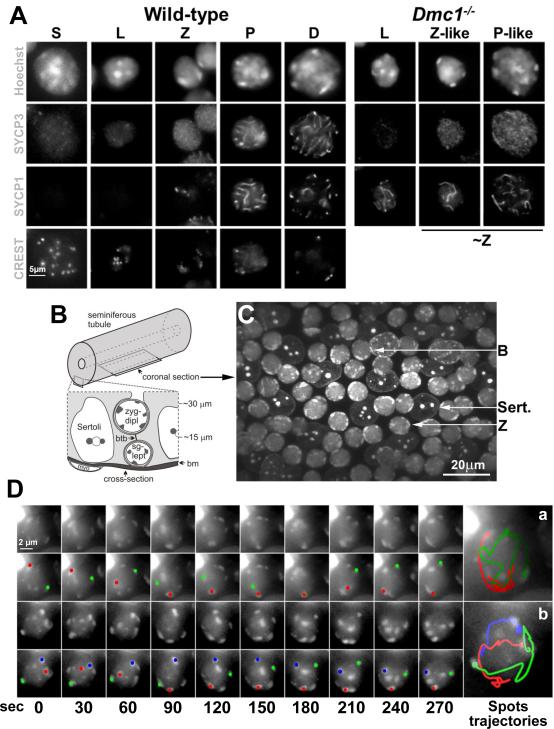
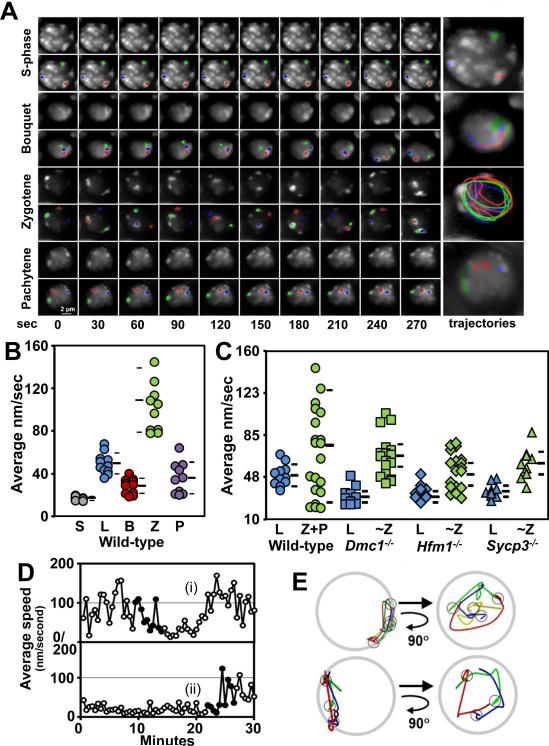
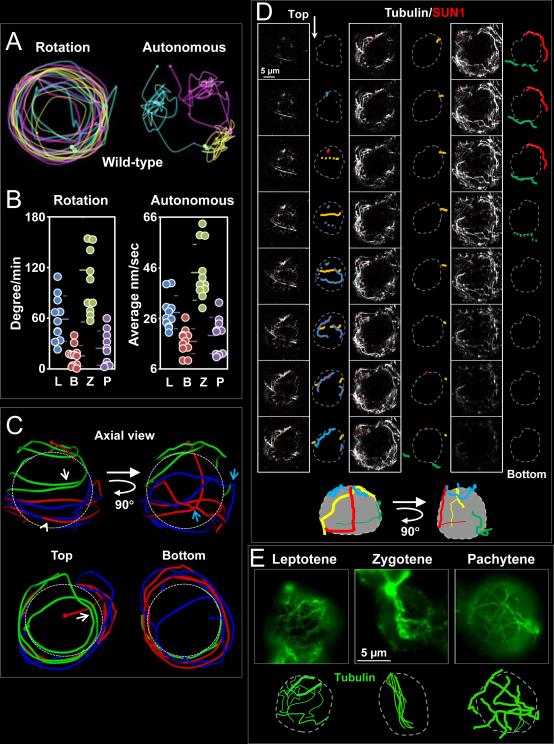
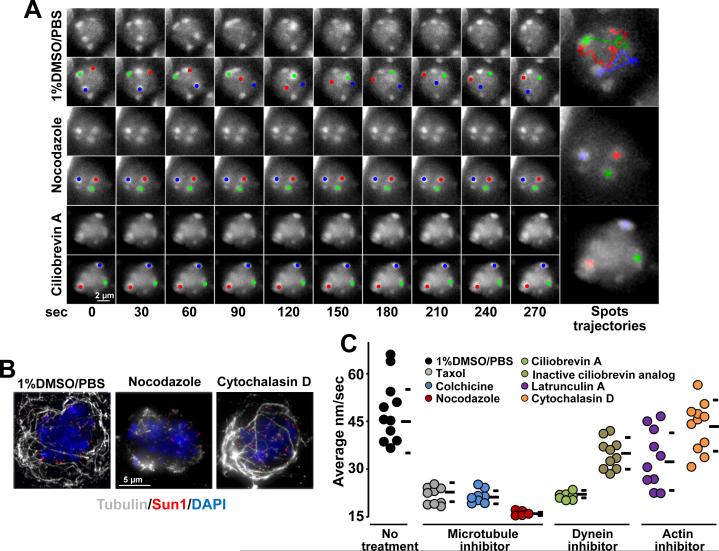
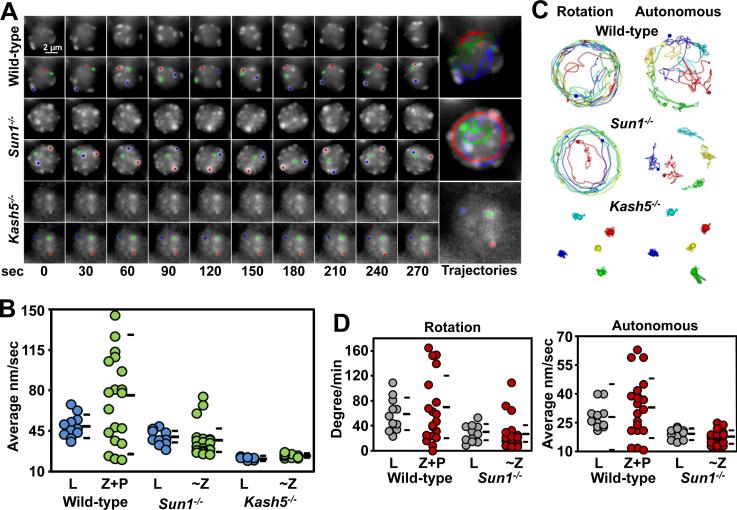
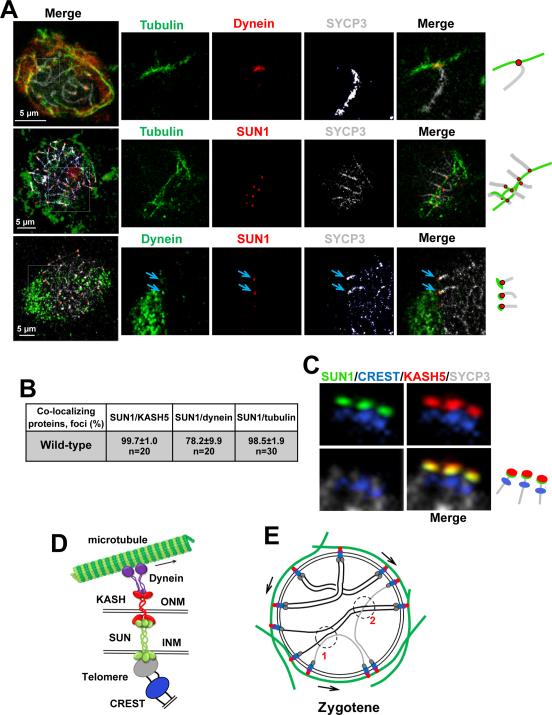
Telomere-led rapid prophase movements (RPMs) in meiotic prophase have been observed in diverse eukaryote species. A shared feature of RPMs is that the force that drives the chromosomal movements is transmitted from the cytoskeleton, through the nuclear envelope, to the telomeres. Studies in mice suggested that dynein movement along microtubules is transmitted to telomeres through SUN1/KASH5 nuclear envelope bridges to generate RPMs. We monitored RPMs in mouse seminiferous tubules using 4D fluorescence imaging and quantitative motion analysis to characterize patterns of movement in the RPM process. We find that RPMs reflect a combination of nuclear rotation and individual chromosome movements. The telomeres move along microtubule tracks that are apparently continuous with the cytoskeletal network and exhibit characteristic arrangements at different stages of prophase. Quantitative measurements confirmed that SUN1/KASH5, microtubules, and dynein, but not actin, were necessary for RPMs and that defects in meiotic recombination and synapsis resulted in altered RPMs.


Figures

Figure 1
Figure 1. Fluorescent Labeled Peri-Centromeric Heterochromatin Spots Exhibit Rapid, Heterogeneous and Independent Movements
A. Single-plane fluorescent images from 3D stacks of s-phase (S), leptotene (L), zygotene (Z), pachytene (P), and diplotene (D) nuclei in wild-type and leptotene (L), zygotene-like (Z-like) and pachytene-like (P-like) in Dmc1−/− spermatocytes squash preparations. For comparison Z-like and P-like nucleus were grouped under ~Z. Magnification bar represents 5μm. B. Diagram showing the location of the indicated cell types and their approximate distances from the basement membrane (bm) of the seminiferous tubule as viewed in cross-section. The position of a coronal section, as shown in C and used to acquire time-lapse images, is also indicated. C. Micrograph of a seminiferous tubule stained with Hoechst 33342, showing the morphology of Sertoli (Sert.), bouquet (B) and zygotene (Z) nuclei. Magnification bar represents 20μm. D. Maximum-intensity projections of time-lapse images of wild-type zygotene nuclei. A zygotene nucleus in which two heterochromatin spots merge, remain together for 60 sec and then separate (a) and an example of a nucleus in which three spots moved independently at different speeds (b) is shown. For each nucleus, the peri-centromeric heterochromatin spots (top panel) and the trajectory of selected spots represented in different colors (bottom panel) are shown. Magnification bar represents 2μm.
Figure 2
Figure 2. RPMs are Regulated by Meiotic Progression and Affected in Recombination Mutants
A. Maximum-intensity projections of time-lapse images of wild-type prophase nuclei. Magnification bar represents 2μm. B. Quantitation of the movement of spots for wild-type premeiotic S-phase (S), leptotene (L), bouquet (B), zygotene (Z), and pachytene (P) spermatocytes. Each circle represents the average of all spots analyzed in a single spermatocyte; horizontal lines indicate the median and standard deviation values. C. Quantitation of spot movements for wild-type and recombination and synapsis mutants. Each symbol represents the average of all spots analyzed in a single spermatocyte; horizontal lines indicate the median and standard deviation values. D. Plot of average speed changes during bouquet formation and resolution in wild-type zygotene nuclei. The duration of the bouquet for cell (i) was ~8 min and >22 min for cell (ii). In panel D, filled dots indicate the periods that are shown as marker traces in E where the cells enter (i) and exit (ii) the bouquet stage. E. Traces of spot movements for the periods shown in D. The small circles mark the spot positions when they were in the bouquet stage, i.e., at the end of the trace (top panel) and the beginning of the trace (bottom panel). Each nucleus is viewed as in the original movie (top diagrams) and was then rotated to show the view down the arrows i.e., from the center of the nucleus towards the bouquet cluster (bottom diagrams). The latter views demonstrate that the bouquet clusters lie on the axes of the clockwise rotations. See also Figure S1.
Figure 3
Figure 3. Identification of a Cytoplasmic Microtubule Network with Defined Stationary Tracks Associated with the Nuclear Envelope
A. RPMs appear to be composed of nuclear rotation and independent chromosome movements. The positions and trajectories of three individual heterochromatin spots in wild-type zygotene nuclei are marked in different colors with a small sphere indicating the initial position and a large sphere indicating the final position. Rotation (left panel) and autonomous (right panel) movements of individual markers were detected in the same nucleus. B. Quantification of autonomous and rotational movements. For all datasets, the mean and standard deviation values are indicated by horizontal lines. Autonomous movements during each stage were significantly different to that of the neighboring stage (all p < 0.0001), except for the comparison of leptotene and pachytene (p = 0.11). Rotational movements in zygotene were significantly different to that of all other stages (all p < 0.03). C. Trajectory of three heterochromatin independent spots in a zygotene spermatocyte nucleus. D. Microtubule cables and their relationship with the nuclear envelope. Consecutive optical sections (0.24 μm) spanning an entire fixed squashed spermatocyte nucleus reveal a complex microtubule cable network arrangement in 3D. The nuclear envelope defined by SUN1 localization is represented by a grey dotted line and microtubules (outlined in colors) are followed through successive sections. The schematic representations (bottom) represent 3D reconstructions of microtubule cable disposition along the nucleus. Magnification bar represents 5μm. E. Single slice image of wild-type spermatocytes at different stages of prophase immunostained using anti α-tubulin antibodies. The cartoons are schematic representations of the representative microtubule patterns at each stage. Magnification bar represents 5μm. See also Figure S1. See also Figure S2.
Figure 4
Figure 4. RPMs are Dependent on Microtubules and dynein
A. Maximum-intensity projections of time-lapse images of wild-type zygotene spermatocytes after the indicated treatments. Magnification bar represents 2μm.B. Maximum-intensity projections of representative pachytene spermatocytes immunostained for α-tubulin and SUN1 after the indicated treatments. Magnification bar represents 5μm.C. Quantitation of RPMs in zygotene spermatocytes after intraperitoneal injection of 1% DMSO or microtubule, dynein or actin inhibitors; horizontal lines indicate the median and standard deviation values. See also Figure S3.
Figure 5
Figure 5. SUN1 and KASH5 are Required for RPMs
A. Maximum-intensity projections of time-lapse images of wild-type, Sun1−/− and Kash5−/− zygotene spermatocyte nuclei. Magnification bar represents 2μm.B. Quantitation of spot movements in the seminiferous tubules of wild-type, Sun1−/− and Kash5−/− mice. C. Autonomous and rotational movements are defective in Sun1−/− and Kash5−/− nuclei. Movement of individual markers highlighted in color are viewed down the axis of rotation. D. Quantification of autonomous and rotational movements in wild-type and Sun1−/− nuclei. For comparison wild-type, zygotene (Z), and pachytene (P) nuclei were grouped. See also Figure S2.
Figure 6
Figure 6. Visualization of KASH5-SUN1 Complexes Coupling Telomeres to dynein on Cytoskeletal Microtubules
A. Example of wild-type pachytene spermatocytes showing co-localization of components of the system that supports RPMs. The magnified areas highlight the association of the chromosome ends and associated protein complexes with microtubules. Arrows indicate dynein-SUN1 co-localization. Magnification bar represents 5μm.B. Quantitation of the co-localization of protein immunosignals in wild-type spermatocytes. C. Example of pachytene chromosome proximal telomeric ends connected to SUN1/KASH5 nuclear envelope bridges. SYCP3 was used to visualize chromosome cores and CREST marks the proximal telomeric ends. D. Proposed model for meiotic chromosome telomere-nuclear envelope attachment and connection to dynein on microtubules. E. Schematic representation of zygotene nuclei. The proposed model in D and E summarizes observations of this and previous studies. In E arrows represent the direction of telomere movements. At 1, RPMs disrupt a non-homologous unproductive interaction. At 2, RPMs facilitate interlock resolution. See also Figure S4.

References

    1. Chi YH, Cheng LI, Myers T, Ward JM, Williams E, Su Q, Faucette L, Wang JY, Jeang KT. Requirement for Sun1 in the expression of meiotic reproductive genes and piRNA. Development. 2009;136:965–973. - PMC - PubMed
    1. Chikashige Y, Ding DQ, Funabiki H, Haraguchi T, Mashiko S, Yanagida M, Hiraoka Y. Telomere-led premeiotic chromosome movement in fission yeast. Science. 1994;264:270–273. - PubMed
    1. Chikashige Y, Haraguchi T, Hiraoka Y. Another way to move chromosomes. Chromosoma. 2007;116:497–505. - PubMed
    1. Conrad MN, Lee CY, Chao G, Shinohara M, Kosaka H, Shinohara A, Conchello JA, Dresser ME. Rapid telomere movement in meiotic prophase is promoted by NDJ1, MPS3, and CSM4 and is modulated by recombination. Cell. 2008;133:1175–1187. - PubMed
    1. Ding DQ, Chikashige Y, Haraguchi T, Hiraoka Y. Oscillatory nuclear movement in fission yeast meiotic prophase is driven by astral microtubules, as revealed by continuous observation of chromosomes and microtubules in living cells. J Cell Sci. 1998;111(Pt 6):701–712. - PubMed

Publication types