. 2013 May 27;118(10):4385-4400.
doi: 10.1002/jgrd.50402. Epub 2013 May 29.

The role of deep convection and nocturnal low-level jets for dust emission in summertime West Africa: Estimates from convection-permitting simulations

Affiliations

The role of deep convection and nocturnal low-level jets for dust emission in summertime West Africa: Estimates from convection-permitting simulations

B Heinold et al. J Geophys Res Atmos. .

Abstract

[1] Convective cold pools and the breakdown of nocturnal low-level jets (NLLJs) are key meteorological drivers of dust emission over summertime West Africa, the world's largest dust source. This study is the first to quantify their relative contributions and physical interrelations using objective detection algorithms and an off-line dust emission model applied to convection-permitting simulations from the Met Office Unified Model. The study period covers 25 July to 02 September 2006. All estimates may therefore vary on an interannual basis. The main conclusions are as follows: (a) approximately 40% of the dust emissions are from NLLJs, 40% from cold pools, and 20% from unidentified processes (dry convection, land-sea and mountain circulations); (b) more than half of the cold-pool emissions are linked to a newly identified mechanism where aged cold pools form a jet above the nocturnal stable layer; (c) 50% of the dust emissions occur from 1500 to 0200 LT with a minimum around sunrise and after midday, and 60% of the morning-to-noon emissions occur under clear skies, but only 10% of the afternoon-to-nighttime emissions, suggesting large biases in satellite retrievals; (d) considering precipitation and soil moisture effects, cold-pool emissions are reduced by 15%; and (e) models with parameterized convection show substantially less cold-pool emissions but have larger NLLJ contributions. The results are much more sensitive to whether convection is parameterized or explicit than to the choice of the land-surface characterization, which generally is a large source of uncertainty. This study demonstrates the need of realistically representing moist convection and stable nighttime conditions for dust modeling. Citation: Heinold, B., P. Knippertz, J. H. Marsham, S. Fiedler, N. S. Dixon, K. Schepanski, B. Laurent, and I. Tegen (2013), The role of deep convection and nocturnal low-level jets for dust emission in summertime West Africa: Estimates from convection-permitting simulations, J. Geophys. Res. Atmos., 118, 4385-4400, doi:10.1002/jgrd.50402.


Figures

Figure 1
Figure 1
Model domains of Unified Model simulations performed within the Cascade project and geographical terms used in the text. Nested 40 km (dashed line), 12 km (dotted line), and 4 km (solid line) domains are shown.
Figure 2
Figure 2
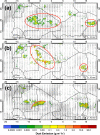
Examples of dust emission patterns indicating different meteorological drivers: (a) breakdown of nocturnal LLJs at 0900 UTC on 31 July 2006, (b) downbursts at 1800 UTC on 28 July 2006, and (c) a haboob at 0200 UTC on 03 August 2006. Instantaneous dust emission fluxes, calculated with the S07 version of DES (see section 2.2) and surface winds at 4 km grid spacing, and 925 hPa wind vectors are shown over the 4 km model domain north of 12°N. Note the logarithmic scale.
Figure 3
Figure 3
Diurnal cycle of mean hourly dust emissions (black line) and mean hourly dust emissions per active grid cell (red line) for the period 26 July to 02 September 2006. Dust emissions are computed using the S07 version of DES and surface winds at 4 km grid spacing. The color-coded numbers are total values of dust emission integrated over the periods 0300 LT–1400 LT (white box) and 1500 LT–0200 LT (grey box).
Figure 4
Figure 4
Diurnal cycle of the fraction of mean hourly dust emissions coinciding with different amounts of total cloud cover (TCLC) between 26 July and 02 September 2006. Dust emissions are calculated using the S07 version of DES and 4 km surface winds.
Figure 5
Figure 5
Diurnal cycle of mean hourly dust emissions for the period 26 July to 02 September 2006 as in Figure 3. Here dust emissions were computed for (a) dry and wet soil conditions (see details in the text) using the S07 version of DES and surface winds at 4 km grid spacing (the dashed red line shows the reduction of dust emission due to precipitation in percent), (b) different land-surface characteristics, i.e., DES model versions, all using winds at 4 km grid spacing, and (c) different grid spacings of the meteorological model using the S07 version of DES, integrated over the 4 km model domain. The dust emissions in Figures 5b and 5c were calculated taking the reduction through precipitation as in the blue line in Figure 5a into account.
Figure 6
Figure 6
Total dust emission for the period 26 July to 02 September 2006 as computed with (a–c) different versions of DES (see details in section 2.2), all using winds at 4 km grid spacing, and (d, e) 12 km and 40 km grid spacings of the meteorological model using the S07 version of DES, shown over the 4 km domain north of 12°N (except for the L08 version, which does not extend further south than 16°N). These computations all take effects of precipitation into account as in the blue line in Figure 5a. Note the logarithmic scale.
Figure 7
Figure 7
Evolution of a haboob over Mauritania on 26/27 July 2006. (left column: a, d, g, j) Hourly dust emissions colored according to the meteorological driver. (center column: b, e, h, k) Vertical cross sections through the points marked on the maps in the left column, showing virtual potential temperature (shading according to scale), specific humidity (white contours every 2 g kg−1), and horizontal wind speed (black contours every 5 m s−1). The values are zonally averaged between the easternmost (17.4°N, 6.6°W) and westernmost (22.2°N, 8.8°W) points. (right column: c, f, i, l) Time-height sections of virtual potential temperature (shading according to scale) and horizontal wind speed (black contours every 5 m s−1) for the sample points “A” - “D” in maps in the left column. The white lines show the first model layer wind speed at 2.5 m. The red bar at the top of each cross section indicates NLLJ detection.
Figure 8
Figure 8
Diurnal cycle of mean hourly dust emissions for the period 26 July to 02 September 2006 as in Figure 3 (thin black line). The other solid and dashed lines show the contribution of different meteorological processes as identified using detection algorithms for convective cold pools (CP) and NLLJs. NLLJ-related emissions with a cold pool or ambiguous detection within the preceding 12 h are shown by the red dotted line. Dust emissions are calculated using the S07 version of DES and 4 km surface winds.
Figure 9
Figure 9
(a–d) Total dust emission for the period 26 July to 02 September 2006 as computed with the S07 version of DES and 4 km surface winds as in Figure 5a. The maps show dust emissions according to the driving meteorological processes as identified using detection algorithms for convective cold pools and nocturnal LLJs as in Figure 8. Note the logarithmic scale. (e) Map of dominant meteorological mechanisms for a given grid cell.
Figure 10
Figure 10
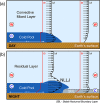
Schematic diagram illustrating the mechanism of nocturnal LLJ formation triggered by an aged convective cold pool. Shown is the (a) daytime and (b) nighttime boundary layer with typical profiles of mean potential temperature (red line) and wind speed (black line) for the undisturbed case, and the boundary layer disturbed by the cold-pool outflow. The red “W” and blue “C” indicate relatively warm and cold air, respectively. SBL stands for stable nocturnal boundary layer. For a more detailed discussion, see section 5.2.

References

    1. Ansmann A, Tesche M, Knippertz P, Bierwirth E, Althausen D, Mueller D, Schulz O. Vertical profiling of convective dust plumes in southern Morocco during SAMUM. Tellus Ser. B-Chem. Phys. Meteorol. 2009;61(1):340–353. doi:10.1111/j.1600-0889.2008.00384.X.
    1. Bagnold RA. The Physics of Blown Sands and Desert Dunes. New York: Methuen; 1941. p. 244.
    1. Balkanski Y, Schulz M, Claquin T, Guibert S. Reevaluation of Mineral aerosol radiative forcings suggests a better agreement with satellite and AERONET data. Atmos. Chem. Phys. 2007;7:81–95. doi:10.5194/acp-7-81-2007.
    1. Barthe C, Mari C, Chaboureau JP, Tulet P, Roux F, Pinty JP. Numerical study of tracers transport by a mesoscale convective system over West Africa. Ann. Geophys. 2011;29(5):731–747. doi:10.5194/angeo-29-731-2011.
    1. Belnap J, Phillips SL, Miller ME. Response of desert biological soil crusts to alterations in precipitation frequency. Oecologia. 2004;141:306–316. doi:10.1007/s00442-003-1438-6. - PubMed

LinkOut - more resources