. 2013 Jun 27;118(12):6100-6121.
doi: 10.1002/jgrd.50394. Epub 2013 Jun 21.

Climatology of nocturnal low-level jets over North Africa and implications for modeling mineral dust emission

Affiliations

Climatology of nocturnal low-level jets over North Africa and implications for modeling mineral dust emission

S Fiedler et al. J Geophys Res Atmos. .

Abstract

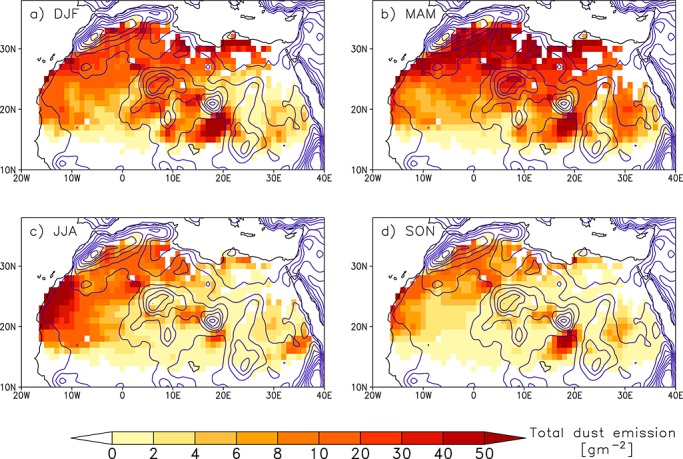
[1] This study presents the first climatology for the dust emission amount associated with Nocturnal Low-Level Jets (NLLJs) in North Africa. These wind speed maxima near the top of the nocturnal boundary layer can generate near-surface peak winds due to shear-driven turbulence in the course of the night and the NLLJ breakdown during the following morning. The associated increase in the near-surface wind speed is a driver for mineral dust emission. A new detection algorithm for NLLJs is presented and used for a statistical assessment of NLLJs in 32 years of ERA-Interim reanalysis from the European Centre for Medium-Range Weather Forecasts. NLLJs occur in 29% of the nights in the annual and spatial mean. The NLLJ climatology shows a distinct annual cycle with marked regional differences. Maxima of up to 80% NLLJ frequency are found where low-level baroclinicity and orographic channels cause favorable conditions, e.g., over the Bodélé Depression, Chad, for November-February and along the West Saharan and Mauritanian coast for April-September. Downward mixing of NLLJ momentum to the surface causes 15% of mineral dust emission in the annual and spatial mean and can be associated with up to 60% of the total dust amount in specific areas, e.g., the Bodélé Depression and south of the Hoggar-Tibesti Channel. The sharp diurnal cycle underlines the importance of using wind speed information with high temporal resolution as driving fields for dust emission models. Citation: Fiedler, S., K. Schepanski, B. Heinold, P. Knippertz, and I. Tegen (2013), Climatology of nocturnal low-level jets over North Africa and implications for modeling mineral dust emission, J. Geophys. Res. Atmos., 118, 6100-6121, doi:10.1002/jgrd.50394.

Keywords: ERA-Interim reanalysis; Harmattan; Saharan heat low; diurnal cycle; dust emission; nocturnal low-level jet.


Figures

Figure 1
Figure 1
Schematic diagram showing the downward mixing of NLLJ momentum during the morning hours as proposed by the literature. Turbulent mixing transports momentum toward the surface, which leads to dust emission in source areas, when the specific threshold velocity is exceeded. For details, see section 2.3.
Figure 2
Figure 2
Schematic diagram showing the criteria for the NLLJ detection with an example of the vertical profiles of wind speed and virtual potential temperature from six-hourly ERA-Interim reanalysis.
Figure 3
Figure 3
Scatter plots for validation of NLLJs in ERA-Interim forecasts at 00 UTC in different months of 2006. Column on the left shows the NLLJ wind speed for (a) Agadez and (c) Tombouctou, and on the right the NLLJ height with error bars indicating the calculated model layer thickness for (b) Agadez and (d) Tombouctou, based on radiosondes launched during AMMA and ERA-Interim forecasts initialized at 12 UTC on the previous day.
Figure 4
Figure 4
Vertical profile of horizontal wind speed at Niamey for (a) 12 June 2006 at 18 UTC, (b) 13 June 2006 at 00 UTC, and (c) 13 June 2006 at 06 UTC based on radiosondes (red) and ERA-Interim forecasts (black).
Figure 5
Figure 5
Scatter plots for validation of NLLJs in ERA-Interim forecasts for different times of the night in June 2006. Column on the left shows the NLLJ wind speed for (a) Agadez and (c) Niamey, and on the right the NLLJ height with error bars indicating the calculated model layer thickness for (b) Agadez and (d) Niamey, based on radiosondes launched during AMMA and ERA-Interim forecasts.
Figure 6
Figure 6
Time series for the low-level profile of horizontal wind speed at Chicha for 28 February to 13 March 2005. Horizontal wind speed (shaded) and time of automatic NLLJ detection (black bar) from ERA-Interim forecasts. Dust emission flux (contour) and time of DSA (orange bar) based on the dust model by Tegen et al. [2002] and ERA-Interim forecasts.
Figure 7
Figure 7
Annual cycle of the frequency of NLLJ nights. Monthly mean occurrence of nights with a NLLJ (colors) and mean 975 hPa geopotential height at 00 UTC (contours) for (a) January, (b) February, (c) March, (d) April, (e) May, (f) June, (g) July, (h) August, (i) September, (j) October, (k) November, and (l) December, based on six-hourly ECMWF ERA-Interim reanalysis 1979–2010 and the new NLLJ detection algorithm. Geopotential heights are contoured in steps of 1 gpdm (thick contours correspond to 30gpdm). Note that the 975 hPa level is below the model orography over parts of North Africa.
Figure 8
Figure 8
Overview of NLLJ hot spots in North Africa for November–February (blue) and April–September (orange). Contours show the terrain height in steps of 200 m. The arrows indicate the prevailing wind direction for each hot spot.
Figure 9
Figure 9
Wind roses for NLLJs (a) in the Bodélé Depression hot spot for November–March and (b) in the Atlantic ventilation hot spot for April–June, based on six-hourly ECMWF ERA-Interim reanalysis 1979–2010. Regions are defined in Figure 10a.
Figure 10
Figure 10
Climatology of NLLJ characteristics. (a) Geographical location of the subdomains (black boxes) and ERA-Interim model orography (grey) in 200 m steps. (b) Box-and-whisker plots for the core height and (c) core wind speed for all NLLJs (solid) and NLLJs emitting dust at the same time (dashed). Based on six-hourly ECWMF ERA-Interim reanalysis for 1979–2010.
Figure 11
Figure 11
Scatter plot for NLLJ core heights against wind speeds at 00 UTC for North Africa, based on six-hourly ERA-Interim reanalysis for 1979–2010. Colors indicate the number of data pairs in the bin. Linear regression (solid line) is given by f(x)=−95.1+42.7x with a Pearson correlation coefficient R2=0.98.
Figure 12
Figure 12
Frequency distribution of the 10 m wind speeds at 18 UTC, 00 UTC, and 06 UTC from ECMWF ERA-Interim six-hourly reanalysis (black) and three-hourly forecasts (grey) over North Africa for 1979–2010. Note the logarithmic scale in the zoom for the high end of the wind speed distribution, which is relevant for mineral dust emission.
Figure 13
Figure 13
Temporal development of NLLJs and NLLJ survivors over North Africa. (a) Nocturnal cycles of the mean fraction of grid boxes with a NLLJ (solid) and DSA (dashed), box-and-whisker plots showing 99%, 75%, 50%, 25%, and 1% percentiles of (b) the NLLJ core height and (c) core wind speed as function of time in UTC. Based on three-hourly ECWMF ERA-Interim forecasts for 1979–2010.
Figure 14
Figure 14
Dust emission climatology. Seasonal mean dust emission for (a) December–February, (b) March–May, (c) June–August, and (d) September–November, based on three-hourly ECMWF ERA-Interim forecasts for 1979–2010. Contours show the terrain height in steps of 200 m.
Figure 15
Figure 15
Frequency distribution of the 10 m wind speed during the mid-morning. Spatially averaged frequency distribution over North Africa of (a) the instantaneous 10 m wind speed at 06 UTC and 09 UTC and (b) the 10 m wind gusts at 09 UTC and 12 UTC when a NLLJ or a NLLJ survivor has been detected (grey), and when no NLLJ structure has been identified (black), based on three-hourly ECMWF ERA-Interim forecasts for 1979–2010.
Figure 16
Figure 16
Seasonal mean NLLJ contribution to dust emission for (a) December–February, (b) March–May, (c) June–August, and (d) September–November, based on three-hourly ECMWF ERA-Interim forecasts for 1979–2010. Contours show the terrain height in steps of 200 m.
Figure 17
Figure 17
Contribution of NLLJs to mineral dust emission. Annual cycle of the monthly mean dust emission (lines) and the monthly mean of the relative contribution of NLLJs to the total dust emission (bars) at different times of the day (colors) as spatial mean per subdomains (a) N1, (b) N2, and (c) N3 based on three-hourly ECMWF ERA-Interim forecasts for 1979–2010. Regions are defined in Figure 10a.
Figure 18
Figure 18
As Figure 7 for subdomains (a) S1, (b) S2, (c) S3, and (d) S4. Note the different scale for the dust emission.

References

    1. Abdou K, Parker D J, Brooks B, Kalthoff N, Lebel T. The diurnal cycle of lower boundary-layer wind in the West African monsoon. Quart. J. Roy. Meteor. Soc. 2010;136(s1):66–76. doi: 10.1002/qj.536. - DOI
    1. Alpert P, Neeman B U, Shayel Y. Climatological analysis of Mediterranean cyclones using ECMWF data. Tellus A. 1990;42:65–77. doi: 10.1034/j.1600-0870.1990.00007.x. - DOI
    1. Baas P, Bosveld F, Baltink H K. A climatology of nocturnal low-level jets at Cabauw. J. Appl. Meteor. and Climat. 2009;48:1627–1642.
    1. Bain C L, Parker D J, Taylor C M, Kergoat L, Guichard F. Observations of the nocturnal boundary layer associated with the West African monsoon. Mon. Wea. Rev. 2010;138(8):3142–3156. doi: 10.1175/2010MWR3287.1. - DOI
    1. Banta R, Pichugina Y, Newsom R. Relationship between low-level jet properties and turbulence kinetic energy in the nocturnal stable boundary layer. J. Atmos. Sci. 2003;60(20):2549–2555. doi: 10.1175/1520-0469(2003)060<2549:RBLJPA>2.0.CO;2. - DOI

LinkOut - more resources