. 2015 Jun;26(6):915-23.
doi: 10.1007/s13361-015-1133-y. Epub 2015 Apr 17.

Metabolomic Analysis of Oxidative and Glycolytic Skeletal Muscles by Matrix-Assisted Laser Desorption/IonizationMass Spectrometric Imaging (MALDI MSI)

Affiliations

Metabolomic Analysis of Oxidative and Glycolytic Skeletal Muscles by Matrix-Assisted Laser Desorption/IonizationMass Spectrometric Imaging (MALDI MSI)

Yu-Hsuan Tsai et al. J Am Soc Mass Spectrom. 2015 Jun.

Abstract

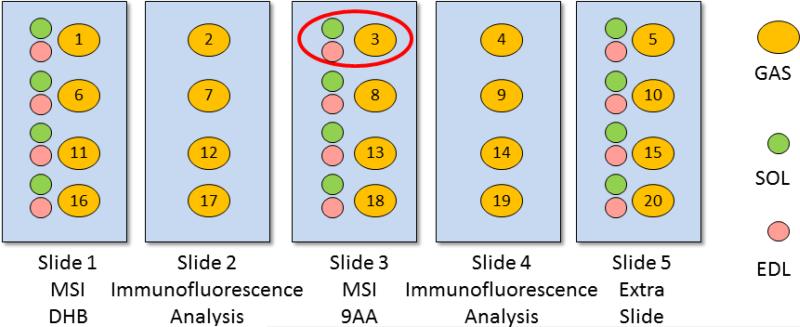
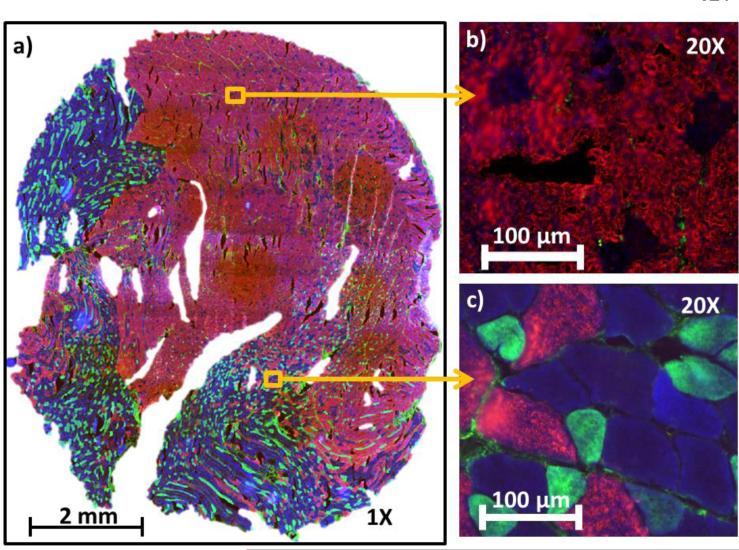
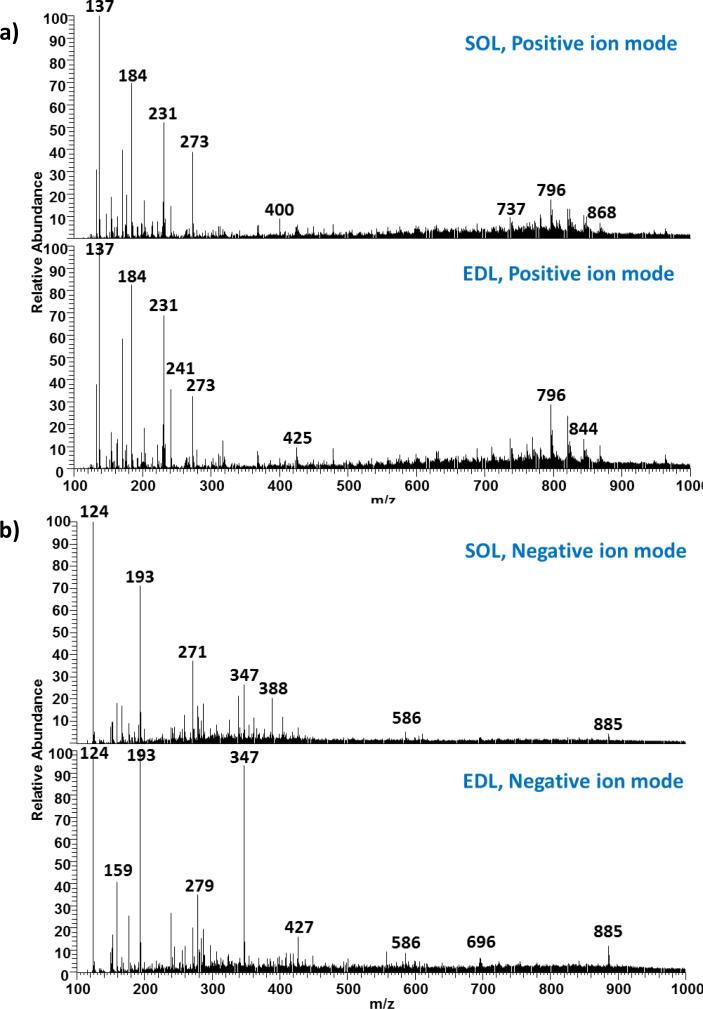
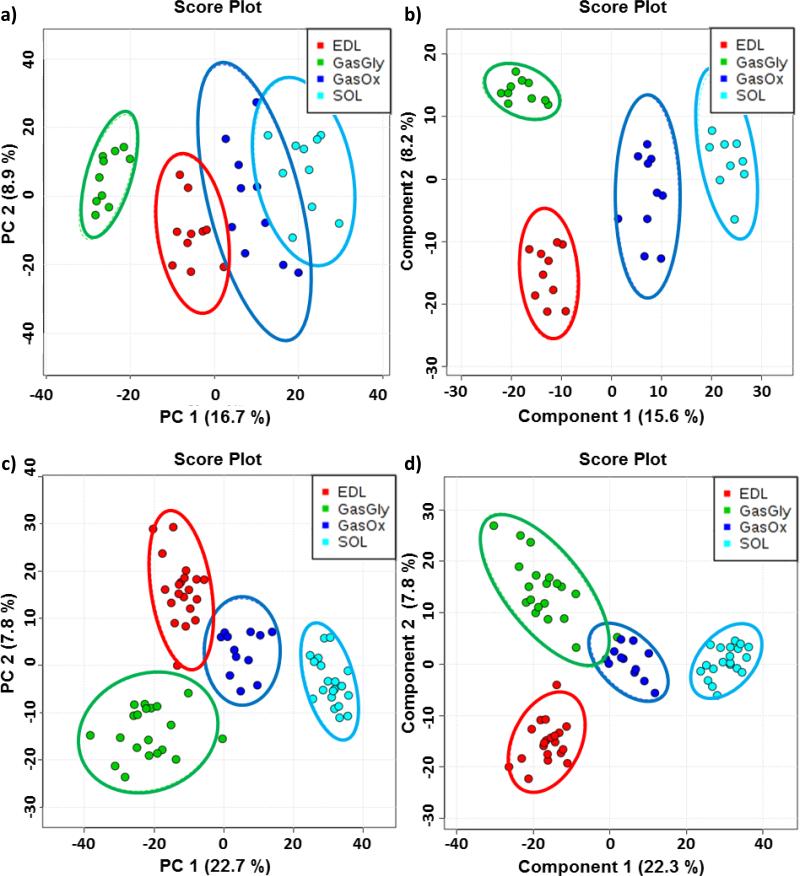
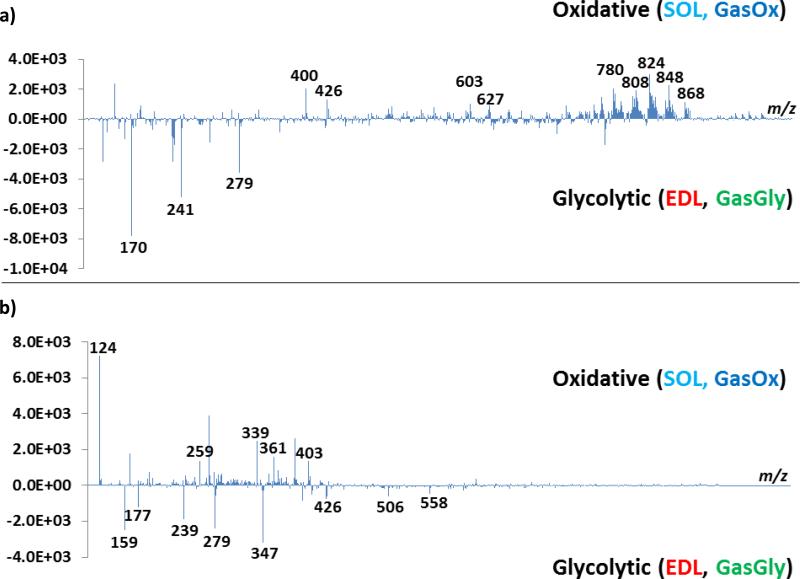
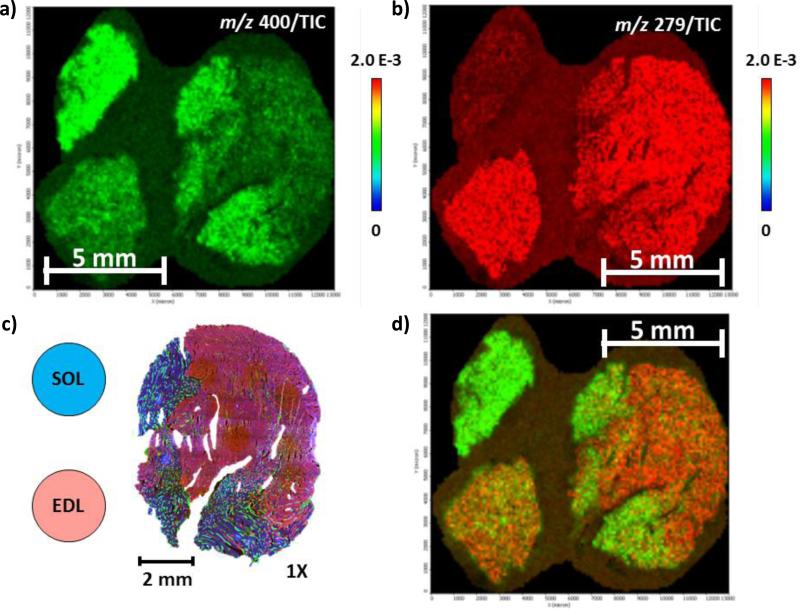
Skeletal muscles are composed of heterogeneous muscle fibers that have different physiological, morphological, biochemical, and histological characteristics. In this work, skeletal muscles extensor digitorum longus, soleus, and whole gastrocnemius were analyzed by matrix-assisted laser desorption/ionization mass spectrometry to characterize small molecule metabolites of oxidative and glycolytic muscle fiber types as well as to visualize biomarker localization. Multivariate data analysis such as principal component analysis (PCA) and partial least squares discriminant analysis (PLS-DA) were performed to extract significant features. Different metabolic fingerprints were observed from oxidative and glycolytic fibers. Higher abundances of biomolecules such as antioxidant anserine as well as acylcarnitines were observed in the glycolytic fibers, whereas taurine and some nucleotides were found to be localized in the oxidative fibers.


Figures

Figure 1
Figure 1
Muscle cross section preparation and arrangement for mass spectrometric imaging and immunofluorescence analyses and correlation. For MSI, SOL, EDL, and GAS were analyzed together as a group as indicated by the red circle.
Figure 2
Figure 2
Myosin heavy chain (MyHC) immunofluorescence stained GAS muscle from a 6-month old rat. The fibers were stained with antibodies that emitted fluorescence as described in Table 1. There are 4 different MyHC expressions in rat, type I (blue), IIa (green), IIx (black), and IIb (red). Type IIx fibers, which existed in small in this cross section, were left unstained and hence emitted no fluorescence. Figure 2a) shows the image at 1X, whereas b) and c) show the zoom in at 20X of selected areas indicated by the yellow squares.
Figure 3
Figure 3
Comparison between SOL and EDL in a) positive ion mode, and b) negative ion mode. Each mass spectrum is an averaged spectrum of 10 consecutive scans collected form the corresponding tissue.
Figure 4
Figure 4
PCA and PLS-DA results from the mean-centered and auto scaled dataset. Figure a) and b) display the score plots between the first two components from PCA and PLS-DA, respectively, on the positive ion mode dataset. The two analyses were also performed on the negative ion mode dataset and are shown in c) and d). Each data point represents one averaged spectrum of 10 scans collected at the area of interest; the colored circles around the data points represent the 95% confidence interval of the sample grouping
Figure 5
Figure 5
PC1 loadings plots from a) positive and b) negative ion mode PCA. The labeled m/z peaks are those that show significant localization in the MS images.
Figure 6
Figure 6
Representative positive ion mode MS images of a) m/z 400, palmitoyl carnitine, and b) m/z 279, anserine, showing the localization of biomarkers in the oxidative and glycolytic areas, respectively. d) shows the overlay image of m/z 279 and 400. c) shows the arrangement of the three tissues SOL (oxidative), EDL (glycolytic), and GAS (gastrocnemius) with the circles indicate where the SOL and EDL were positioned for MSI relative to the GAS, which is shown with the immunofluorescence image.

References

    1. Squire JM. Muscle: Design, Diversity, and Disease. The Benjamin/Cummings Publishing Company, Inc.; Menlo Park, California: 1986. pp. 319–322.
    1. Wortmann RL. Diseases of Skeletal Muscle. 8-12. Lippincott Williams & Wilkins; Philadelphia, PA: 2000. pp. 208–209.
    1. Jackson SN, Woods AS. Direct profiling of tissue lipids by MALDITOFMS. Journal of chromatography. B, Analytical technologies in the biomedical and life sciences. 2009;877(26):2822–2829. - PMC - PubMed
    1. Schiller J. In: MALDI-MS of Lipids. MALDI MS, editor. Wiley-VCH Verlag GmbH & Co.; KGaA: 2007. pp. 215–243.
    1. Tahallah N, Brunelle A, De La Porte S, Laprévote O. Lipid mapping in human dystrophic muscle by cluster-time-of-flight secondary ion mass spectrometry imaging. Journal of Lipid Research. 2008;49(2):438–454. - PMC - PubMed

Publication types