. 2016 Jan 21;35(3):290-300.
doi: 10.1038/onc.2015.94. Epub 2015 Apr 20.

XactMice: humanizing mouse bone marrow enables microenvironment reconstitution in a patient-derived xenograft model of head and neck cancer

Affiliations

XactMice: humanizing mouse bone marrow enables microenvironment reconstitution in a patient-derived xenograft model of head and neck cancer

J J Morton et al. Oncogene. .

Abstract

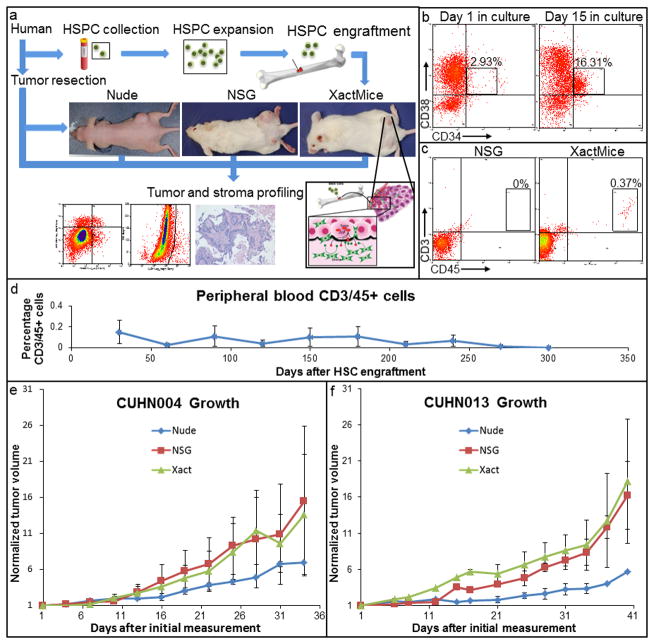
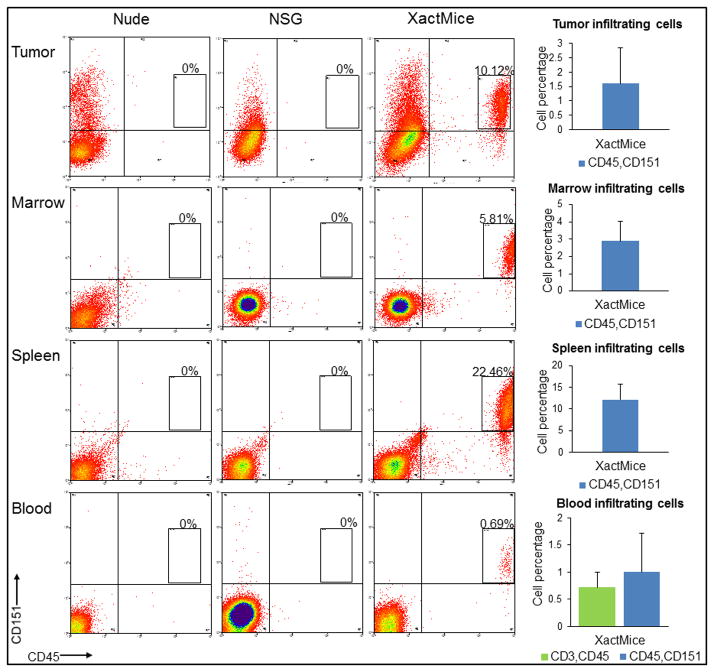
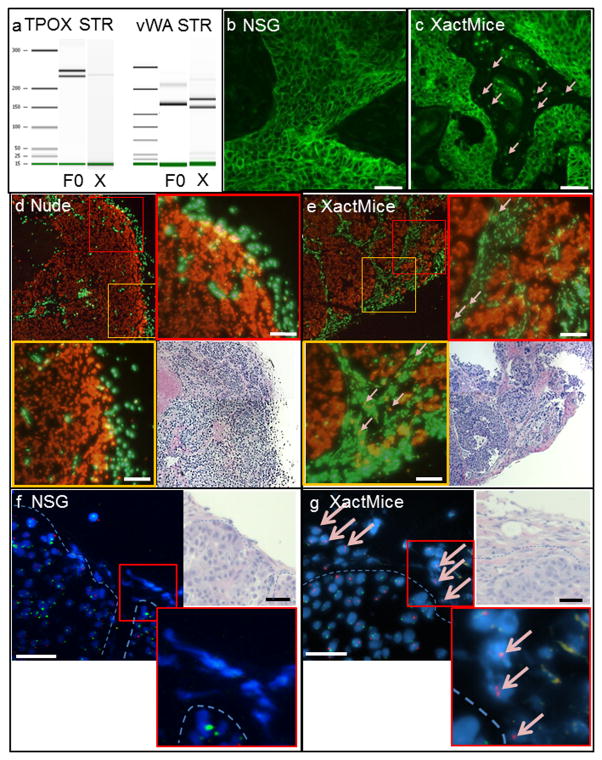
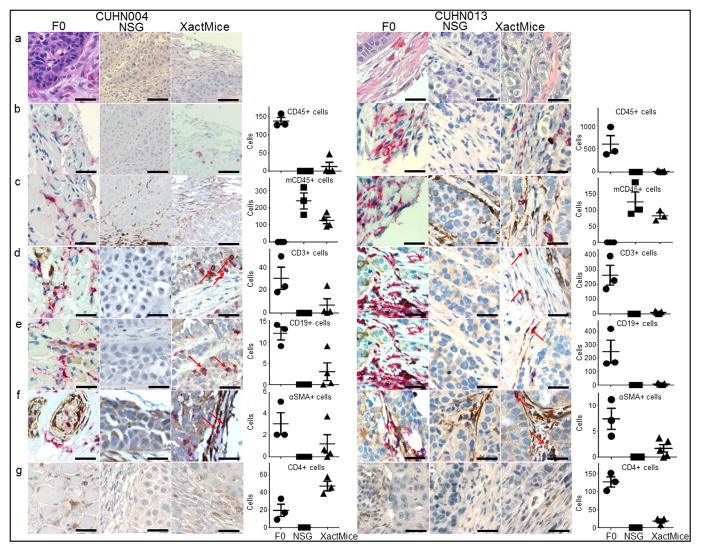
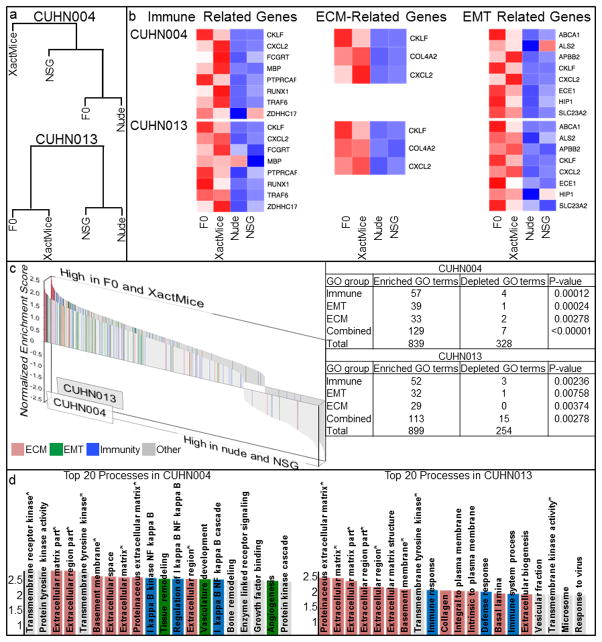
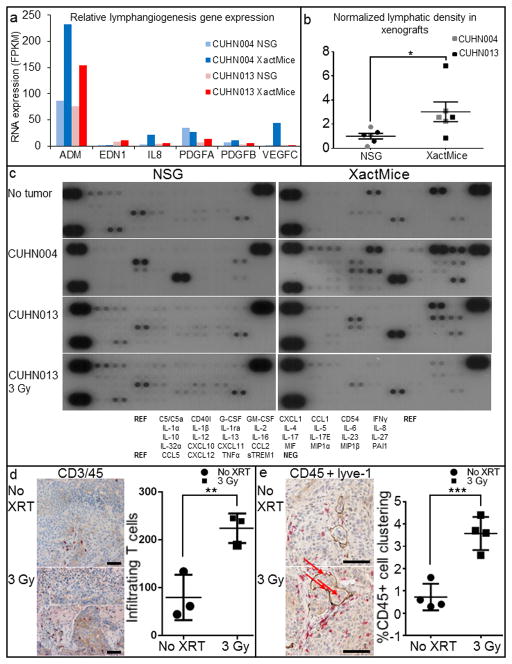
The limitations of cancer cell lines have led to the development of direct patient-derived xenograft models. However, the interplay between the implanted human cancer cells and recruited mouse stromal and immune cells alters the tumor microenvironment and limits the value of these models. To overcome these constraints, we have developed a technique to expand human hematopoietic stem and progenitor cells (HSPCs) and use them to reconstitute the radiation-depleted bone marrow of a NOD/SCID/IL2rg(-/-) (NSG) mouse on which a patient's tumor is then transplanted (XactMice). The human HSPCs produce immune cells that home into the tumor and help replicate its natural microenvironment. Despite previous passage on nude mice, the expression of epithelial, stromal and immune genes in XactMice tumors aligns more closely to that of the patient tumor than to those grown in non-humanized mice-an effect partially facilitated by human cytokines expressed by both the HSPC progeny and the tumor cells. The human immune and stromal cells produced in the XactMice can help recapitulate the microenvironment of an implanted xenograft, reverse the initial genetic drift seen after passage on non-humanized mice and provide a more accurate tumor model to guide patient treatment.


Conflict of interest statement

COMPETING FINANCIAL INTERESTS

A.J., Y.R., XJ.W. and D.R.R. are co-inventors of technology presented in this report. The other authors declare no competing financial interests.

Figures

Figure 1
Figure 1. Overview and characterization of XactMice
(a) Schematic describing the generation of XactMice from human HSPCs, whose progeny migrate into the xenograft and differentiate into stromal cells. The growth and composition of tumors can be compared in nude, NSG, and XactMice. (b) Flow cytometry measuring the expansion of HSPCs in vitro by the percentage of CD34/CD38+ cells. (c) Flow cytometry detecting human hematopoietic CD3/CD45+ cells in peripheral XactMice - but not NSG - blood, indicating that the HSPCs have successfully engrafted and are generating circulating lymphocytes. (d) The average percentage of human CD3/CD45+ cells in the peripheral blood of XactMice, as determined by flow cytometry, over the course of seven months after engraftment. (e, f) There were no significant differences in either CUHN004 or CUHN013 tumor growth rates between nude, NSG, and XactMice. Tumor measurements (W × W × H)/2 were recorded from all mouse strains in three separate experiments. Although tumors seem to grow faster in the NSG and XactMice, no statistical difference was observed in growth between the three strains in these experiments. Average tumor volumes (mm3) with the standard errors were used to create the recorded growth curves.
Figure 2
Figure 2. XactMice tumors and tissues harbor human immune cell populations
Upper panel: Flow cytometry showing that human CD45/151+ cells can be identified and quantified in tumors removed from XactMice, while no corresponding populations can be recovered from nude or NSG mice. Lower panels: A CD45/151+ cell population can also be identified and quantified in the bone marrow, spleen, and peripheral blood of XactMice, while no such cells are observed in nude and NSG controls. Bars represent standard errors.
Figure 3
Figure 3. Documentation of human stroma on XactMice
Human cells only invade the tumors in XactMice. (a) Bioanalyzer gel of two well-defined STR loci, TPOX and vWA (27). Patient DNA from the originator tumor (F0, lanes 2 and 5). XactMice xenograft CD45/CD151+ DNA (X, lanes 3 and 6). (b,c) Human CD151 immunofluorescence. Although the CD151 antibody binds the human tumor cells in both the NSG and XactMice tumors, in NSG tumors (b), the stroma remains unstained, while in XactMice (c) the unstained mouse stroma is punctuated with CD151+ human cells (pink arrows). Magnification is 20×. (d,e) FISH analysis of nude and XactMice tumors. Both xenografts are composed primarily of human (red) tumor cells surrounded by mouse (green) stromal cells. No human cells infiltrate the stroma within the nude xenograft (d). Human cells can be observed throughout the stroma within the XactMice xenograft (e; enlarged and highlighted with pink arrows). Magnification is 10× for the tumor sections and 20× for the enlarged portions. (f,g) FISH analysis images of tumor sections using fluorescently-labeled X (red) and Y (green) probes. In the NSG (f), all tumor cells are male. The mouse stromal cells do not bind to either of the probes. A dashed line has been added to demarcate the approximate tumor-stroma boundary. In XactMice (g), the tumor cells are male, and the stroma is composed largely of mouse cells, but also contains female human cells. Expanded inserts were captured under increased magnification (100×). In all images, the scale bar equals 50 μm.
Figure 4
Figure 4. Characterization of human stromal cells in control and XactMice tumors
A comparison of CUHN004 and CUHN013 patient (F0) tumors with their corresponding NSG and XactMice xenografts. Bar graphs represent the average number of stained cells calculated from three non-overlapping fields visualized in 0.2 mm2 tumor sections taken from four (CUHN004) or five (CUHN013) separate XactMice and compared to three non-overlapping fields from F0 and NSG tumors (b–g). (a) H/E comparisons of the F0, NSG, and XactMice specimens. (b) Tumor IHC using the human pan-leukocyte CD45 antibody (red) indicates that human white blood cells are present in the F0 and XactMice tumors (albeit at difference frequency), but not the NSG tumor. (c) Tumor IHC with both human (red) and mouse (brown) CD45 antibodies indicates that mouse white blood cells are present in the NSG and XactMice tumors. (d) Dual human CD3 (brown) and CD45 (red) IHC indicates that T cells can be found in the F0 and XactMice tumors. (e) Dual human CD19 (brown) and CD45 (red) IHC indicates that B cells can be seen in both the F0 and XactMice tumors. (f) Dual human αSMA (brown) and CD45 (red) IHC. In F0 tumors, cells with either or both antigens are present. In NSGs, some stromal cells stain for the αSMA antigen, indicating that this antibody cross-reacts with mouse αSMA. XactMice tumor cells that stain for the presence of both antigens (indicated by red arrows) must be of human origin and exhibit some fibrocyte characteristics. (g) Human CD4 IHC indicates that T-helper cells can be found in both F0 and XactMice tumors. Magnification is 40× and the scale bar equals 50 μm.
Figure 5
Figure 5. Whole transcriptome analyses
(a) Dendrograms of the four RNA sequencing data sets for the CUHN004 and CUHN013 tumors indicate that the XactMice environment alters gene expression from that observed in the NSG. (b) Heatmaps depicting the relative expression of paired sets of genes in both CUHN004 and CUHN013. The expression of genes known to play roles in these pathways was compared across F0 patient, XactMice, nude, and NSG samples. A red color indicates high RNA expression, while a blue shade signifies a low level of expression. (c) Waterfall graphs showing the relative enrichment of all GO terms associated with the differentially expressed genes identified in the F0 and XactMice tumors. Enrichment scores greater than 1.3 indicate that the GO term is statistically enriched (P-value<0.05) among these genes. After this enrichment analysis, GO terms were color-coded according to their overarching biological process, the most frequently observed of which were 22 immune system (blue), extracellular matrix (ECM; pink), and epithelial mesenchymal transition (EMT; green.) A paired z-test for proportions (inset table) shows that the enrichment of the GO terms representing each of these processes is statistically significant in genes differentially expressed in the F0 patient and XactMice tumors. (d) An enlargement of the top twenty most enriched GO terms in the tumor waterfall graphs from above. Starred (*) GO terms are enriched in both tumors.
Figure 6
Figure 6. Physiological consequences of differential XactMice gene expression
(a) A comparison of the FPKM values of several genes involved in lymphangiogenesis. (b) Graphical comparison of lymphatic vasculature in NSG and XactMice tumors. The average number of lyve-1 staining vessels per mm2 in the NSG tumors was used as a baseline against which XactMice tumors were compared. *P-value = 0.0393. (c) Cytokine arrays comparing plasma from NSG and XactMice. Relative cytokine concentrations were compared with ImageJ. (d) Dual CD45+ (red) and CD3+ (brown) IHC of XactMice CUHN013 tumors harvested after 0 and 3 Gy flank irradiation identifies infiltrating T cells (arrows). The associated graph shows that these cells are more abundant after irradiation. **P-value = 0.0115. (e) Dual CD45+/lyve-1 IHC indicates little association between invading blood cells and lymph tissue in non-irradiated tumors, but after 3 Gy, the CD45+ cells cluster around, and are sometimes found within (arrows), the lymph vessels. The graph shows the increased association of human CD45+ cells with lyve-1 staining tissue after irradiation. ***P-value = 0.001. To be included, CD45+ cells must be within 200 um of lyve-1+ cells. Magnification is 10× and the scale bar equals 50 μm.

References

    1. Whiteside TL. The tumor microenvironment and its role in promoting tumor growth. Oncogene. 2008;27(45):5904–12. Epub 2008/10/07. - PMC - PubMed
    1. Wels J, Kaplan RN, Rafii S, Lyden D. Migratory neighbors and distant invaders: tumor-associated niche cells. Genes & development. 2008;22(5):559–74. Epub 2008/03/05. - PMC - PubMed
    1. Engelholm SA, Vindelov LL, Spang-Thomsen M, Brunner N, Tommerup N, Nielsen MH, et al. Genetic instability of cell lines derived from a single human small cell carcinoma of the lung. European journal of cancer & clinical oncology. 1985;21(7):815–24. Epub 1985/07/01. - PubMed
    1. Hausser HJ, Brenner RE. Phenotypic instability of Saos-2 cells in long-term culture. Biochemical and biophysical research communications. 2005;333(1):216–22. Epub 2005/06/09. - PubMed
    1. Dadras SS, Paul T, Bertoncini J, Brown LF, Muzikansky A, Jackson DG, et al. Tumor lymphangiogenesis: a novel prognostic indicator for cutaneous melanoma metastasis and survival. The American journal of pathology. 2003;162(6):1951–60. Epub 2003/05/22. - PMC - PubMed

Publication types