. 2015 May;125(5):2136-50.
doi: 10.1172/JCI78558. Epub 2015 Apr 20.

Integrated compensatory network is activated in the absence of NCC phosphorylation

Integrated compensatory network is activated in the absence of NCC phosphorylation

P Richard Grimm et al. J Clin Invest. 2015 May.

Abstract

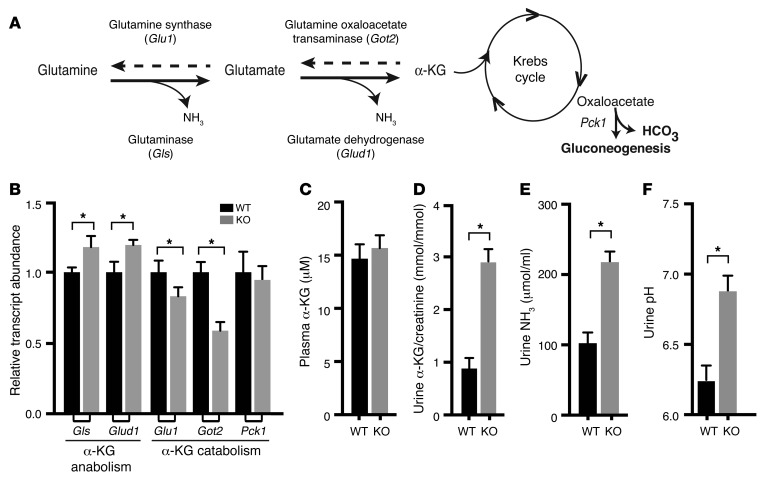
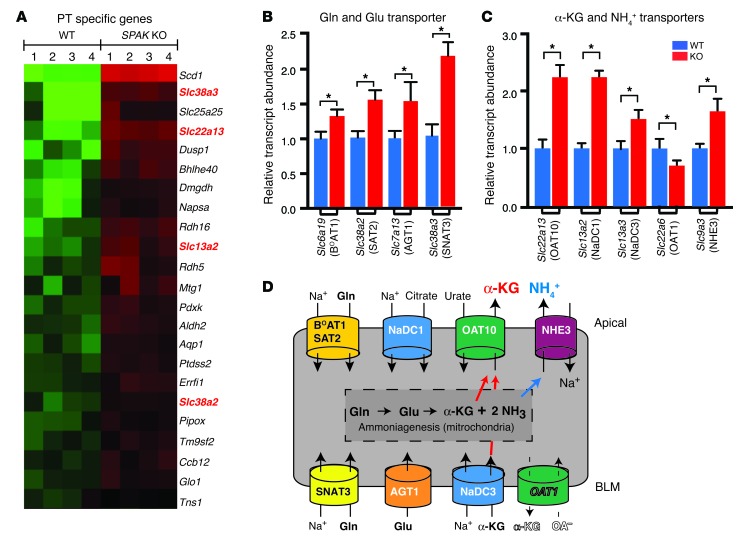
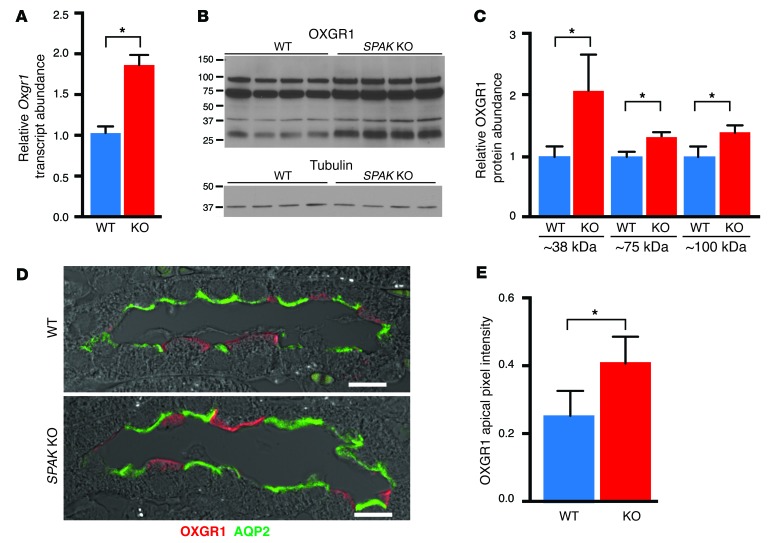
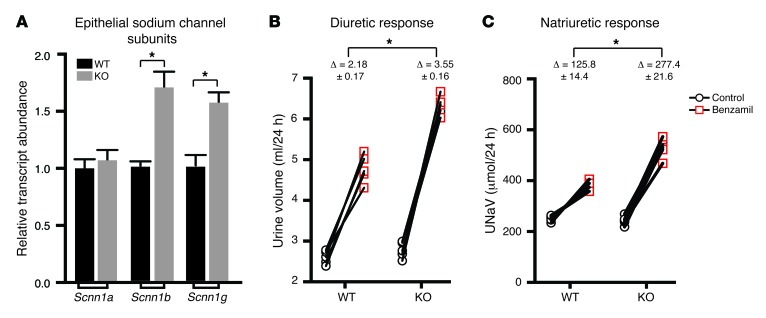
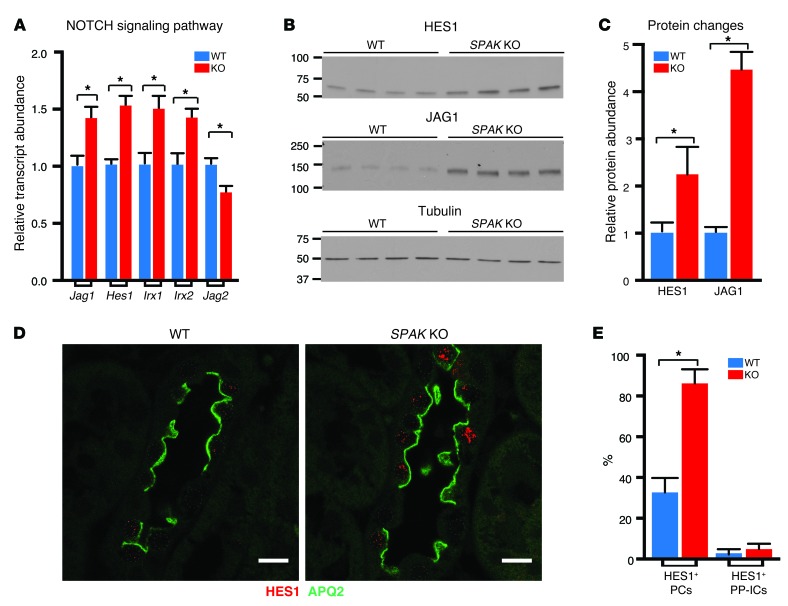
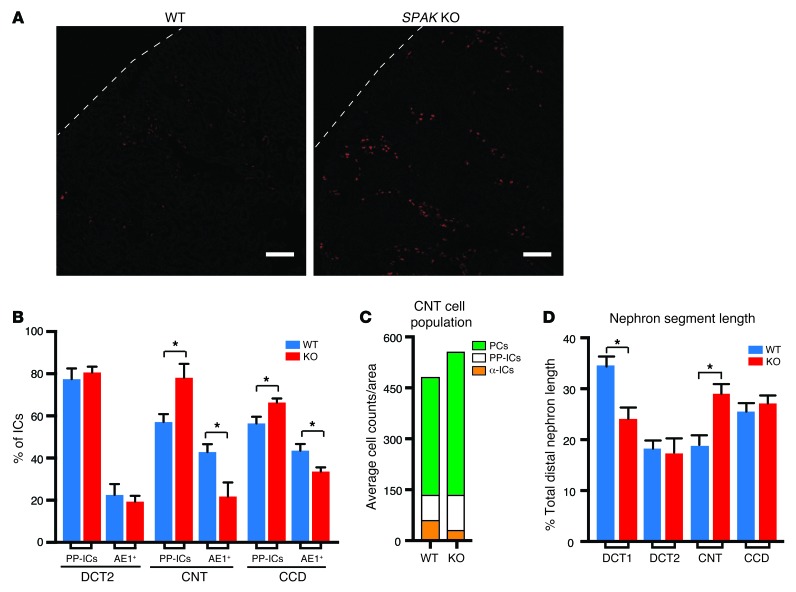
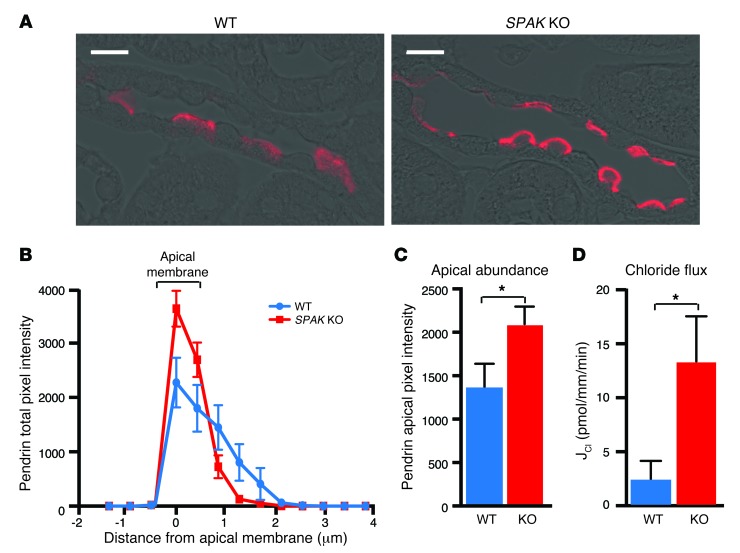
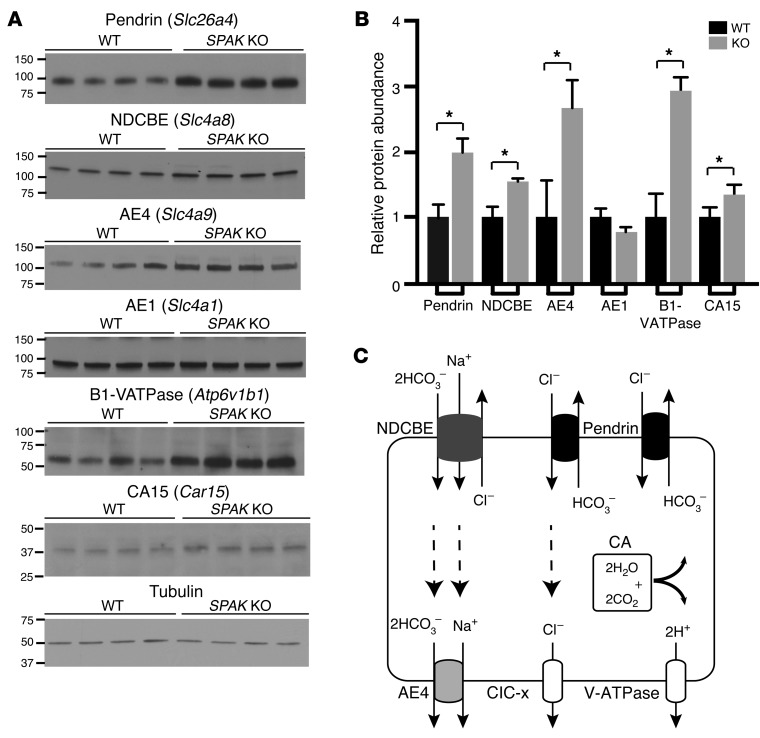
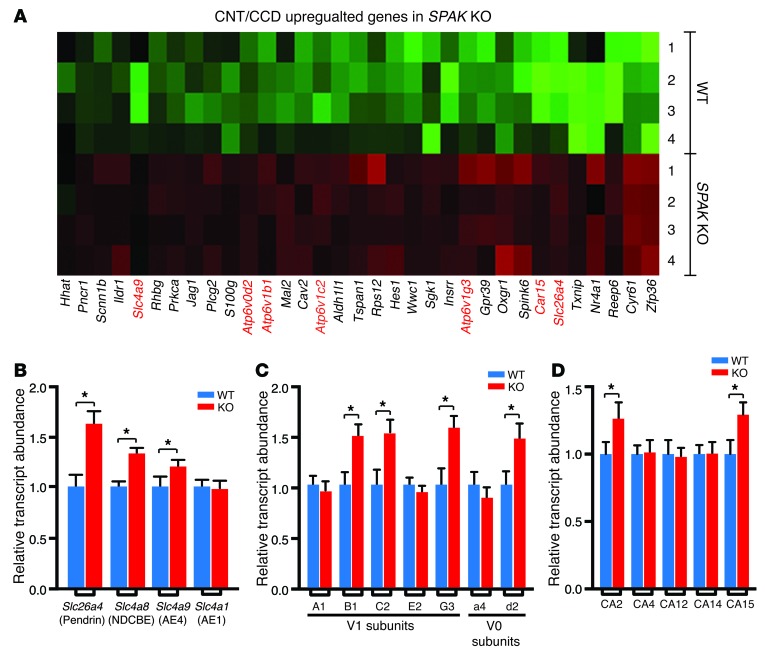
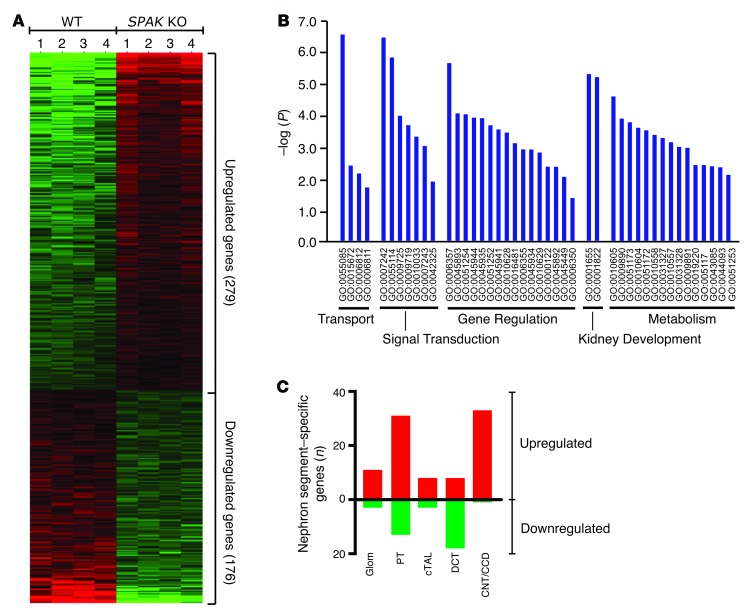
Thiazide diuretics are used to treat hypertension; however, compensatory processes in the kidney can limit antihypertensive responses to this class of drugs. Here, we evaluated compensatory pathways in SPAK kinase-deficient mice, which are unable to activate the thiazide-sensitive sodium chloride cotransporter NCC (encoded by Slc12a3). Global transcriptional profiling, combined with biochemical, cell biological, and physiological phenotyping, identified the gene expression signature of the response and revealed how it establishes an adaptive physiology. Salt reabsorption pathways were created by the coordinate induction of a multigene transport system, involving solute carriers (encoded by Slc26a4, Slc4a8, and Slc4a9), carbonic anhydrase isoforms, and V-type H⁺-ATPase subunits in pendrin-positive intercalated cells (PP-ICs) and ENaC subunits in principal cells (PCs). A distal nephron remodeling process and induction of jagged 1/NOTCH signaling, which expands the cortical connecting tubule with PCs and replaces acid-secreting α-ICs with PP-ICs, were partly responsible for the compensation. Salt reabsorption was also activated by induction of an α-ketoglutarate (α-KG) paracrine signaling system. Coordinate regulation of a multigene α-KG synthesis and transport pathway resulted in α-KG secretion into pro-urine, as the α-KG-activated GPCR (Oxgr1) increased on the PP-IC apical surface, allowing paracrine delivery of α-KG to stimulate salt transport. Identification of the integrated compensatory NaCl reabsorption mechanisms provides insight into thiazide diuretic efficacy.


Figures

Figure 10
Figure 10. Upregulation of key enzymes necessary for ammoniagenesis and α-KG production activate α-KG secretion.
(A) Reversible multienzyme ammoniagenesis pathway produces α-KG from glutamine. (B) Summary of qPCR survey of key enzymes responsible for α-KG anabolism (Gls and Glud1) and catabolism (Glu1 and Got2). Data represent the mean ± SEM. n = 6 animals. *P < 0.05 by 2-tailed t test for WT versus KO. Summary data for plasma α-KG (C), as well as for urinary excretion of α-KG (D) and ammonia (NH3 and NH4+) (E) and urine pH (F). Data represent the mean ± SEM. n = 6 animals. *P < 0.05 by 2-tailed t test for WT versus KO.
Figure 9
Figure 9. Induction of PT transport proteins in SPAK KO mice facilitates α-KG production and secretion.
(A) PT-specific gene profile revealed upregulation of 2 glutamine (Gln) transporters (Slc38a3 and Slc38a2) and 2 α-KG transporters (Slc22a13 and Slc13a2). (B and C) Summary of qPCR screen for glutamine and glutamate transporters, α-KG transporters, and Nhe3. Data represent the mean ± SEM. n = 6 animals per group. *P < 0.05 by 2-tailed t test for WT versus KO. (D) Transport model showing that stimulation of Gln and Glu uptake transporters provides a substrate for ammoniagenesis and α-KG production, while the differential regulation of α-KG transporters favors α-KG delivery into the tubular fluid for paracrine activation of OXGR1. BLM, basolateral membrane.
Figure 8
Figure 8. Induction of the α-KG–activated GPCR OXGR1 in SPAK KO mice.
(A) qPCR of Oxgr1 transcript summary data. Data represent the mean ± SEM. n = 5 animals per group. *P < 0.05 by 2-tailed t test for WT versus KO. (B) Western blot of OXGR1. (C) Quantitative summary of relative protein abundance. Data represent the mean ± SEM. n = 4 animals. *P < 0.05 by 2-tailed t test for WT versus KO. (D) Confocal images of OXGR1 (red) in representative CNTs from WT and SPAK KO mice. Scale bars: 10 μm. Note the increased expression of OXGR1 at the IC apical membrane in SPAK KO mice compared with that in WT mice. Cell types were identified by the presence of AQP2 (PCs, green), AE1 (α-IC marker, not shown), and PNA (PP-ICs, not shown). (E) Quantification of OXGR1 apical membrane abundance. Data represent the mean ± SEM. 50 cells per animal; n = 5 animals per group. *P < 0.05 by 2-tailed t-test for WT versus KO.
Figure 7
Figure 7. ENaC expression and function are enhanced in SPAK KO mice.
(A) β-ENaC was identified in the SPAK KO profile as an upregulated gene. qPCR screening of all ENaC subunits verified the upregulation of the β subunit but also identified the γ subunit as upregulated in SPAK KO mice. Data represent the mean ± SEM. n = 6 animals. *P < 0.05 by 2-tailed t test for WT versus KO. The 24-hour diuretic (B) and natriuretic (C) responses of WT and SPAK KO mice to a single dose (1.0 μg/mg) of benzamil showed that basal urine volumes and UNaV were not different between the 2 animal groups. Additionally, both groups had demonstrated a significant increase in urine and sodium excretion when treated with benzamil. However, the change in urine and sodium excretion was significantly higher in SPAK KO mice than that in WT mice, suggesting increased ENaC-dependent sodium reabsorption in SPAK KO mice. Data represent the mean ± SEM. n = 5 animals. *P < 0.05 by 2-tailed t test, comparing the change in diuretic (B) and the change in natriuretic response (C) in WT versus KO mice.
Figure 6
Figure 6. NOTCH signaling is induced in SPAK KO mice.
(A) qPCR of NOTCH signaling molecules identified in the SPAK KO profile as upregulated (Jag1, Hes1, Irx1, Irx2) or downregulated genes (Jag2). Data represent the mean ± SEM. n = 6 animals. *P < 0.05 by 2-tailed t test for WT versus KO. (B) Western blot analysis of the NOTCH effector molecule HES1 and the NOTCH ligand JAG1 and (C) quantitative summary of relative HES and JAG1 protein abundance. Data represent the mean ± SEM. n = 4 animals. *P < 0.05 by 2-tailed t test for WT versus KO. (D) Immunolocalization of HES1 in WT and SPAK KO CNT (HES1, red; AQP2-labeled PCs, green; CNTs identified as calbindin+ tubules, not shown. Scale bars: 10 μm. Note: HES1 was almost exclusively expressed in PC nuclei. (E) Quantitative summary of HES1+ PCs and PP-ICs in the CNT (percentage of total subtype). Data represent the mean ± SEM. n = 4 animals per genotype. *P < 0.05 by 2-tailed t test for WT versus KO.
Figure 5
Figure 5. Cellular remodeling process replaces α-ICs with PP-ICs and expands CNT with PCs in SPAK KO mice.
(A) Immunolocalization of PP-ICs (pendrin, red) in the kidney cortex of WT and SPAK KO mice. Scale bars: 100 μm. (B) Relative number of IC subtypes (β- and non-α/non-β ICs [PP-ICs] and α-ICs [AE1+]) in the late DCT (DCT2), CNT, and CCD. For these studies, calbindin and AQP2 were used to identify nephron segments (calbindin alone = DCT2; calbindin plus AQP2 = CNT; AQP2 alone = CCD). Data represent the mean ± SEM. n = 4 animals per group. *P < 0.05 by 2-tailed t test for WT versus KO. (C) Quantitative summary of CNT cell subtype counts (numbers of PCs, α-ICs, and PP-ICs per unit area are plotted in the stacked diagram). (D) Morphometric length measurements of DCT1, DCT2, CNT, and CCD in WT and SPAK KO mice. Data represent the mean ± SEM. n = 5 animals per genotype. *P < 0.05 by 2-tailed t test for WT versus KO. (DCT, identified by the presence of parvalbumin and NCC; DCT2, identified as calbindin- and NCC-positive tubules; CNT, identified as calbindin- and AQP2-positive tubules; and CCD, identified as calbindin-negative, AQP2-positive tubules).
Figure 4
Figure 4. Pendrin translocates to the apical membrane in SPAK KO mice.
(A) Immunolocalization of pendrin (red) in typical CNTs of WT and SPAK KO mice. Scale bars: 10 μm. (B) Quantitative image analysis of pendrin. Pendrin pixel intensity was measured over a 6-μm distance from the tubule lumen into the cytoplasm at 0.4 μm–increment resolution. The bracketed area delineates the apical membrane. (C) Summary data of apical membrane–delimited pendrin abundance. Apical pendrin increased by 55% in SPAK KO mice compared with that in WT. Data represent the mean ± SEM. n = 5 animals per genotype with 50 or more cells from each animal. *P > 0.05 by 2-tailed t test for WT versus KO. (D) Cl absorption (JCl) was measured in isolated CCDs from WT and SPAK KO mice and perfused in vitro. Data represent the mean ± SEM. n = 4 animals per genotype. *P < 0.05 by 2-tailed t test for WT versus KO.
Figure 3
Figure 3. Increased abundance of PP-IC transport proteins in SPAK KO mice.
(A) Western blot and (B) summary quantification of pendrin, NDCBE, AE4, AE1, the B1 subunit of V-ATPase, and CA15 in WT versus SPAK KO mice. Data represent the mean ± SEM. n = 4 animals per group. *P < 0.05 by 2-tailed t test for WT versus KO. (C). Each of the upregulated molecules comprise elements of the electroneutral NaCl reabsorption system. Proposed transport model (see Discussion).
Figure 2
Figure 2. CNT/CCD transcript profile reveals induction of an IC transport pathway in SPAK KO mice.
(A) Heatmap of CNT/CCD-specific genes that are upregulated in SPAK KO mice. More than one-third of the upregulated genes were expressed in PP-ICs (highlighted in red), and the majority of these are involved in ion transport. qPCR survey of IC transcripts, including SLC-type transporter family members (B), V-ATPase subunits (C), and carbonic anhydrase (CA) genes (D), confirmed the results of microarray and identified several other IC genes as being differentially expressed in SPAK KO mice. Data represent the mean ± SEM. n = 6 animals per genotype. *P < 0.05 by 2-tailed t test for WT versus KO.
Figure 1
Figure 1. SPAK KO transcript profile.
(A) Heatmap rendering of the transcript expression profile of SPAK KO and WT mice (n = 4 mice per group). Differentially expressed genes in kidney cortex are shown. Each individual block represents the relative transcript level of an individual gene. Genes are arranged by row according to the FDR (from high [top] to low [bottom], with a lower-limit FDR <0.05). Each column represents the profile of an individual mouse. (B) GO classification of genes by biological function revealed that the SPAK KO profile was significantly enriched in 5 major functional classes. Level of significance (–log of the P value) is plotted for each significant GO term. Individual GO terms are arranged according to major functional class. (C) Number of SPAK-upregulated (red) and -downregulated (green) profile genes that were exclusively expressed in individual nephron segments. Glom, glomerulus; cTAL, cortical TAL.

Comment in

Similar articles

Cited by

References

    1. Gamba G. The thiazide-sensitive Na+-Cl– cotransporter: molecular biology, functional properties, and regulation by WNKs. Am J Physiol Renal Physiol. 2009;297(4):F838–F848. doi: 10.1152/ajprenal.00159.2009. - DOI - PMC - PubMed
    1. Gamba G, et al. Primary structure and functional expression of a cDNA encoding the thiazide-sensitive, electroneutral sodium-chloride cotransporter. Proc Natl Acad Sci U S A. 1993;90(7):2749–2753. doi: 10.1073/pnas.90.7.2749. - DOI - PMC - PubMed
    1. Schultheis PJ, et al. Phenotype resembling Gitelman’s syndrome in mice lacking the apical Na+-Cl– cotransporter of the distal convoluted tubule. J Biol Chem. 1998;273(44):29150–29155. doi: 10.1074/jbc.273.44.29150. - DOI - PubMed
    1. Kunau RT, Jr, Weller DR, Webb HL. Clarification of the site of action of chlorothiazide in the rat nephron. J Clin Invest. 1975;56(2):401–407. doi: 10.1172/JCI108105. - DOI - PMC - PubMed
    1. Ellison DH, Velazquez H, Wright FS. Thiazide-sensitive sodium chloride cotransport in early distal tubule. Am J Physiol. 1987;253(3 pt 2):F546–F554. - PubMed

Publication types

MeSH terms