. 2015 May;125(5):2090-108.
doi: 10.1172/JCI77746. Epub 2015 Apr 20.

mTORC1 and mTORC2 selectively regulate CD8⁺ T cell differentiation

mTORC1 and mTORC2 selectively regulate CD8⁺ T cell differentiation

Kristen N Pollizzi et al. J Clin Invest. 2015 May.

Abstract

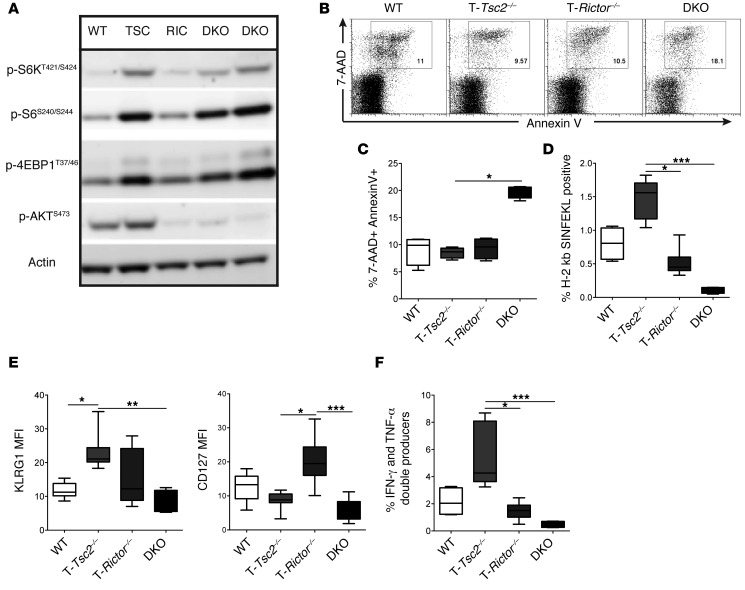
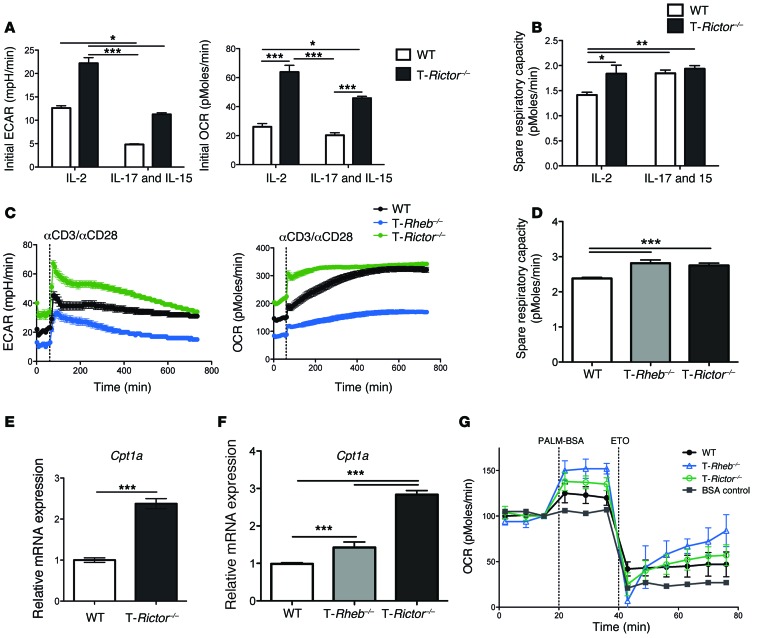
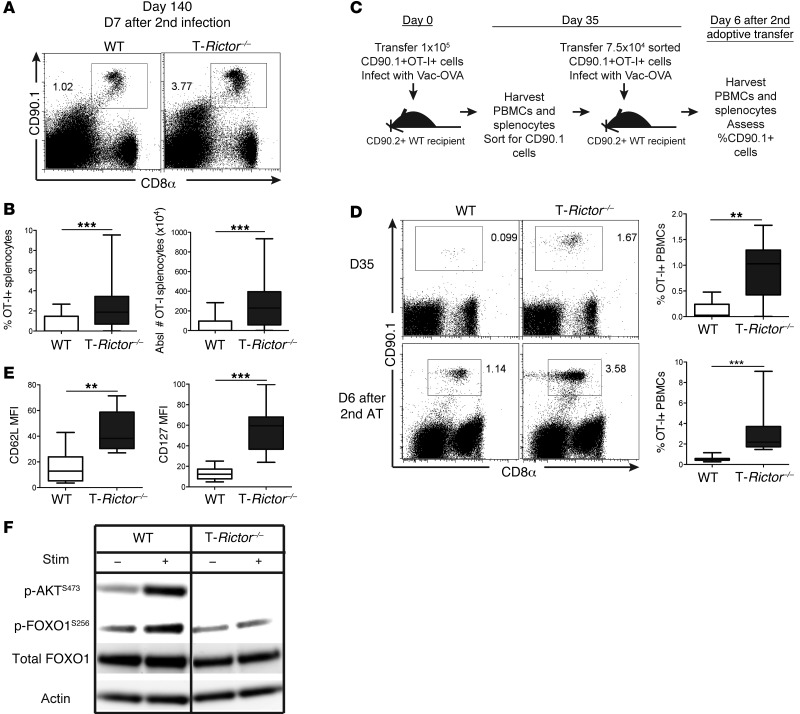
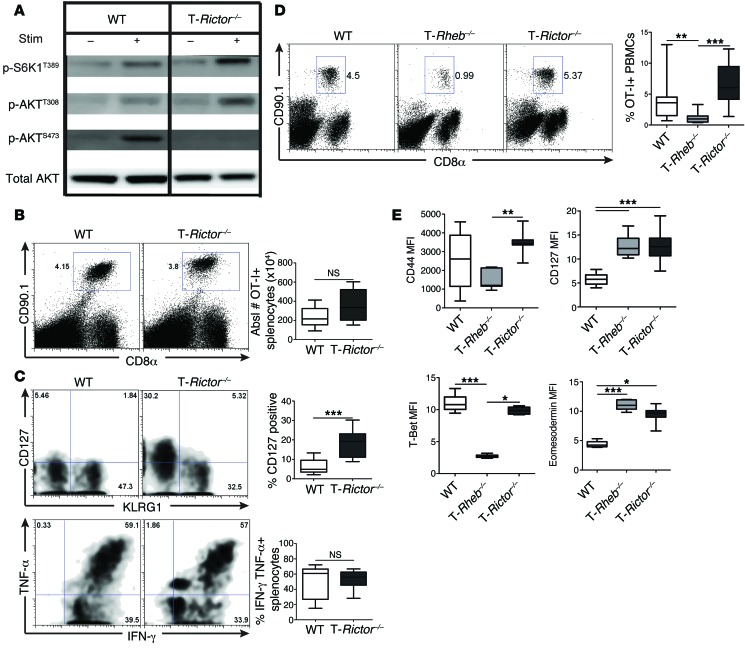
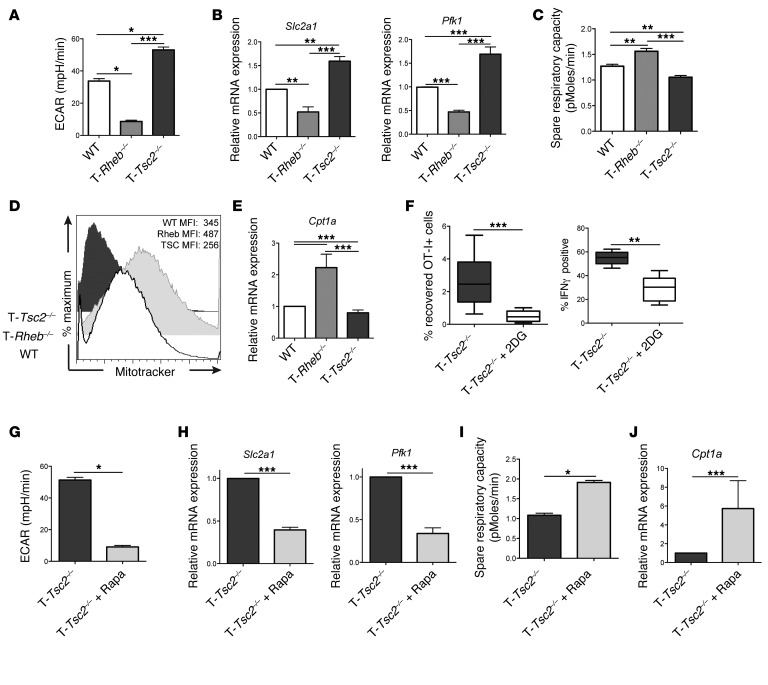
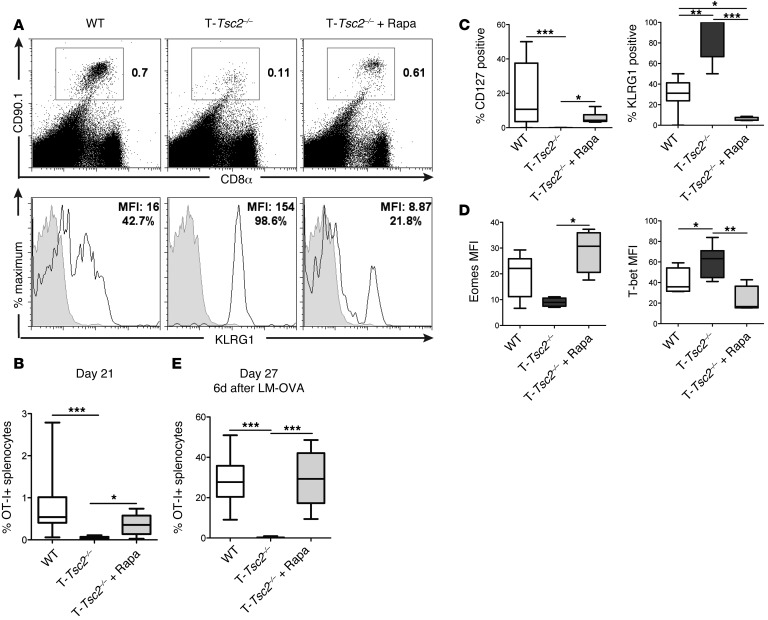
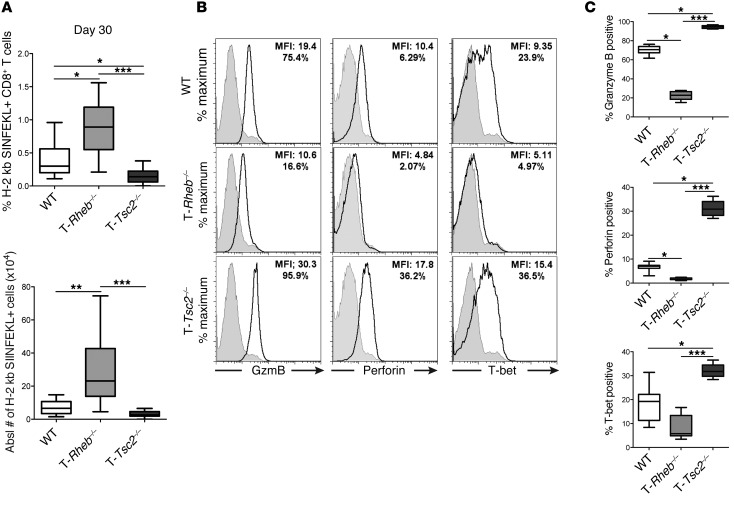
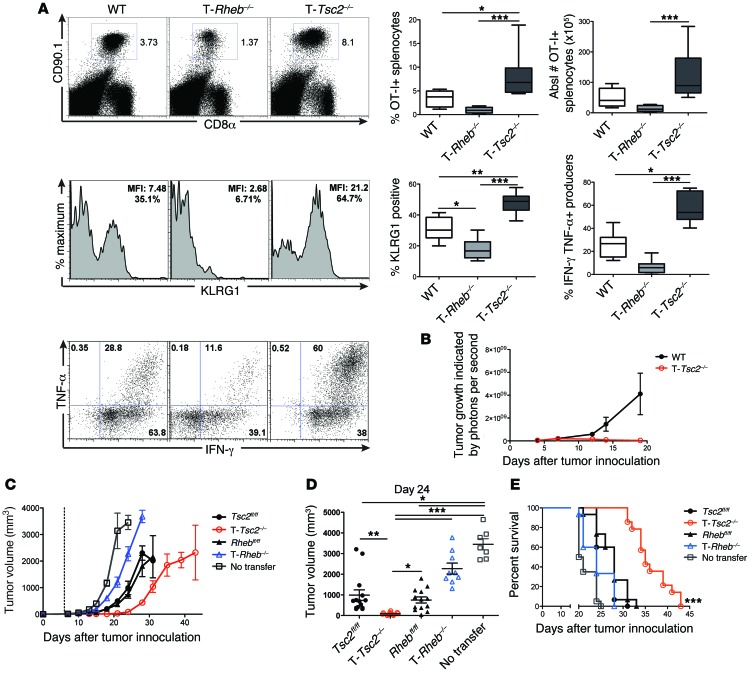
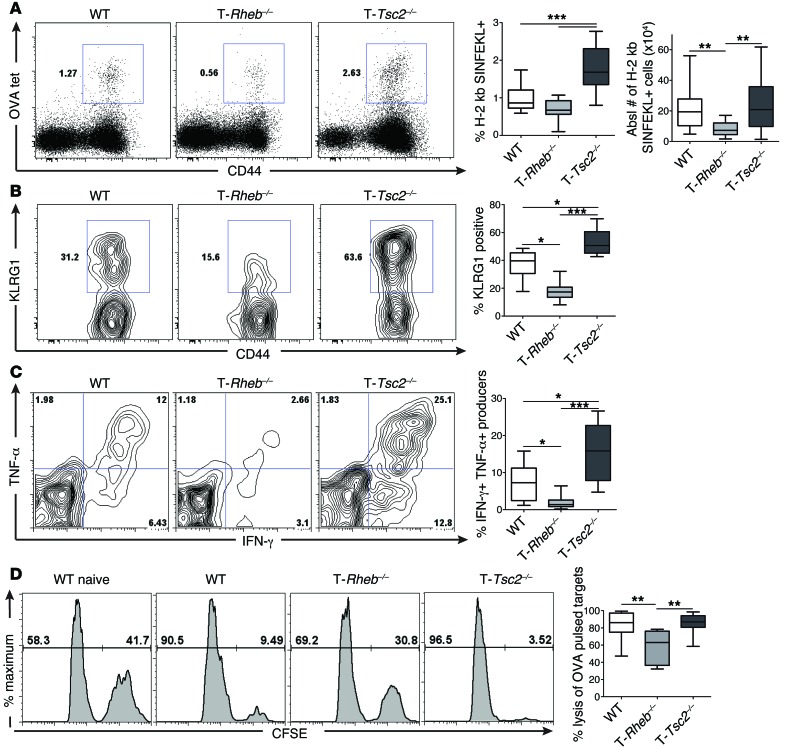
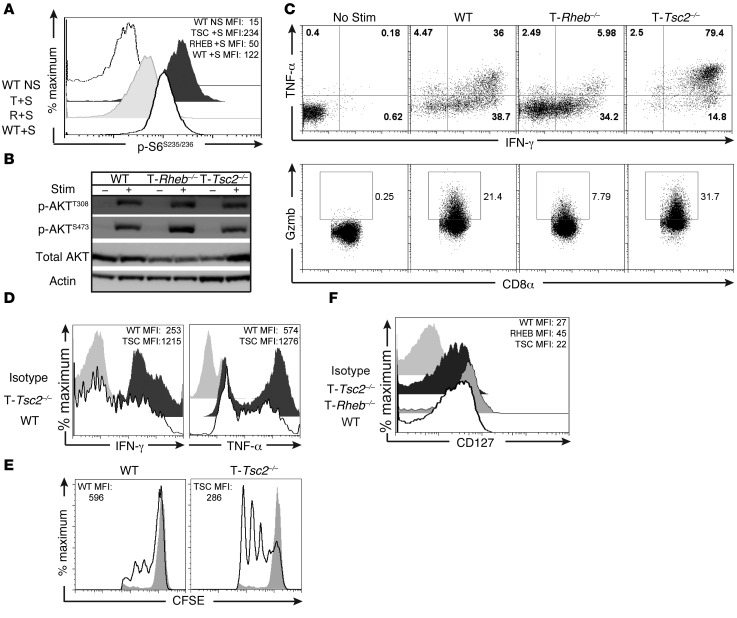
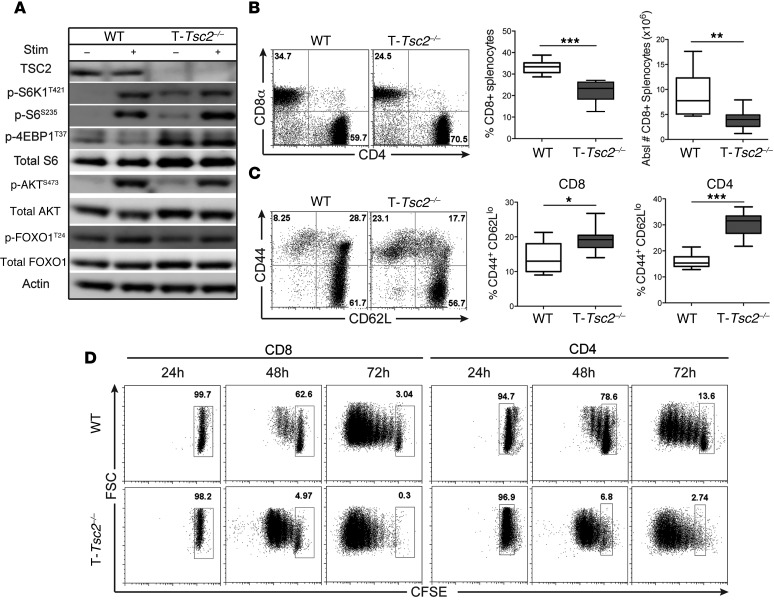
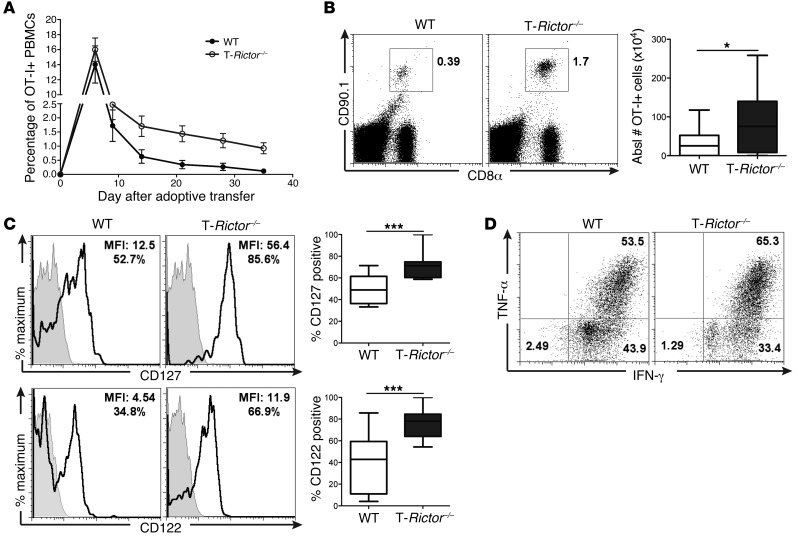
Activation of mTOR-dependent pathways regulates the specification and differentiation of CD4+ T effector cell subsets. Herein, we show that mTOR complex 1 (mTORC1) and mTORC2 have distinct roles in the generation of CD8+ T cell effector and memory populations. Evaluation of mice with a T cell-specific deletion of the gene encoding the negative regulator of mTORC1, tuberous sclerosis complex 2 (TSC2), resulted in the generation of highly glycolytic and potent effector CD8+ T cells; however, due to constitutive mTORC1 activation, these cells retained a terminally differentiated effector phenotype and were incapable of transitioning into a memory state. In contrast, CD8+ T cells deficient in mTORC1 activity due to loss of RAS homolog enriched in brain (RHEB) failed to differentiate into effector cells but retained memory characteristics, such as surface marker expression, a lower metabolic rate, and increased longevity. However, these RHEB-deficient memory-like T cells failed to generate recall responses as the result of metabolic defects. While mTORC1 influenced CD8+ T cell effector responses, mTORC2 activity regulated CD8+ T cell memory. mTORC2 inhibition resulted in metabolic reprogramming, which enhanced the generation of CD8+ memory cells. Overall, these results define specific roles for mTORC1 and mTORC2 that link metabolism and CD8+ T cell effector and memory generation and suggest that these functions have the potential to be targeted for enhancing vaccine efficacy and antitumor immunity.


Figures

Figure 12
Figure 12. Inhibition of mTORC2 in the presence of hyperactive mTORC1 leads to enhanced cellular death.
(A) Purified CD8+ T cells from WT, T-Tsc2–/–, T-Rictor–/–, and DKO mice were stimulated in vitro for 1 hour, and mTORC1 and mTORC2 activity was assessed by immunoblot. (B) Splenocytes from WT, T-Tsc2–/–, T-Rictor–/–, and DKO mice were stimulated in vitro for 24 hours prior to analysis of CD8+ T cell death by 7-AAD and annexin V staining. (C) Statistics for B (n = 4). (DF) Mice of each genotype were infected with vaccinia-OVA. Six days later, (D) the percentage of antigen-specific CD44+CD8+ splenocytes and (E) surface marker expression of the antigen-specific CD8+ T cells were determined. (F) Cytokine production was assessed after ex vivo stimulation of splenocytes gated from CD44+CD8+ cells (n = 6). Data are representative of 3 independent experiments. For the box-and-whiskers plots, the whiskers represent the minimum and maximum values, the box boundaries represent the 25th and 75th percentiles, and the middle line is the median value. *P < 0.05, **P < 0.01, ***P < 0.001, ANOVA.
Figure 11
Figure 11. mTORC2 inhibition leads to enhanced metabolic fitness.
Purified CD8+ T cells from WT or T-Rictor–/– mice were stimulated in vitro for 48 hours and expanded for 3 days. (A) Initial ECAR, initial OCR, and (B) SRC were determined. Data are mean ± SEM of 7 measurements. (C) WT, T-Rheb–/–, and T-Rictor–/– CD8+ T cells were stimulated in vitro and cultured in IL-7 and IL-15 for 3 days. Cells were plated at equivalent cell number, and ECAR and OCR measurements were assayed upon stimulation in the Seahorse bioanalyzer. Data are mean ± SEM of 12 measurements. (D) SRC was determined after restimulation of WT, T-Rheb–/–, and T-Rictor–/– CD8+ T cells expanded in IL-7 and IL-15. Data are mean ± SEM of 10 measurements. Relative expression of Cpt1a transcript was determined from (E) stimulated cells expanded in IL-7 and IL-15 for 3 days (mean ± SEM of 3 measurements) or from (F) sorted WT, T-Rheb–/–, and T-Rictor–/– OT-I+ cells recovered 6 days after adoptive transfer into recipients infected with vaccinia-OVA (n = 3 mice per genotype). (G) OCR measurements of restimulated WT, T-Rheb–/–, and T-Rictor–/–CD8+ T cells during a FAO assay. BSA control shown in gray. Data are mean ± SEM of 4 measurements. Statistics in A, B, D, and F were determined by ANOVA; those in C were measured by repeated-measures analysis; and those in E were measured by Mann-Whitney t test. Data are representative of at least 3 independent experiments. For the box-and-whiskers plots, the whiskers represent the minimum and maximum values, the box boundaries represent the 25th and 75th percentiles, and the middle line is the median value. *P < 0.05, **P < 0.01, ***P < 0.001.
Figure 10
Figure 10. mTORC2 inhibition promotes memory generation.
(AE) 1.5 × 10⁵ naive sorted OT-I+ T cells were transferred into WT CD90.2+ recipients infected with vaccinia-OVA. (A and B) Mice were given secondary infection of lm-OVA 133 days after initial infection, and 7 days later, the percentage and absolute number of recovered OT-I+ splenocytes was determined (n = 20). (C) Experimental schematic for D. (D) Flow cytometric analysis of the percentage of OT-I+ cells recovered from blood 35 days after primary infection, with statistics shown on the right (n = 9) (top). OT-I+ cells were purified after harvest on day 35, transferred into new recipients infected with vaccinia-OVA, and 6 days later, percentage of OT-I+ PBMCs was determined (labeled as “D6 after 2nd AT”), with statistics shown to the right (n = 7) (bottom). (E) CD62L and CD127 expression of recovered OT-I+ splenocytes 35 days after primary infection (n = 9). (F) p-FOXO1 protein expression was detected from in vitro–stimulated and IL-7– and IL-15–expanded CD8+ T cells with or without restimulation. Data are representative of at least 3 independent experiments. For the box-and-whiskers plots, the whiskers represent the minimum and maximum values, the box boundaries represent the 25th and 75th percentiles, and the middle line is the median value. **P < 0.01, ***P < 0.001, Mann-Whitney t tests.
Figure 8
Figure 8. mTORC2 activity is not required for CD8+ T cell effector function.
(A) Purified CD8+ T cells were collected from 6-week-old WT or T-Rictor–/– mice. mTORC1 and mTORC2 activity was assessed by immunoblot analysis from unstimulated cells or after 1-hour stimulation with αCD3/αCD28. (B and C) WT and T-Rictor–/– OT-I+CD8+CD90.1+ cells were adoptively transferred into WT CD90.2+ recipients infected with vaccinia-OVA. Six days after infection, splenocytes were harvested. (B) The percentage of OT-I+ splenocytes was determined. The graph depicts the absolute number of OT-I+ splenocytes (n = 12). (C) Surface staining of OT-I+ splenocytes 6 days after infection, with the percentage of recovered OT-I+ cells expressing CD127 (n = 12) (top). Cytokine production of OT-I+ splenocytes after SIINFEKL stimulation, with statistics shown to the right (n = 12) (bottom). (D and E) 1.5 × 10⁵ naive sorted WT, T-Rheb–/–, and T-Rictor–/– OT-I+CD90.1+ T cells were adoptively transferred into WT CD90.2+ recipients infected with vaccinia-OVA. (D) The percentage of recovered OT-I+ T cells was determined from blood 6 days after infection, with statistics shown to the right (n = 15). (E) Surface marker and transcription factor expression were assessed from recovered OT-I+ splenocytes (n = 9). For the box-and-whiskers plots, the whiskers represent the minimum and maximum values, the box boundaries represent the 25th and 75th percentiles, and the middle line is the median value. Statistics for B and C were determined by Mann-Whitney t tests, while those for D and E were measured by ANOVA. Data are representative of 3 independent experiments. *P < 0.05, **P < 0.01, ***P < 0.001.
Figure 7
Figure 7. mTORC1 activity influences CD8+ T cell metabolism upon TCR stimulation.
(AE) Purified CD8+ T cells from WT, T-Rheb–/–, and T-Tsc2–/– mice were stimulated in vitro for 48 hours and cultured in IL-7 and IL-15 for 3 days. (A) Cells were run on an extracellular flux analyzer, and ECAR was determined. Data are mean ± SEM of 7 measurements. (B) RNA was extracted and relative expression of GLUT1 (Slc2a1) and Pfk1 transcripts was determined by qPCR. (C) As in A, SRC was determined. (D) MitoTracker Green staining was assessed by flow cytometry. (E) As in B, Cpt1a expression was measured. (F) T-Tsc2–/– OT-I+ T cells were transferred into congenically distinct recipients infected with vaccinia-OVA. A cohort of mice received 2DG daily. On day 6, splenocytes were harvested and the percentage of OT-I+ cells (n = 9) and percentage of IFN-γ–positive OT-I+ cells was determined after SIINFEKL stimulation (n = 5). For the box-and-whiskers plots, the whiskers represent the minimum and maximum values, the box boundaries represent the 25th and 75th percentiles, and the middle line is the median value. (GJ) Purified T-Tsc2–/–CD8+ T cells were stimulated in vitro for 48 hours with or without 0.5 μM rapamycin. Cells were expanded in media supplemented with IL-7 and IL-15 with or without 0.5 μM rapamycin for 3 days. (G) As in A, ECAR was measured. Data are mean ± SEM of 4 measurements. (H) As in B, relative expression of Slc2a1 and Pfk1 transcript was detected. (I) As in G, SRC was determined, and (J) relative expression of Cpt1a transcript was measured. Statistics for AE were determined by ANOVA and those for FJ were measured by Mann-Whitney t tests. Data are representative of 3 independent experiments. *P < 0.05, **P < 0.01, ***P < 0.001
Figure 6
Figure 6. Rapamycin treatment can rescue the terminal effector differentiation of T-Tsc2–/– CD8+ T cells.
WT and T-Tsc2–/–OT-I+CD8+CD90.1+ T cells were adoptively transferred into WT CD90.2+ recipients infected with vaccinia-OVA. A cohort of mice that received T-Tsc2–/– cells was treated with rapamycin. (A) FACS plots depict the percentage of splenic CD8+CD90.1+ (OT-I+) cells 21 days after infection (top). KLRG1 expression of gated CD90.1+ cells (bottom). Gray histogram depicts isotype control. (B) The percentage of recovered OT-I+ splenocytes 21 days after infection (n = 8). (C and D) Phenotypic analysis of recovered OT-I+ splenocytes demonstrating (C) changes in surface marker expression and (D) transcription factor expression between genotypes with or without rapamycin treatment (n = 8). (E) Recipient mice were infected with lm-OVA on day 21 after transfer. Six days after secondary infection with lm-OVA (day 27), splenocytes were harvested and the percentage of OT-I+ splenocytes was determined (n = 14). Data are representative of 3 independent experiments. For the box-and-whiskers plots, the whiskers represent the minimum and maximum values, the box boundaries represent the 25th and 75th percentiles, and the middle line is the median value. *P < 0.05, **P < 0.01, ***P < 0.001, ANOVA. Eomes, eomesodermin.
Figure 5
Figure 5. TSC2 inhibition results in terminally differentiated effector cells.
WT, T-Rheb–/–, and T-Tsc2–/– mice were infected with vaccinia-OVA. Thirty days after infection splenocytes were harvested and (A) percentage and absolute number of antigen-specific splenocytes were determined by H-2 kb/SIINFEKL staining of CD44+CD8+ cells (n = 15). For the box-and-whiskers plots, the whiskers represent the minimum and maximum values, the box boundaries represent the 25th and 75th percentiles, and the middle line is the median value. (B) Splenocytes from day 30 infected mice were stimulated with SIINFEKL peptide, and cytolytic and T-bet protein expression were measured. Plots are gated from the CD8+ population. Shaded histograms show isotype controls. (C) Statistics for B (n = 9). Data are representative of at least 3 independent experiments. *P < 0.05, **P < 0.01, ***P < 0.001, ANOVA.
Figure 4
Figure 4. The ability of hyperactive mTORC1 signaling to promote effector function is cell intrinsic.
(A) OT-I+CD90.1+CD8+ T cells from WT, T-Rheb–/–, and T-Tsc2–/– mice were adoptively transferred into WT CD90.2+ recipient mice infected with vaccinia-OVA. Six days after infection, splenocytes were harvested. The percentage of splenic CD8+ CD90.1+ T cells, KLRG1 expression of CD8+CD90.1+ cells, and IFN-γ and TNF-α production after SIINFEKL peptide stimulation are shown, with statistics to the right (n = 10). For the box-and-whiskers plots, the whiskers represent the minimum and maximum values, the box boundaries represent the 25th and 75th percentiles, and the middle line is the median value. (B) WT and T-Tsc2–/– mice received s.q. EL4 thymoma cells expressing luciferase. Tumor burden was assessed by detection of luminescence (n = 16). (CE) In vitro–activated T-Rheb–/– and T-Tsc2–/– and littermate control OT-I+CD8+ T cells were injected into WT recipients that had received B16-OVA cells 6 days prior (dashed line represents T cell transfer). “No transfer” indicates that mice did not receive OT-I+ cells. (C) Tumor volume was assessed every 2 to 3 days. Each symbol represents an average per genotype (n = 15). (D) Tumor volume shown at day 24 after tumor inoculation. Each dot represents a mouse. Data are derived from C. (E) Survival was assessed. Mice that received T-Tsc2–/– cells had enhanced survival compared with all other treatments, as determined by multiple comparisons Mantel-Cox tests. Statistics in A and D were determined by ANOVA and for B and C were determined by repeated-measures analysis. Data are representative of at least 3 independent experiments. *P < 0.05, **P < 0.01, ***P < 0.001
Figure 3
Figure 3. mTORC1 activity is required for effector generation in vivo.
WT, T-Rheb–/–, and T-Tsc2–/– mice were infected with 1 × 10⁶ PFU vaccinia-OVA. On day 6, splenocytes were harvested. (A) Percentage of antigen-specific CD8+ T cells from day 6 infected mice was determined by flow cytometric analysis of H-2 kb/SIINFEKL tetramer staining (OVA tet). Plots were gated from the CD8+ population. Graphs depict the percentage of tetramer+ cells from the CD8+ population and the absolute number of tetramer+ cells (n = 16). (B) KLRG1 expression was assessed from the tetramer+ population, with statistics shown to the right (n = 16). (C) Cytokine production was assessed from the CD44+CD8+ splenic populations after ex vivo stimulation with SIINFEKL peptide. The graph depicts the percentage of double-producing cells (n = 16). (D) Functional analysis of CD8+ T cells by an in vivo CTL assay 6 days after vaccinia-OVA infection. Plots depict CFSEhi SIINFEKL peptide–pulsed targets and CFSElo control targets recovered from splenocytes harvested 10 hours after target transfer, with statistics shown to the right (n = 18). Data are representative of at least 3 independent experiments. For the box-and-whiskers plots, the whiskers represent the minimum and maximum values, the box boundaries represent the 25th and 75th percentiles, and the middle line is the median value. *P < 0.05, **P < 0.01, ***P < 0.001, ANOVA.
Figure 2
Figure 2. mTORC1 activity is required to promote CD8+ effector T cell responses in vitro.
(A) mTORC1 activity was assessed by flow cytometric analysis of phosphorylated S6S235/236 expression from WT, T-Tsc2–/–, and T-Rheb–/– purified CD8+ T cells stimulated (+S) for 48 hours with αCD3/αCD28 compared with unstimulated WT controls (WT NS). The mean fluorescence intensity (MFI) for each genotype is shown in the upper corner. (B) Purified CD8+ T cells were collected from WT, T-Rheb–/–, or T-Tsc2–/– mice. mTORC2 activity was assessed by immunoblot analysis from unstimulated cells or after 1.5-hour stimulation with αCD3/αCD28. (C) Splenocytes were stimulated in vitro with αCD3 for 48 hours and then expanded in media supplemented with IL-2 for 5 days. On day 5, cells were restimulated and intracellular production of IFN-γ, TNF-α, and granzyme B (GzmB) was measured by flow cytometry. Plots are gated from the CD8+ population. (D) Cytokine production and (E) CFSE dilution were determined from purified naive CD8+ WT and T-Tsc2–/– CD8+ T cells stimulated in vitro. Plots were gated from the CD8+ population. CFSE expression was measured 48 hours after stimulation. Nonstimulated controls shown as gray histograms. (F) As in C, CD127 expression of the CD8+ population was assessed by flow cytometry prior to restimulation. Data are representative of at least 3 independent experiments.
Figure 1
Figure 1. Tsc2 deletion in CD8+ T cells yields a hyperactivated phenotype.
WT and T-Tsc2–/– splenocytes were harvested from 6-week-old mice. (A) mTORC1 and mTORC2 activity was assessed by immunoblot analysis from isolated CD8+ T cells left unstimulated or after 3-hour αCD3/αCD28 stimulation. (B) Flow cytometric analysis of CD4 and CD8 expression gated from CD3+ cells and the mean percentage and absolute number of CD8+ T cells (n = 9). (C) Flow cytometric analysis of CD44 and CD62L expression gated from the CD8+ population, with statistics shown to the right for both CD8+ and CD4+ T cells (n = 9). (D) CFSE-labeled splenocytes from WT and T-Tsc2–/– mice were stimulated with αCD3. CFSE dilution of CD8+ and CD4+ T cell populations was determined following 24, 48, and 72 hours of stimulation. Data are representative of at least 3 independent experiments. For the box-and-whiskers plots, the whiskers represent the minimum and maximum values, the box boundaries represent the 25th and 75th percentiles, and the middle line is the median value. *P < 0.05, **P < 0.01, ***P < 0.001, Mann-Whitney t tests.
Figure 9
Figure 9. mTORC2 inhibition does not hinder CD8+ T cell acute effector function.
(A) 1.5 × 10⁵ naive sorted WT and T-Rictor–/– OT-I+CD8+CD90.1+ T cells were adoptively transferred into WT recipients infected with vaccinia-OVA, and the percentage of OT-I+ cells was monitored in the blood. The two groups are statistically significant during the memory phase, as assessed by repeated-measures analysis (see Statistics) (n = 9). (BD) WT and T-Rictor–/– OT-I+CD8+CD90.1+ cells were adoptively transferred into WT recipients infected with vaccinia-OVA, and the number and phenotype of OT-I+ splenocytes were assessed 26 days after adoptive transfer and infection. (B) The percentage and absolute number of recovered OT-I+ splenocytes, and (C) surface marker expression of OT-I+ splenocytes was determined by flow cytometry. MFI and the percentage of antigen-specific cells expressing CD127 or CD122 are shown in plots. Gray histograms depict isotype controls (n = 12). (D) 26 days after infection, mice were given a secondary infection with lm-OVA, and 6 days later cytokine production of OT-I+ splenocytes was determined. For the box-and-whiskers plots, the whiskers represent the minimum and maximum values, the box boundaries represent the 25th and 75th percentiles, and the middle line is the median value. Statistics in A were determined by repeated-measures analysis and those in B and C were measured by Mann-Whitney t tests. Data are representative of at least 3 independent experiments. *P < 0.05, ***P < 0.001.

Similar articles

Cited by

References

    1. Kaech SM, Cui W. Transcriptional control of effector and memory CD8+ T cell differentiation. Nat Rev Immunol. 2012;12(11):749–761. doi: 10.1038/nri3307. - DOI - PMC - PubMed
    1. Williams MA, Bevan MJ. Effector and memory CTL differentiation. Annu Rev Immunol. 2007;25:171–192. doi: 10.1146/annurev.immunol.25.022106.141548. - DOI - PubMed
    1. Frauwirth KA, et al. The CD28 signaling pathway regulates glucose metabolism. Immunity. 2002;16(6):769–777. doi: 10.1016/S1074-7613(02)00323-0. - DOI - PubMed
    1. Jones RG, Thompson CB. Revving the engine: signal transduction fuels T cell activation. Immunity. 2007;27(2):173–178. doi: 10.1016/j.immuni.2007.07.008. - DOI - PubMed
    1. Gerriets VA, Rathmell JC. Metabolic pathways in T cell fate and function. Trends Immunol. 2012;33(4):168–173. doi: 10.1016/j.it.2012.01.010. - DOI - PMC - PubMed

Publication types

MeSH terms

Substances