. 2015 May;17(5):569-79.
doi: 10.1038/ncb3156. Epub 2015 Apr 20.

Anisotropic stress orients remodelling of mammalian limb bud ectoderm

Affiliations

Anisotropic stress orients remodelling of mammalian limb bud ectoderm

Kimberly Lau et al. Nat Cell Biol. 2015 May.

Abstract

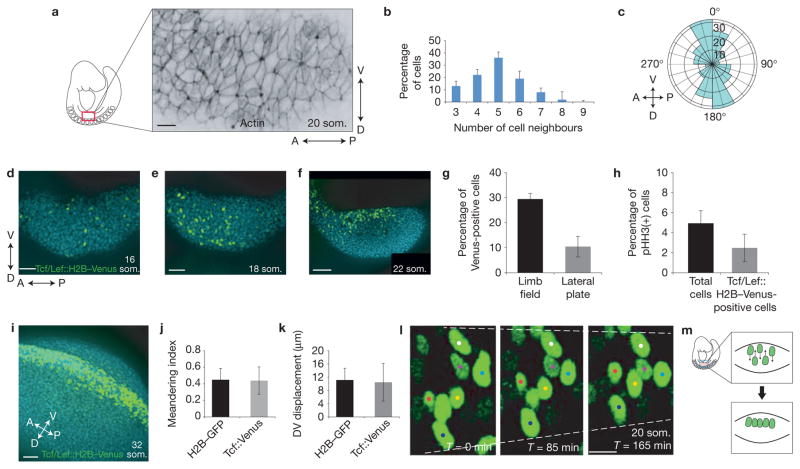
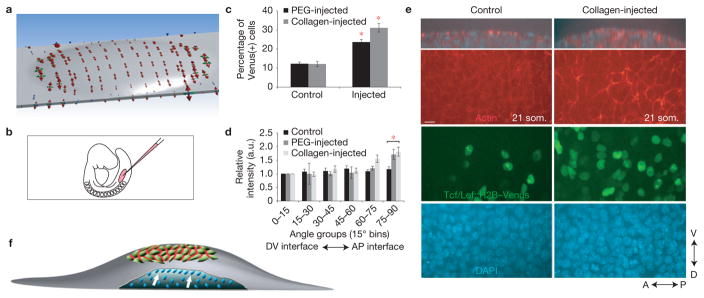
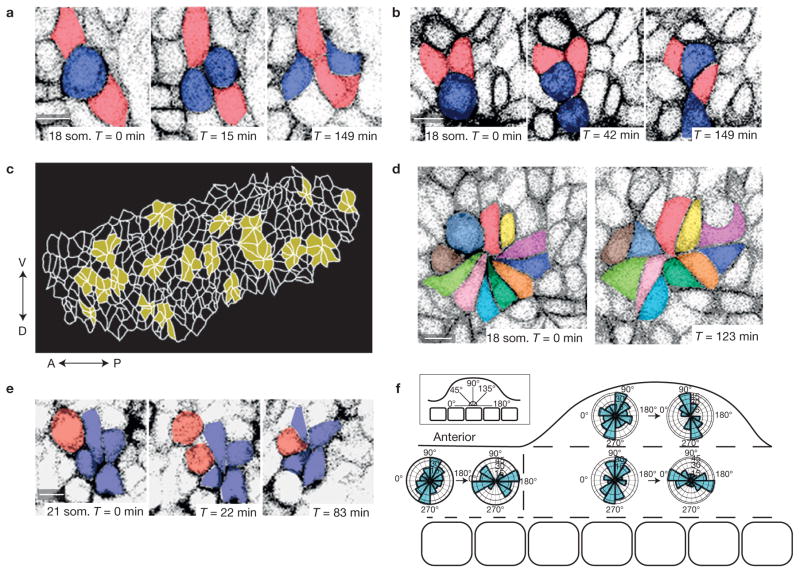
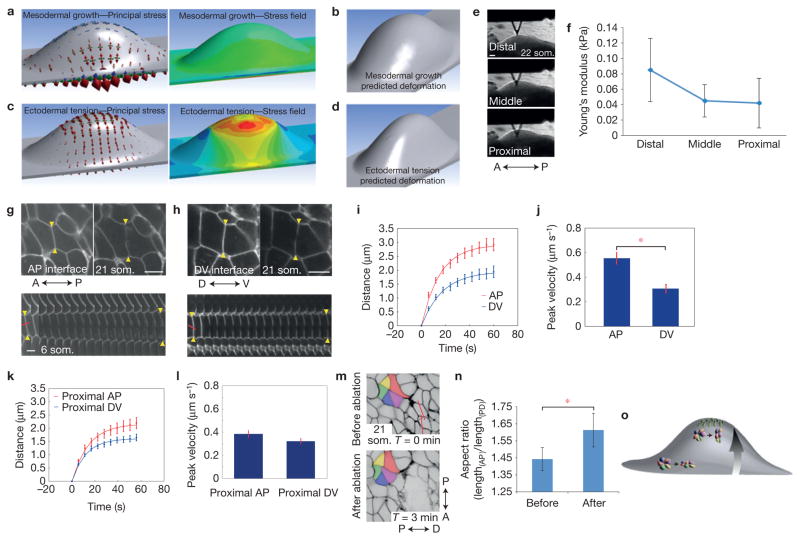
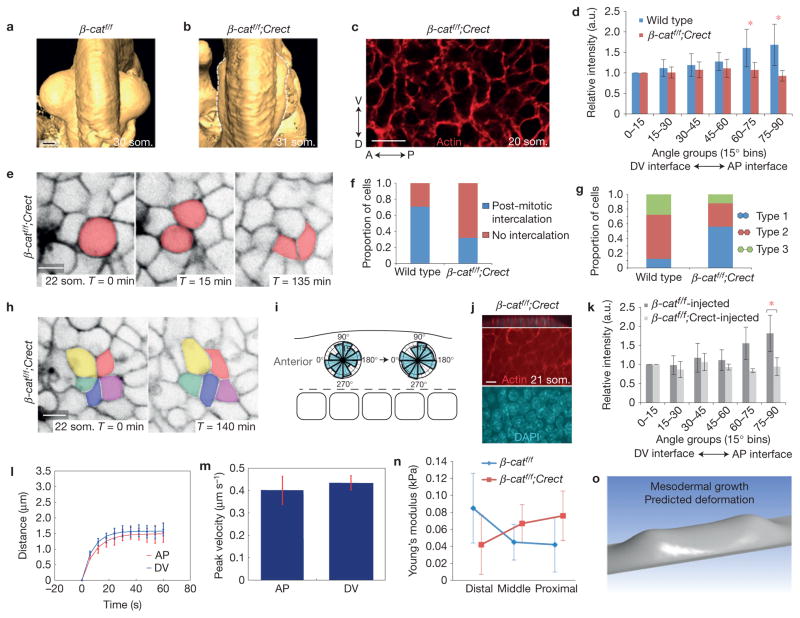
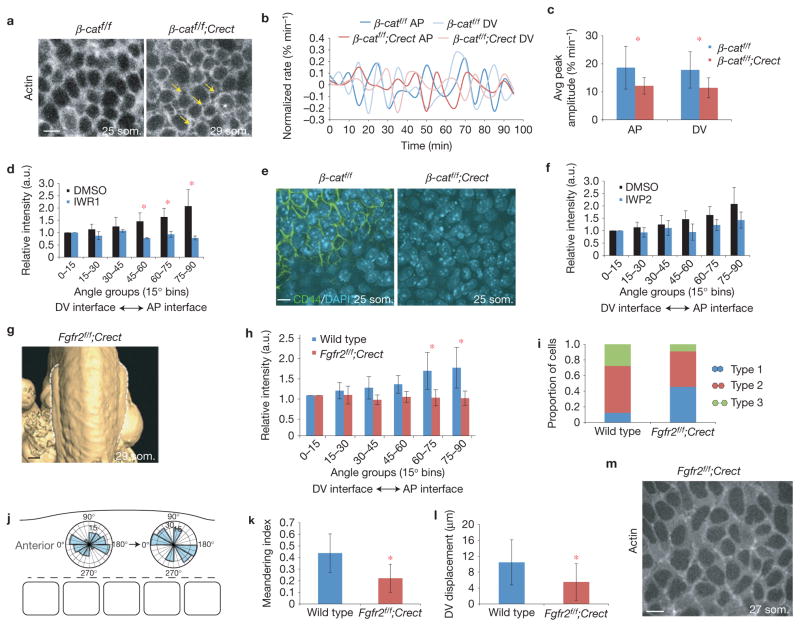
The physical forces that drive morphogenesis are not well characterized in vivo, especially among vertebrates. In the early limb bud, dorsal and ventral ectoderm converge to form the apical ectodermal ridge (AER), although the underlying mechanisms are unclear. By live imaging mouse embryos, we show that prospective AER progenitors intercalate at the dorsoventral boundary and that ectoderm remodels by concomitant cell division and neighbour exchange. Mesodermal expansion and ectodermal tension together generate a dorsoventrally biased stress pattern that orients ectodermal remodelling. Polarized distribution of cortical actin reflects this stress pattern in a β-catenin- and Fgfr2-dependent manner. Intercalation of AER progenitors generates a tensile gradient that reorients resolution of multicellular rosettes on adjacent surfaces, a process facilitated by β-catenin-dependent attachment of cortex to membrane. Therefore, feedback between tissue stress pattern and cell intercalations remodels mammalian ectoderm.


Conflict of interest statement

COMPETING FINANCIAL INTERESTS

The authors declare no competing financial interests.

Figures

Figure 1
Figure 1
Cell topology and intercalation of AER progenitors. (a) Confocal section of rhodamine–phalloidin-stained pre-AER (20 som.) entire limb field (from somite 7 to 11, ~250 ectodermal cells) demonstrating variable and non-hexagonal cell topologies as well as DV elongation of some ectodermal cells (quantified in Supplementary Figs 4 and 5). (b) Distribution of number of cell neighbours among 18–20 som. limb bud ectodermal cells. (c) Polar plot representing metaphase-to-telophase transition angles of limb bud ectoderm cells (n = 3, 35–40 cell divisions (all cell divisions/2 h time-lapse video) per 18–20 som. embryo). (df) Confocal projection of the ectodermal Tcf/Lef::H2B–Venus reporter in pre-overt initiation limb field (16 som.; d), early initiating limb field (18 som.; e), and post-initiation limb field (22 som.; f) (blue: DAPI). (g) Percentage of Tcf/Lef::H2B–Venus-positive cells in the limb field versus lateral plate in 18–20 som. embryos (n = 3 embryos; P = 0.0022 (Student’s t-test)). (h) Percentage of pHH3-positive cells relative to total cells versus percentage of pHH3-positive cells relative to Tcf/Lef::H2B–Venus-positive cells in the limb field in 18–20 som. embryos (n = 3 embryos; P = 0.26 (Student’s t-test)). (i) Confocal projection of the ectodermal Tcf/Lef::H2B–Venus reporter in an AER-forming limb bud (32 som.). (j,k) Meandering index (j) and DV displacement (k) among ubiquitously expressed H2B–GFP (representing total cells) versus Tcf/Lef::H2B–Venus (representing AER progenitors) cells in 18–20 som. embryos (n = 20 cells in 3 embryos for each condition; (j) P = 0.86, (k) P = 0.74 (Student’s t-test)). (l) Time-lapse series of a 20 som. limb bud ectoderm expressing Tcf/Lef::H2B–Venus near the DV boundary. Dashed lines highlight regional tissue constriction. (m) Model of AER progenitor intercalation just ventral to the DV boundary (red line). Scale bars indicate 10 μm (a,l), 50 μm (d,e,i), 100 μm (f). Error bars indicate s.e.m.
Figure 2
Figure 2
Planar polarity of pre-AER ectodermal cells. (a) Confocal xz (top) and xy (middle and bottom) sections of rhodamine–phalloidin-stained 20 som. limb bud ectoderm highlight the basal region where actin was polarized. (b) Relative fluorescence intensity of actin at cell interfaces was analysed using SIESTA software and plotted from 0–90° representing DV to AP interfaces of 18–20 som. embryos (P = 0.03 (total interfaces) and P = 0.05 (Tcf + ve interfaces) (Student’s t-test)). Shown are total cell interfaces versus Tcf/Lef::H2B–Venus-positive cell interfaces (n = 5 embryos for each condition; comparison of total interfaces versus Tcf/Lef::H2B–Venus-positive cell interfaces P > 0.05 for all angle bins (Student’s t-test)). (c,d) Confocal image of the basal layer of the nascent AER (between dashed lines) at 25 som. (c) and 34 som. (d) showing actin (red) and Tcf/Lef::H2B–Venus (green; c) or AER marker CD44 (green; d; ref. 55). (e) Confocal section of a 22 som. limb bud expressing myr–Venus. Dashed lines indicate limb bud area. The outlined area is shown magnified in the middle and right panels. Shown are apical and basal sections of the same region. White arrowheads indicate membrane protrusions. (f) Confocal time series of a 22 som. limb bud expressing myr–Venus, showing protrusive activity along the DV axis (indicated by yellow arrowheads). Intercalation is observed between two cells marked with white asterisks. Scale bars indicate 50 μm (e), 20 μm (a,ce (magnifications)), 10 μm (f). Error bars indicate s.e.m. Asterisks indicate P < 0.05 (75–90° bin versus 0–15° bin).
Figure 3
Figure 3
Mesodermal growth anisotropically stresses ectoderm during limb initiation. (a) Finite-element simulated principal stresses that are attributable to mesodermal growth at limb initiation (17 som.). Red, green and blue arrows indicate maximum, middle and minimum principal stresses respectively. Tension is biased along the DV axis. (b) Illustration indicating flank micro-injection in non-limb lateral plate mesoderm. (c) Proportion of Venus-positive nuclei in PEG-injected or collagen-injected flank ectoderm compared with control penetrated but uninjected flank ectoderm of 18–21 som. Tcf/Lef::H2B–Venus embryos (n = 3 embryos per condition, P = 0.0018 (collagen)-; P = 7.2 × 10⁻⁶ (PEG)-injected versus control (Student’s t-test)). (d) Relative fluorescence intensity of actin at cell interfaces was quantified using SIESTA software and plotted over 90° (n = 3 embryos per condition; P = 0.0021 (collagen)-; P = 0.025 (PEG)-injected versus control (Student’s t-test)). (e) Confocal images of control and collagen-injected 21 som. Tcf/Lef::H2B–Venus flank ectoderm. Shown are z sections (top panels) and xy sections visualizing actin (red), H2B–Venus (green) and DAPI (blue). (f) Limb initiation model. Mesodermal growth at limb initiation (blue; white arrows indicate direction of mesodermal growth) is sufficient to anisotropically stress the overlying ectoderm owing to the elongate shape of the lateral plate, resulting in accumulation of actin (red) at AP cell interfaces. Scale bar, 10 μm (e). Error bars indicate s.e.m. Asterisks indicate P < 0.05 (d), P < 0.01 (c).
Figure 4
Figure 4
Cell division precipitates cell neighbour exchange and oriented remodelling of pre-AER 18–22 som. ectoderm. (a,b) Confocal time series of mitotic 18 som. ectodermal cells expressing CAG::myr–Venus demonstrates post-cell division (blue) T1-like neighbour exchange (a) and daughter cell intercalation among neighbours (b). (c) Outline of cell interfaces in 20 som. limb bud ectoderm with multicellular rosettes highlighted in yellow. (d) Time series demonstrates 18 som. rosette resolution. (e) The daughter cell (red) in the 18 som. limb ectoderm contributes to rosette formation following cell division. (f) Polar plots represent how the long axes of rosettes in different spatial regions of 18–22 som. embryos remodel during 2–3 h time-lapse videos. Long axes of rosettes are plotted at the beginning (forming or formed rosettes) and end (resolving or resolved rosettes; 49 rosettes examined, n = 5 embryos). Scale bars, 10 μm.
Figure 5
Figure 5
Tension augments the DV stress pattern and orients rosettes in pre-AER ectoderm. (a) Left, finite-element simulated principal stresses (red arrows) attributable to mesodermal growth alone at the 22 som. stage. Surface-plane DV:AP principal stress ratios approach 1:1. Right, simulated maximum principal stress field due to mesodermal growth. (b) Simulated deformation predicts bulbous tissue expansion. (c) Left, finite-element simulated principal stresses due to pulling forces secondary to cell intercalation at the DV boundary. Surface-plane DV:AP principal stress ratios >3:1. Right, simulated maximum principal stress field due to pulling forces at DV boundary generates tensile gradient along the PD axis. (d) Simulated deformation predicts maintenance of a narrow DV limb bud axis. In a and c, red, green and blue arrows indicate maximum, middle and minimum principal stresses, respectively. (e) AFM cantilevered tip at different PD levels. (f) AFM measurements of proximal, middle and distal regions of initiating limb buds were used to calculate Young’s modulus (n = 5 embryos; P = 0.0491 (distal versus proximal; Student’s t-test)). (g,h) Limb bud ectodermal cells expressing R26R::mTmG; Crect before and after ablation of AP (g) or DV (h) interfaces. Lower panels, kymographs of vertex displacement over time (6 s intervals). Yellow arrows highlight cell vertices. (i) Distance between two vertices adjacent to cut interface in AP and DV interfaces (P = 0.0008). (j) Peak retraction velocities of ablated AP and DV interfaces (P = 0.0001); (i,j) n~ 18 ablations for each of eight 19–23 som. embryos. (k) Distance between two vertices of proximal AP or proximal DV cut interfaces (P = 0.0442). (l) Peak retraction velocities of ablated proximal AP and proximal DV interfaces (P = 0.1208); (k,l) n~ 15 ablations for each of four 19–23 som. embryos. ((il) Student’s t-test with Holm’s correction.) (m) R26R::mTmG; Crect limb bud ectoderm before and 3 min after ablation. Red lines indicate sites of ablation. (n) Rosette AP/PD aspect ratio (lengthAP/lengthPD) measured before and after ablation of a region distal to the rosette (n = 6 embryos 21–26 som.; P = 0.019 (Student’s t-test)). (o) Pre-AER model. Although rosette resolution at the base of the bud occurs along the AP axis (lower rosette), intercalation of AER progenitors (green) generates a tensile gradient that redirects rosette resolution along the PD axis (top rosette). Error bars indicate s.e.m. Scale bars, 10 μm (g,h,m), 100 μm (e). The asterisks indicate P < 0.01 (j); P < 0.05 (n).
Figure 6
Figure 6
Ectodermal β-catenin is required to polarize actin and orient cell behaviour in response to stress. (a,b) Optical projection tomography of E9.75 (30–31 som.) forelimb buds in wild type (a) and β-catf/f; Crect mutants (b). Dorsal views are shown; anterior is up. (c) Confocal image of a rhodamine–phalloidin-stained β-catf/f; Crect mutant embryo showing a basal ectodermal section (compare with Fig. 2a). (d) Relative fluorescence intensity of actin at cell interfaces (SIESTA). Wild type n = 5 18–20 som. embryos, β-catf/f; Crect n = 3 19–22 som. embryo, P = 0.0066 (60–75° bin), P = 0.0004 (75–90° bin; Student’s t-test). (e) Time series of mitotic cells in initiating β-catf/f; Crect mutant limb bud ectoderm expressing R26R::mTmG. (f) Proportion of daughter cells that underwent intercalation in wild-type and β-catf/f; Crect mutant limb buds (P = 0.034; Student’s t-test). (g) Proportion of Type 1, 2 and 3 interfaces in wild-type and β-catf/f; Crect mutant limb buds (P = 0.0042 (Student’s t-test); wild type: n = 30 mitotic cells, 5 embryos; mutant: n = 25 cells, 2 embryos). Schematic representation of Type 1, 2 and 3 interfaces (right). (h) Confocal time series of a rosette in the central region of a β-catf/f; Crect mutant limb bud ectoderm expressing R26R::mTmG. (i) Axes of rosette remodelling in a β-catf/f; Crect mutant limb bud ectoderm (42 rosettes, n = 2 embryos). (j) Confocal images of collagen-injected β-catf/f; Crect mutant flank ectoderm (compare with Fig. 3e). Shown are z section (top panel) and xy sections visualizing actin (red) and DAPI (blue). (k) Relative fluorescence intensity of actin at cell interfaces (SIESTA; n = 3 19–21 som. embryos per condition, P = 0.0046 75–90° bin mutant versus control (Student’s t-test)). (l) Distance between two vertices attached to either AP or DV cut interfaces in β-catf/f; Crect mutant limb bud ectoderm (P = 0.43). (m) Peak retraction velocities of ablated AP and DV interfaces in β-catf/f; Crect mutant limb bud ectoderm (P = 0.36; (l,m) n ~ 15 ablations over four 21–25 som. embryos for each condition (Student’s t-test with Holm’s correction)). (n) AFM measurements of proximal, middle and distal regions of initiating wild-type and β-catf/f; Crect mutant limb buds were used to calculate Young’s modulus (n = 5 control embryos, n = 3 mutant embryos; P = 0.0435 (distal control versus mutant; Student’s t-test)). (o) Simulated deformation of an early bud based on mutant Young’s modulus of 0.042 kPa (compare with Fig. 5b). Scale bars, 10 μm (c,e,h,j), 200 μm (a,b). Error bars indicate s.e.m. Asterisk indicates P < 0.05.
Figure 7
Figure 7
Direct and indirect functions of β-catenin and Fgfr2. (a) Confocal images of control β-catf/f and β-catf/f; Crect mutant limb bud ectoderm at the 25 and 29 som. stage expressing R26R::Venus–actin. Yellow arrows indicate sites of cortical separation. (b) Rate of change of interface length from time-lapse videos of control and β-catf/f ; Crect mutant limb bud ectoderm expressing R26R::Venus–actin, normalized to maximum interface length. Shown are representative curves from 4 interfaces. (c) Peak amplitude of oscillation of AP and DV interfaces in control β-catf/f and β-catf/f; Crect mutant limb bud ectoderm (n = 32 interfaces for each condition; P = 4.2 × 10⁻⁵ (AP) P = 1.0 × 10⁻⁵ (DV; Student’s t-test)). (d) Relative fluorescence intensity of actin at cell interfaces in limb bud ectoderm of embryos that were treated with IWR-1 or vehicle control (dimethylsulphoxide (DMSO)) for 6 h was quantified using SIESTA software and plotted over 90° (n = 3 19–22 som. embryos per condition; P = 0.0031 (45–60° bin), P = 0.035 (60–75° bin), P = 0.015 (75–90° bin) (Student’s t-test)). (e) Confocal images of control β-catf/f and β-catf/f; Crect mutant ectoderm visualizing CD44 (green) and DAPI (blue). (f) Relative fluorescence intensity of actin at cell interfaces of embryos treated with IWP-2 or vehicle control (DMSO) for 6 h (SIESTA; n = 3 19–22 som. embryos per condition; P = 0.31 (75–90° bin) (Student’s t-test)). (g) Optical projection tomography image of E9.75 Fgfr2f/f; Crect mutant forelimbs. Dorsal views, anterior is up. (h) Relative fluorescence intensity of actin at cell interfaces (SIESTA; wild type n = 5 embryos, Fgfr2f/f; Crect n = 3, P = 0.00015 (60–75° bin), P = 4.2 × 10⁻⁵ (75–90° bin), (Student’s t-test)). (i) Proportion of Type 1, 2 and 3 interfaces in wild-type and Fgfr2f/f; Crect mutant limb buds (P = 0.093 (Student’s t-test); wild type: n = 30 mitotic cells, 5 embryos; mutant: n = 11 cells, 3 embryos). (j) Axes of rosette remodelling in Fgfr2f/f; Crect mutant limb bud ectoderm (20 rosettes, n = 2 embryos). (k) Meandering index (displacement/total distance travelled) of Tcf-positive nuclei near the DV boundary of wild-type and Fgfr2f/f; Crect mutant limb buds, P = 3.5 × 10⁻⁴ (Student’s t-test). (l) DV displacement of Tcf-positive nuclei near the DV boundary of wild-type and Fgfr2f/f; Crect mutant limb buds, P = 0.02 (Student’s t-test). (For k and l, n = 20 cells over 2 h in three 21–25 som., embryos for each.) (m) Fgfr2f/f; Crect mutant limb bud ectoderm expressing R26R::Venus–actin. Scale bars, 10 μm (a,e,m), 200 μm (g). Error bars indicate s.e.m. Asterisk indicates P < 0.05 (d,h,l) and P < 0.01 (c,k).

References

    1. Keller R. Developmental biology. Physical biology returns to morphogenesis. Science. 2012;338:201–203. - PubMed
    1. Heisenberg CP, Bellaiche Y. Forces in tissue morphogenesis and patterning. Cell. 2013;153:948–962. - PubMed
    1. Hopyan S, Sharpe J, Yang Y. Budding behaviors: growth of the limb as a model of morphogenesis. Dev Dyn. 2011;240:1054–1062. - PubMed
    1. Boehm B, et al. The role of spatially controlled cell proliferation in limb bud morphogenesis. PLoS Biol. 2010;8:e1000420. - PMC - PubMed
    1. Gros J, et al. WNT5A/JNK and FGF/MAPK pathways regulate the cellular events shaping the vertebrate limb bud. Curr Biol. 2010;20:1993–2002. - PMC - PubMed

Publication types

MeSH terms

LinkOut - more resources