. 2015 May;18(5):708-17.
doi: 10.1038/nn.4001. Epub 2015 Apr 20.

Ca(2+) signaling in astrocytes from Ip3r2(-/-) mice in brain slices and during startle responses in vivo

Affiliations

Ca(2+) signaling in astrocytes from Ip3r2(-/-) mice in brain slices and during startle responses in vivo

Rahul Srinivasan et al. Nat Neurosci. 2015 May.

Abstract

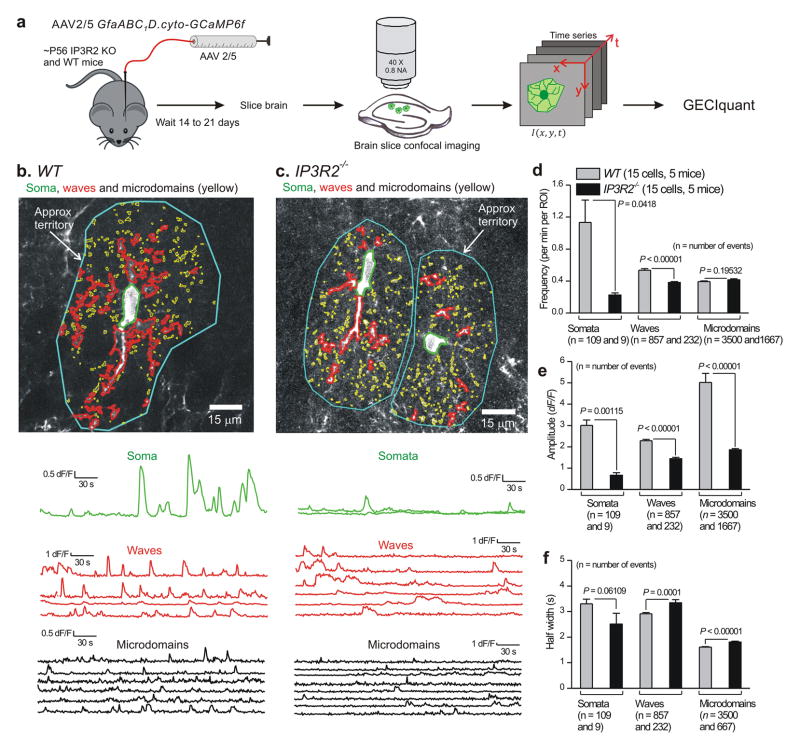
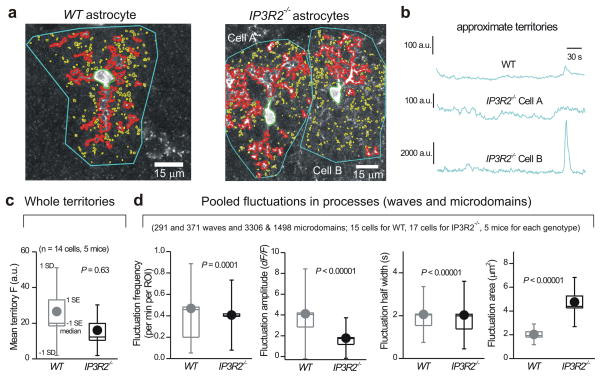
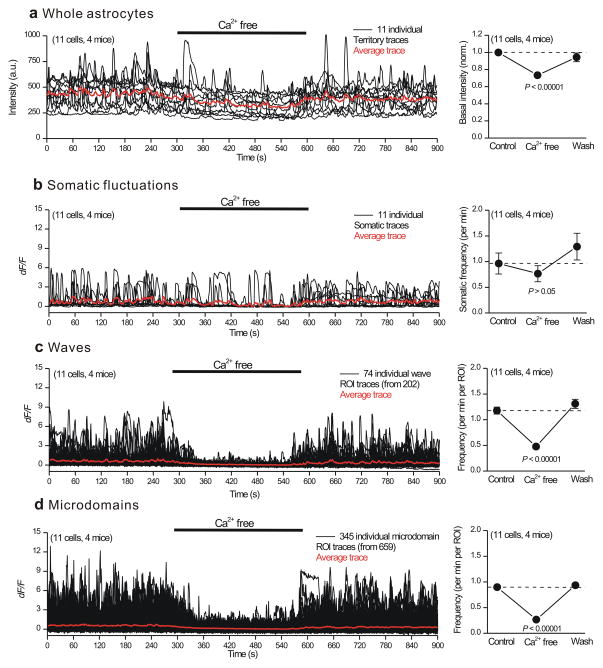
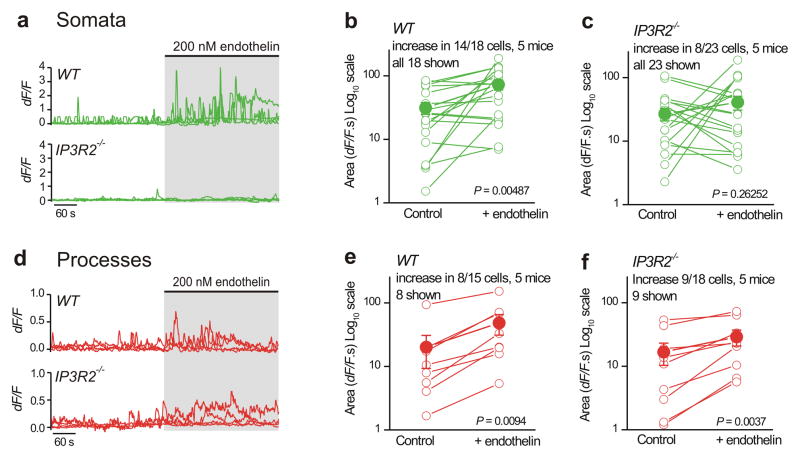
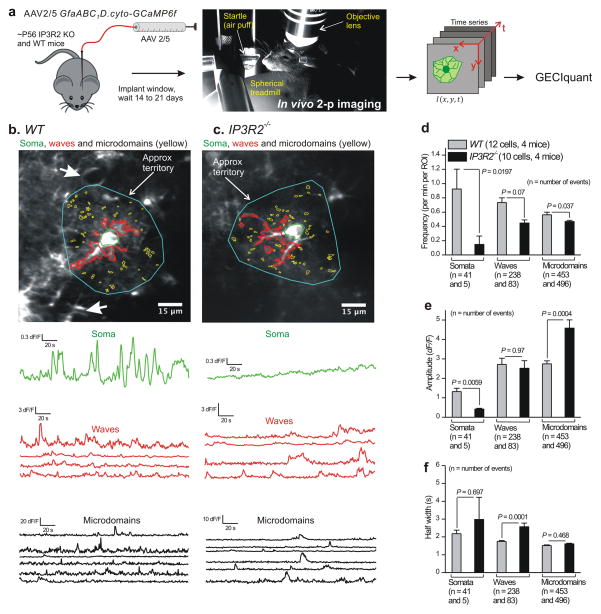
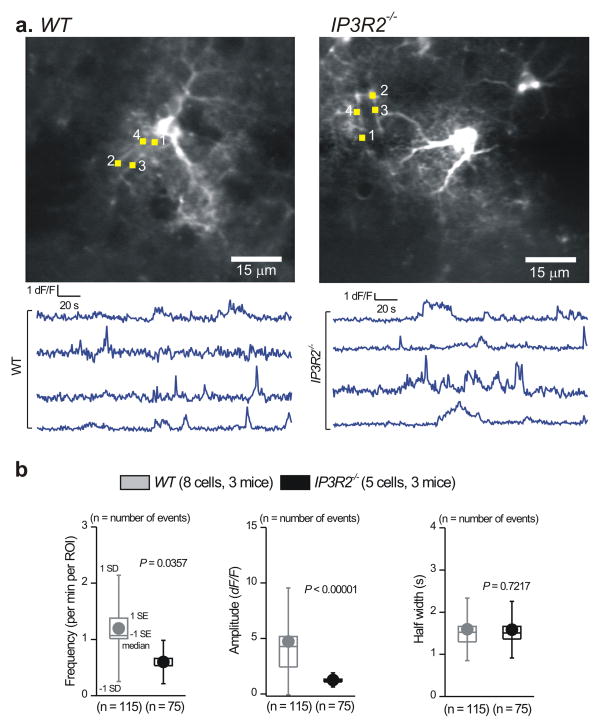
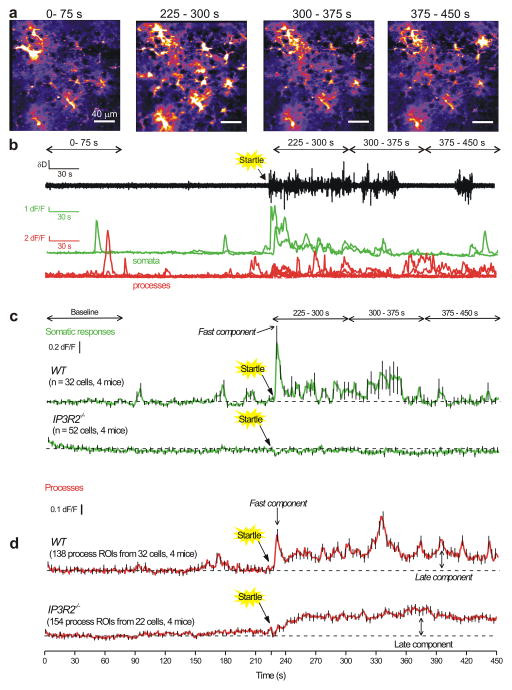
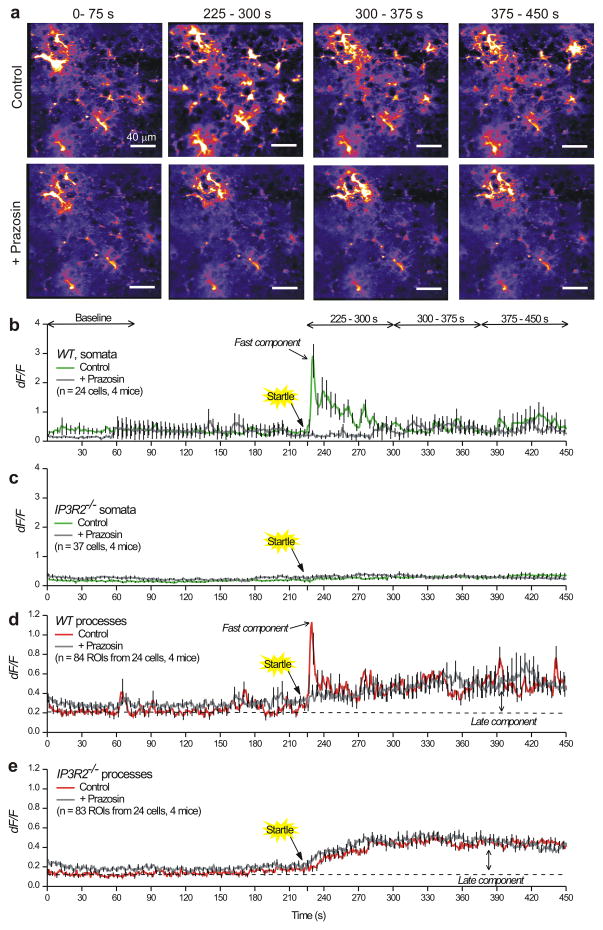
Intracellular Ca(2+) signaling is considered to be important for multiple astrocyte functions in neural circuits. However, mice devoid of inositol triphosphate type 2 receptors (IP3R2) reportedly lack all astrocyte Ca(2+) signaling, but display no neuronal or neurovascular deficits, implying that astrocyte Ca(2+) fluctuations are not involved in these functions. An assumption has been that the loss of somatic Ca(2+) fluctuations also reflects a similar loss in astrocyte processes. We tested this assumption and found diverse types of Ca(2+) fluctuations in astrocytes, with most occurring in processes rather than in somata. These fluctuations were preserved in Ip3r2(-/-) (also known as Itpr2(-/-)) mice in brain slices and in vivo, occurred in end feet, and were increased by G protein-coupled receptor activation and by startle-induced neuromodulatory responses. Our data reveal previously unknown Ca(2+) fluctuations in astrocytes and highlight limitations of studies that used Ip3r2(-/-) mice to evaluate astrocyte contributions to neural circuit function and mouse behavior.


Figures

Figure 1
Figure 1. Ca2+ fluctuations in hippocampal astrocytes from WT and IP3R2/ mice
a. Schematic illustrating the experimental approach. b. Representative images and traces for Ca2+ fluctuations measured in an astrocyte from a WT mouse. Three predominant types of Ca2+ event are demarcated: somatic fluctuations (green), waves (red) and microdomains (yellow). Approximate territory boundaries are outlined in blue, but these were not used for data analyses and are shown only for illustrative purposes. c. As in b, but for two astrocytes from an IP3R2/ mouse. Representative movies are shown as Supplementary movies 1 and 2. d–f. Average data for Ca2+ fluctuation properties in WT and IP3R2/ mice (n = 15 and 17 astrocytes WT and IP3R2/, and 5 mice for each). For this and all other figures, statistical comparisons were made using unpaired non-parametric Mann-Whitney or unpaired parametric Student’s t tests as deemed appropriate after analyzing the raw data (see Data analysis). The n numbers on d–f refer to the numbers of Ca2+ fluctuations for the WT and IP3R2–/– bars, which were averaged for frequency, amplitude and half-width across all cells in panels d–f. The data are shown as mean ± s.e.m.
Figure 2
Figure 2. Ca2+ fluctuations within astrocyte processes are largely intact in brain slices from IP3R2/ mice
a. Representative images of astrocytes from WT and IP3R2/ mice with somatic (green), wave (red) and microdomain (yellow) compartments demarcated in different colors. Approximate territory boundaries are outlined in blue, but were only used for analyses shown in b and c. b. Representative traces for territory ROI fluctuations for the cells shown in a. Such traces were used to measure the average fluorescence over 300 s in panel c. Note that the drawing of the territory for this single specific data set (panel b) is approximate. d. Summary data for WT and IP3R2/ mice for pooled wave and microdomain fluctuations in astrocyte processes, plotted as box and whisker plots; note that these are pooled data from microdomains and waves.
Figure 3
Figure 3. Effect of nominally Ca2+ free buffer applications on astrocyte Ca2+ fluctuations in WT mice
a. Traces and average data for the effect of nominally Ca2+ free buffers on the basal fluorescence intensity of ROIs corresponding approximately to entire astrocytes. b–d. As in a, but for somatic fluctuations (b) as well as for wave (c) and microdomain (d) fluctuations in astrocyte processes. The averages are across all cells for the ROIs indicated in each set of traces. The data are shown as mean ± s.e.m.
Figure 4
Figure 4. GPCR-mediated Ca2+ fluctuations in astrocyte processes are largely intact in hippocampal slices from IP3R2/ mice
a–c. Representative traces and average data for endothelin-evoked Ca2+ fluctuations in astrocyte somata from WT and IP3R2/ mice. d–f. As in a–c, but for astrocyte processes. Five WT and five IP3R2/ mice were analyzed for the experiments reported in this figure, and paired Student’s t tests were used when comparing before and during endothelin application. The data are shown as mean ± s.e.m.
Figure 5
Figure 5. Abundant Ca2+ fluctuations persist in astrocyte processes from WT and IP3R2/ mice in vivo
a. Schematic illustrating the experimental approach for in vivo imaging in fully awake mice free to rest or run on a spherical treadmill (with no anesthesia). b. Representative images and traces for Ca2+ fluctuations measured in a cortical astrocyte from a WT mouse. Three predominant types of Ca2+ event are shown: somatic, waves and microdomains. Approximate territory boundaries are outlined in blue, but were not used for data analyses and are shown only for illustrative purposes. c. As in b, but for an astrocyte from an IP3R2/ mouse. Representative movies are Supplementary movies 5 and 6. d–f. Average data for astrocyte Ca2+ fluctuation properties from WT and IP3R2/ mice during in vivo imaging (n = 12 astrocytes and 4 mice for each). As stated in the figure, the n numbers refer to the numbers of Ca2+ fluctuations for each bar, which were averaged for frequency, amplitude and half-width across all cells in panels d–f. The data are shown as mean ± s.e.m.
Figure 6
Figure 6. Ca2+ fluctuations persist in vivo within endfeet of cortical astrocytes from IP3R2/ mice
a. Representative traces and images for Ca2+ fluctuations measured in astrocyte endfeet from WT and IP3R2/ mice. b. Average data for astrocyte Ca2+ fluctuation properties from WT and IP3R2/ mice during in vivo imaging (WT: n = 7 astrocytes and 3 mice, IP3R2/: n = 5 astrocytes and 3 mice). The averages are across all cells and are shown as box and whisker plots.
Figure 7
Figure 7. Endogenously evoked astrocyte process Ca2+ fluctuations recorded during in vivo startle responses reveal early and late components
a. Representative images of Ca2+ fluctuations from cortical astrocytes before, during and after startle responses, which were evoked by a puff of air to the face of the mouse (see Methods and Supplementary movie 9). The times written above each of the images correspond to the times shown in the traces in panel b and c. Startle was evoked at 225 s. Representative data for WT and IP3R2/ are shown in Supplementary movie 7 and 8. b. Representative traces for the animal’s locomotion on the spherical treadmill along with Ca2+ responses of cortical astrocytes for somatic and process fluctuations for the cells shown in a. Note that startle-triggered running of the mouse on the ball, as well as Ca2+ fluctuations in cortical astrocytes. c. Average data for experiments such as those in b for 32 cells from four WT and 52 cells from four IP3R2/ mice. d. As in c, but for astrocyte process fluctuations. Note that the responses in the territory displayed a fast/early component and a slow/late component that persisted during these recordings. In the interests of clarity, error bars in panels c and d are shown for every 5th data point, but the underlying average traces are for all cells. The data are shown as mean ± s.e.m.
Figure 8
Figure 8. Prazosin-sensitive and insensitive components of the endogenously evoked astrocyte process Ca2+ fluctuations recorded during in vivo startle responses
a. Representative images of Ca2+ fluctuations from cortical astrocytes before, during and after startle responses. The upper panels show control responses to startle without prazosin influence, whereas the lower panels show the same field of view after 1 mg/kg prazosin was injected ip. Startle was evoked at 225 s. Representative data for WT are shown in Supplementary movie 8 and 9. b. Average traces showing Ca2+ responses in cortical astrocytes for somatic Ca2+ fluctuations before and after prazosin injections. Note that startle triggered a robust Ca2+ response in the somata, that was blocked by prazosin. c. Similar experiments to those shown in b, but for astrocytes from IP3R2/ mice. Note that startle evoked no somatic responses. d. As in b, but for astrocyte process Ca2+ fluctuations. Note that the responses in the processes displayed a fast component with a peak at ~3 s after startle, and a late component that persisted during these recordings. Prazosin blocked only the fast component. e. As in d, but for IP3R2/ mice. The slow component of the Ca2+ response triggered by startle was present in the IP3R2/ mice and was insensitive to prazosin. The results shown in this figure are from 4 WT and 4 IP3R2/ mice. In the interests of clarity, error bars in panels b–e are shown for every 5th data point, but the underlying average traces are for all cells. The data are shown as mean ± s.e.m.

References

    1. Bushong EA, Martone ME, Jones YZ, Ellisman MH. Protoplasmic astrocytes in CA1 stratum radiatum occupy separate anatomical domains. J Neurosci. 2002;22:183–192. - PMC - PubMed
    1. Wilhelmsson U, et al. Redefining the concept of reactive astrocytes as cells that remain within their unique domains upon reaction to injury. Proc Natl Acad Sci U S A. 2006 Nov 14;103(46):17513–8. - PMC - PubMed
    1. Attwell D, et al. Glial and neuronal control of brain blood flow. Nature. 2010;468:232–243. - PMC - PubMed
    1. Barres BA. The mystery and magic of glia: a perspective on their roles in health and disease. Neuron. 2008;60:430–440. - PubMed
    1. Khakh BS, McCarthy KD. Astrocyte calcium signals: from observations to functions and the challenges therein. Cold Spring Harb Perspect Biol. 2015 Jan 20; doi: 10.1101/cshperspect.a020404. pii: a020404. Epub ahead of print. - DOI - PMC - PubMed

Publication types