. 2015 Apr 20;10(3):e0121314.
doi: 10.1371/journal.pone.0121314. eCollection 2015.

A mass spectrometric-derived cell surface protein atlas

Affiliations

A mass spectrometric-derived cell surface protein atlas

Damaris Bausch-Fluck et al. PLoS One. .

Abstract

Cell surface proteins are major targets of biomedical research due to their utility as cellular markers and their extracellular accessibility for pharmacological intervention. However, information about the cell surface protein repertoire (the surfaceome) of individual cells is only sparsely available. Here, we applied the Cell Surface Capture (CSC) technology to 41 human and 31 mouse cell types to generate a mass-spectrometry derived Cell Surface Protein Atlas (CSPA) providing cellular surfaceome snapshots at high resolution. The CSPA is presented in form of an easy-to-navigate interactive database, a downloadable data matrix and with tools for targeted surfaceome rediscovery (http://wlab.ethz.ch/cspa). The cellular surfaceome snapshots of different cell types, including cancer cells, resulted in a combined dataset of 1492 human and 1296 mouse cell surface glycoproteins, providing experimental evidence for their cell surface expression on different cell types, including 136 G-protein coupled receptors and 75 membrane receptor tyrosine-protein kinases. Integrated analysis of the CSPA reveals that the concerted biological function of individual cell types is mainly guided by quantitative rather than qualitative surfaceome differences. The CSPA will be useful for the evaluation of drug targets, for the improved classification of cell types and for a better understanding of the surfaceome and its concerted biological functions in complex signaling microenvironments.


Conflict of interest statement

Competing Interests: The authors have declared that no competing interests exist.

Figures

Fig 1
Fig 1. Workflow for building the CSPA with cellular resolution.
Cell types of various origins were analyzed using the CSC technology. LC-MS/MS analyses and sequence database searches were performed. The resulting peptide-spectrum matches were used to build a spectral library, against which spectra from all the LC-MS/MS runs were matched. The identified N-glycoproteins were subjected to label-free relative quantification. The quality filtered protein list for N-glycoproteins from the sequence database and spectral library search was incorporated into the Cell Surface Protein Atlas, enriched with relative protein abundances.
Fig 2
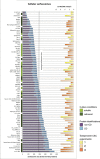
Fig 2. Cell-specific surfaceome sizes in relation to biological and technical replicates.
The individual cell types investigated are listed with their surfaceome sizes (blue and purple bars from the left, blue = CD proteins, purple = other surface proteins). Adherent cells are labeled with dark green bars, soluble cells are labeled with light green bars, and cells with other growth properties (e.g. spheres) are not labeled. The bars from the right represent the number of LC-MS/MS runs performed. The color-code symbolizes the numbers of independent CSC experiments performed for that cell type (yellow = 1, orange = 2, red = 3).
Fig 3
Fig 3. Distribution of protein occurrences over different cellular species.
Proteins were classified into different bins (counts) based on the number of different cellular species on which they were detected (different observations). Since only 31 mouse cell types were investigated, the purple bar covers 1 to 31 observations. Human proteins with 1 or 2 observations and proteins with more than 20 observations are shown in two pie charts. The most prominent molecular functions found in both groups were binding, catalytic activity, receptor and transporter. Molecular functions were annotated by Gene Ontology.
Fig 4
Fig 4. SISYPHUS screenshot of CD54 protein card.
The protein card view is displayed for CD54 detected on HBL-1 cells. Annotations from various data sources (UniProt ID, UniProt Accession, ENTREZ gene, CD), UniProt keywords, subcellular locations, functions, molecular features, and tissue specificities are displayed (if known). The peptides identified from CD54 are listed on the bottom, together with the respective peptide probabilities, charge states, and further peptide-specific information. On the right, GO annotations are displayed, and by using the button on the top (“This protein was identified in 40 Exps”) a new window can be opened, displaying other cellular species on which CD54 was found.
Fig 5
Fig 5. Expression matrix of human CD proteins.
The 239 quantified CD proteins are listed according to their annotated number and their computed expression values in 47 human cell lines. Color code indicates expression level (blue = highest expression, yellow = lowest expression, light yellow = not detected). The cells are grouped according to their germ line origin (green = endoderm, blue = mesoderm, red = ectoderm) and functional groups. The most distinct cellular groups are annotated.
Fig 6
Fig 6. MS- and antibody-based absolute quantification of cell surface proteins.
A) Calculated protein copy numbers per single cell from SRM measurements of CD147, CD100, CD54, and EPHB2. Two independent sample preparations and measurements were performed (light and dark blue bars). B) Calibration curve from QuantiBRITE beads. Slope and offset were calculated from the linear fit over the geometric mean of the four populations of beads with known fluorophore molecules bound. C) Flow cytometric analysis of unlabeled (grey) and CD54 labeled (blue) Jurkat cells in two replicates. Based on the calibration curve and the measured geometric mean, an average CD54 protein abundance per single cell was calculated.

References

    1. Freitas RA Jr (2005) What is nanomedicine? Nanomedicine: nanotechnology, biology, and medicine 1: 2–9. - PubMed
    1. Schwartz SM (1999) The definition of cell type. Circ Res 84: 1234–1235. - PubMed
    1. Elschenbroich S, Kim Y, Medin JA, Kislinger T (2010) Isolation of cell surface proteins for mass spectrometry-based proteomics. Expert review of proteomics 7: 141–154. 10.1586/epr.09.97 - DOI - PubMed
    1. Savas JN, Stein BD, Wu CC, Yates JR 3rd (2011) Mass spectrometry accelerates membrane protein analysis. Trends in biochemical sciences. - PMC - PubMed
    1. da Cunha JP, Galante PA, de Souza JE, de Souza RF, Carvalho PM, et al. (2009) Bioinformatics construction of the human cell surfaceome. Proc Natl Acad Sci U S A 106: 16752–16757. 10.1073/pnas.0907939106 - DOI - PMC - PubMed

Publication types

Substances