

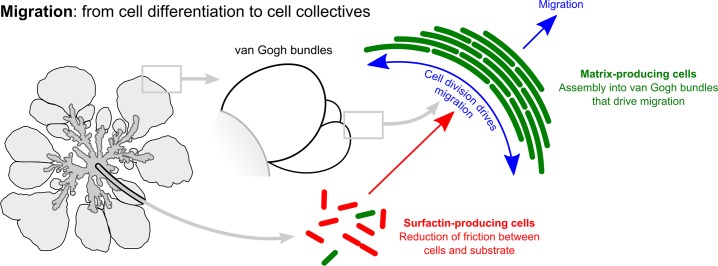
From cell differentiation to cell collectives: Bacillus subtilis uses division of labor to migrate
- PMID: 25894589
- PMCID: PMC4403855
- DOI: 10.1371/journal.pbio.1002141
From cell differentiation to cell collectives: Bacillus subtilis uses division of labor to migrate
Abstract
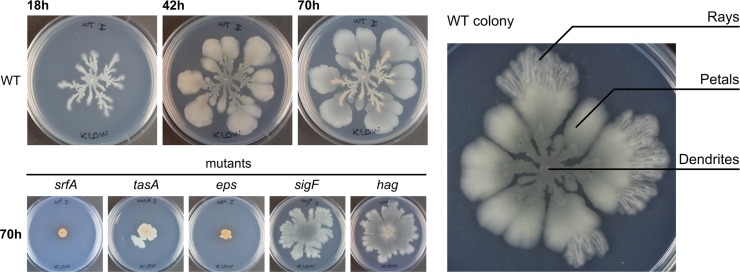
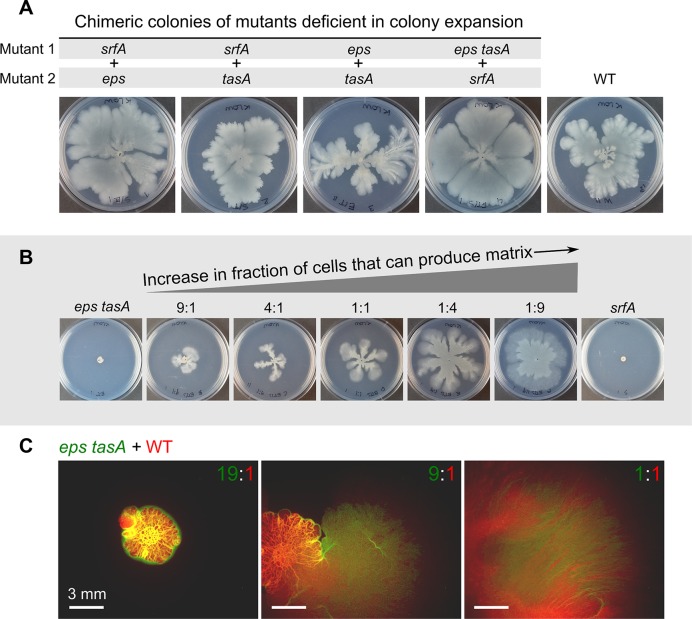
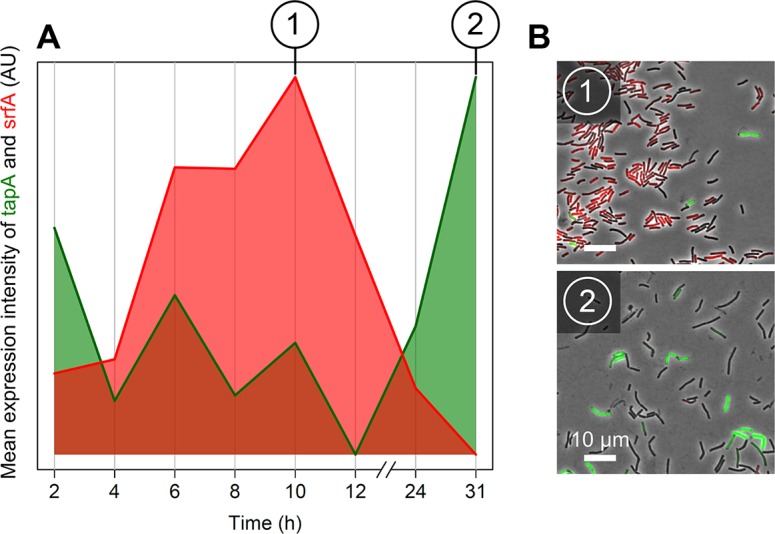
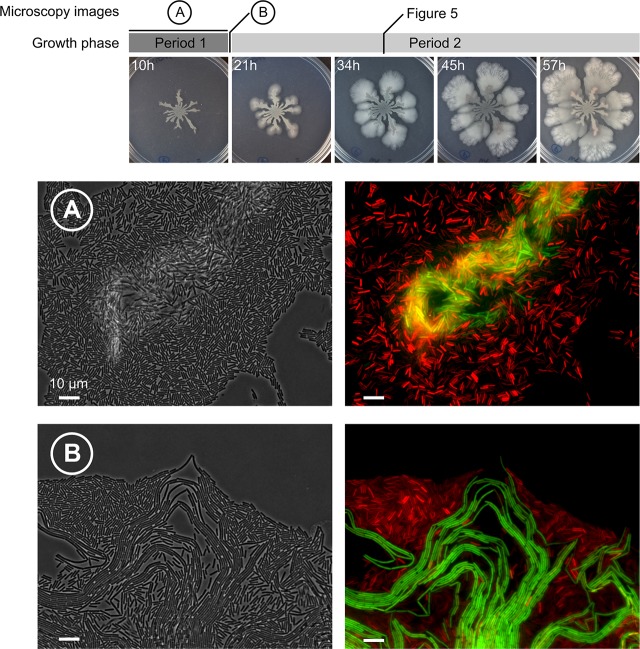
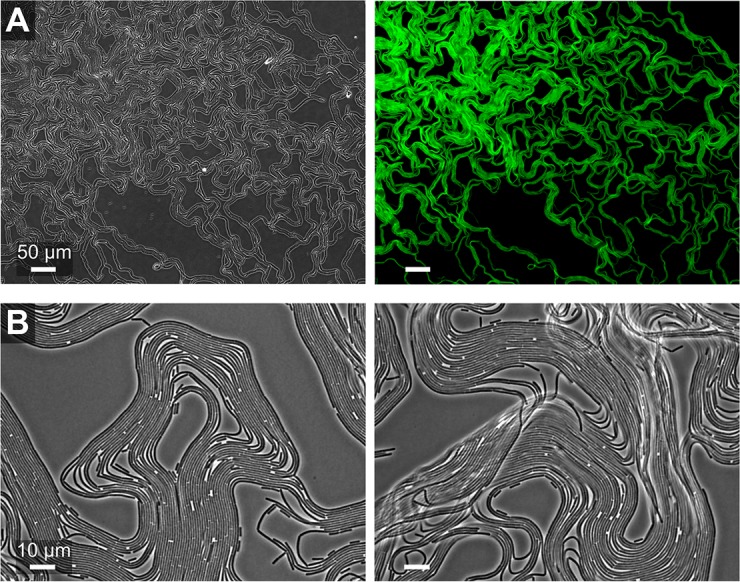
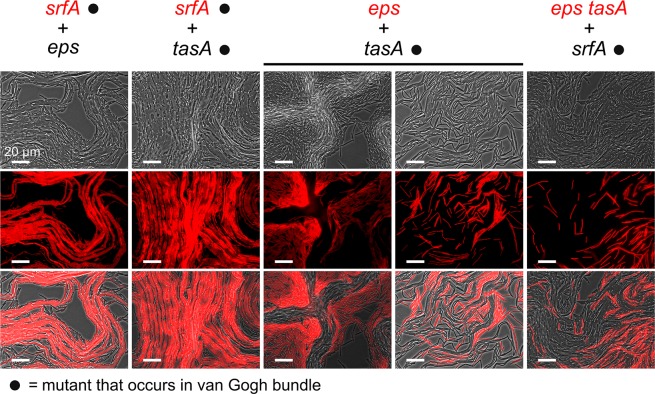
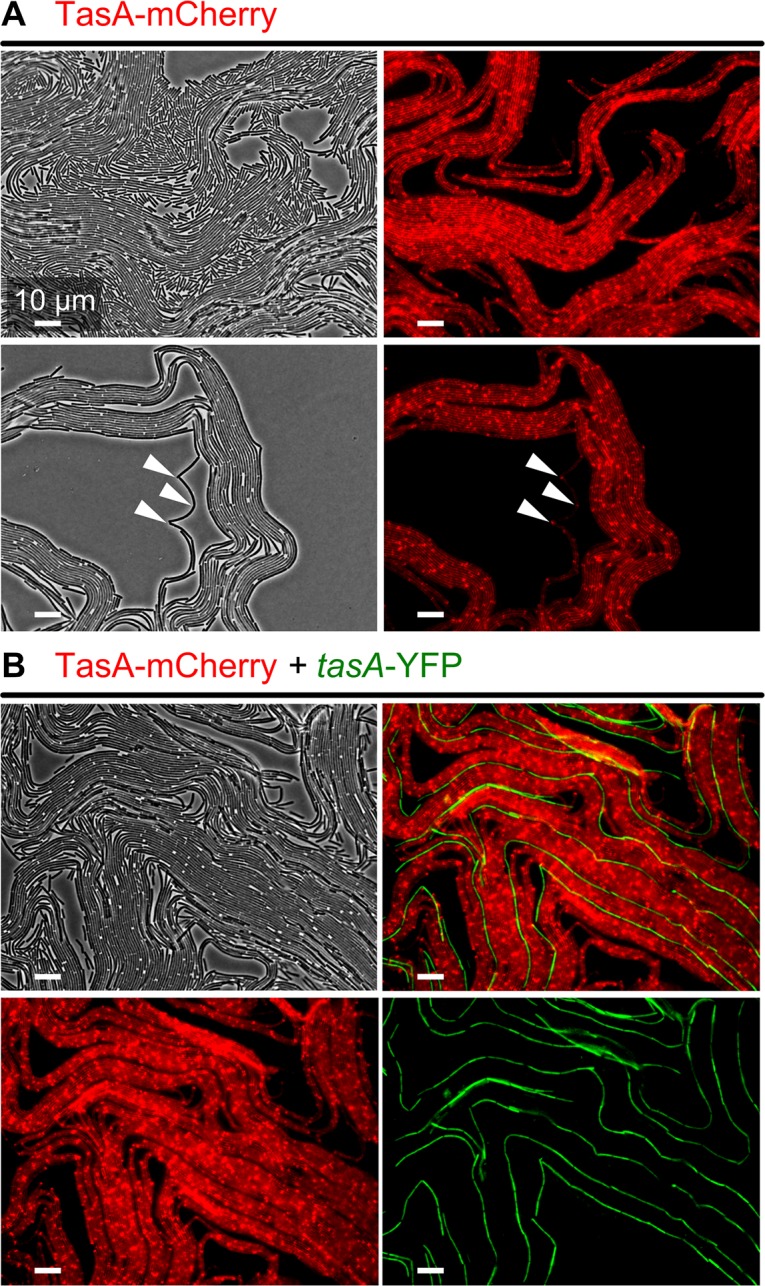
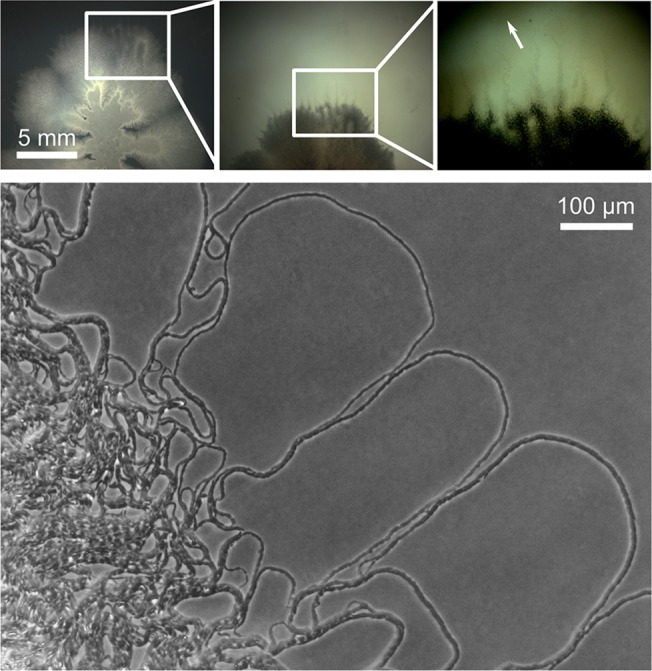
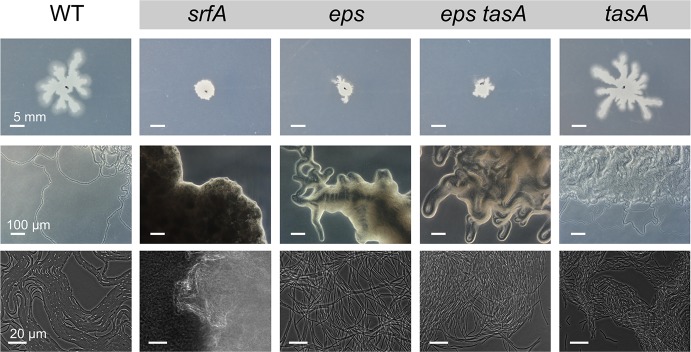
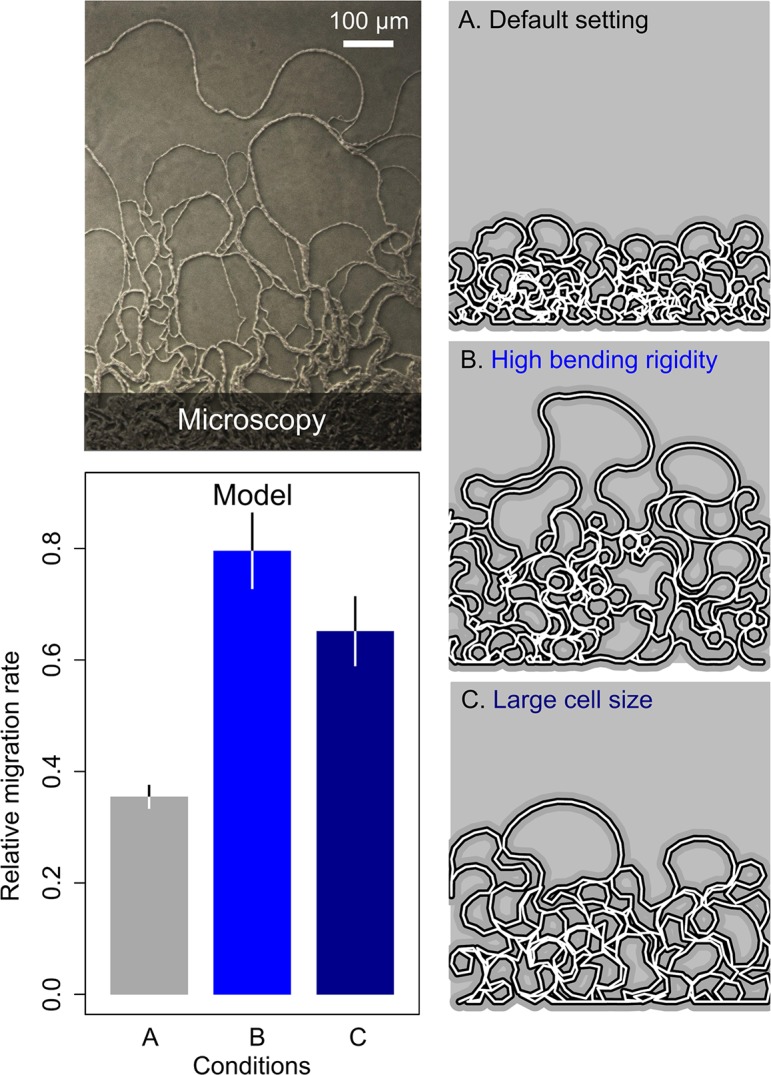
The organization of cells, emerging from cell-cell interactions, can give rise to collective properties. These properties are adaptive when together cells can face environmental challenges that they separately cannot. One particular challenge that is important for microorganisms is migration. In this study, we show how flagellum-independent migration is driven by the division of labor of two cell types that appear during Bacillus subtilis sliding motility. Cell collectives organize themselves into bundles (called "van Gogh bundles") of tightly aligned cell chains that form filamentous loops at the colony edge. We show, by time-course microscopy, that these loops migrate by pushing themselves away from the colony. The formation of van Gogh bundles depends critically on the synergistic interaction of surfactin-producing and matrix-producing cells. We propose that surfactin-producing cells reduce the friction between cells and their substrate, thereby facilitating matrix-producing cells to form bundles. The folding properties of these bundles determine the rate of colony expansion. Our study illustrates how the simple organization of cells within a community can yield a strong ecological advantage. This is a key factor underlying the diverse origins of multicellularity.
Conflict of interest statement
The authors have declared that no competing interests exist.
Figures
References
-
- Newman SA, Comper WD (1990) ‘Generic’ physical mechanisms of morphogenesis and pattern formation. Development 110: 1–18. - PubMed
-
- Gerhart J, Kirschner M (1997) Cells, embryos and evolution Malden (Massachusetts): Wiley.
Publication types
MeSH terms
Grants and funding
LinkOut - more resources
Full Text Sources
Other Literature Sources
