

Behavioral and Environmental Modification of the Genetic Influence on Body Mass Index: A Twin Study
- PMID: 25894925
- PMCID: PMC4459891
- DOI: 10.1007/s10519-015-9718-6
Behavioral and Environmental Modification of the Genetic Influence on Body Mass Index: A Twin Study
Abstract
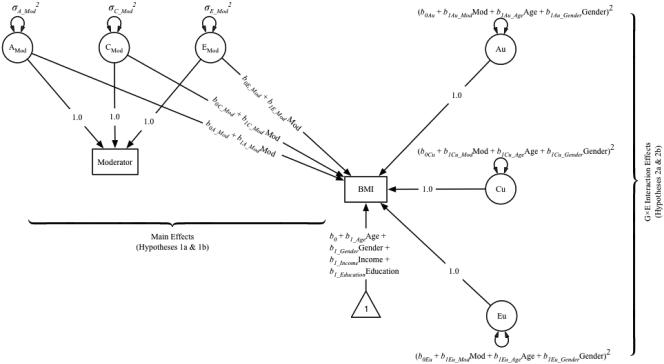
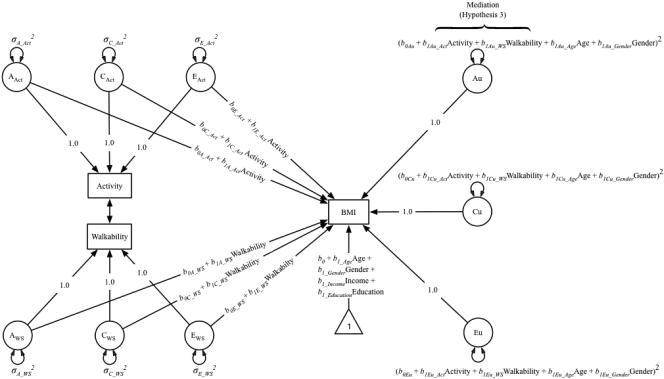
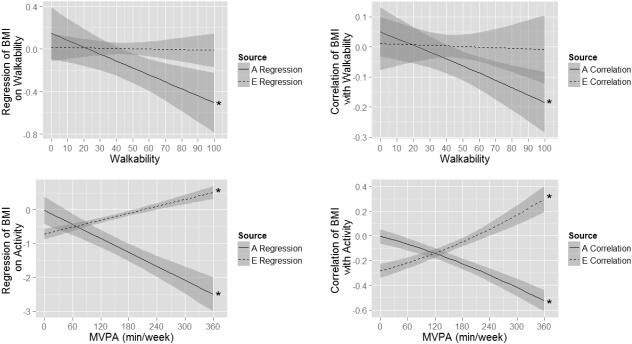
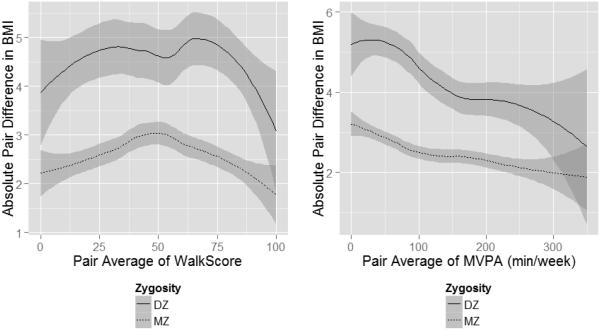
Body mass index (BMI) has a strong genetic basis, with a heritability around 0.75, but is also influenced by numerous behavioral and environmental factors. Aspects of the built environment (e.g., environmental walkability) are hypothesized to influence obesity by directly affecting BMI, by facilitating or inhibiting behaviors such as physical activity that are related to BMI, or by suppressing genetic tendencies toward higher BMI. The present study investigated relative influences of physical activity and walkability on variance in BMI using 5079 same-sex adult twin pairs (70 % monozygotic, 65 % female). High activity and walkability levels independently suppressed genetic variance in BMI. Estimating their effects simultaneously, however, suggested that the walkability effect was mediated by activity. The suppressive effect of activity on variance in BMI was present even with a tendency for low-BMI individuals to select into environments that require higher activity levels. Overall, our results point to community- or macro-level interventions that facilitate individual-level behaviors as a plausible approach to addressing the obesity epidemic among US adults.
Figures


Similar articles
-
Quasi-causal associations of physical activity and neighborhood walkability with body mass index: a twin study.Prev Med. 2015 Jan;70:90-5. doi: 10.1016/j.ypmed.2014.11.024. Epub 2014 Dec 4. Prev Med. 2015. PMID: 25482422 Free PMC article.
-
The association of body mass index and osteoarthritis of the knee joint: an examination of genetic and environmental influences.Arthritis Rheum. 2003 Apr;48(4):1024-9. doi: 10.1002/art.10884. Arthritis Rheum. 2003. PMID: 12687544
-
Gene X environment interaction of vigorous exercise and body mass index among male Vietnam-era twins.Am J Clin Nutr. 2009 Apr;89(4):1011-8. doi: 10.3945/ajcn.2008.27170. Epub 2009 Feb 18. Am J Clin Nutr. 2009. PMID: 19225119 Free PMC article.
-
The genetics of obesity.Metabolism. 1995 Sep;44(9 Suppl 3):4-6. doi: 10.1016/0026-0495(95)90310-0. Metabolism. 1995. PMID: 7674914 Review.
-
Obesity and eating behavior from the perspective of twin and genetic research.Neurosci Biobehav Rev. 2020 Feb;109:150-165. doi: 10.1016/j.neubiorev.2019.12.012. Neurosci Biobehav Rev. 2020. PMID: 31959301 Review.
Cited by
-
Obesity, diet quality, physical activity, and the built environment: the need for behavioral pathways.BMC Public Health. 2016 Nov 10;16(1):1153. doi: 10.1186/s12889-016-3798-y. BMC Public Health. 2016. PMID: 27832766 Free PMC article.
-
Epigenome-wide association study of physical activity and physiological parameters in discordant monozygotic twins.Sci Rep. 2022 Nov 23;12(1):20166. doi: 10.1038/s41598-022-24642-3. Sci Rep. 2022. PMID: 36424439 Free PMC article.
-
Cohort Profile: TWINS study of environment, lifestyle behaviours and health.Int J Epidemiol. 2019 Aug 1;48(4):1041-1041h. doi: 10.1093/ije/dyy224. Int J Epidemiol. 2019. PMID: 30428089 Free PMC article. No abstract available.
-
The obesity epidemic - Nature via nurture: A narrative review of high-income countries.SAGE Open Med. 2020 Apr 28;8:2050312120918265. doi: 10.1177/2050312120918265. eCollection 2020. SAGE Open Med. 2020. PMID: 32435480 Free PMC article. Review.
-
Two genetic analyses to elucidate causality between body mass index and personality.Int J Obes (Lond). 2021 Oct;45(10):2244-2251. doi: 10.1038/s41366-021-00885-4. Epub 2021 Jul 10. Int J Obes (Lond). 2021. PMID: 34247202
References
-
- Alonso A, Martí A, Corbalán MS, Martínez-González MA, Forga L, Martínez JA. Association of UCP3 gene −55C>T polymorphism and obesity in a Spanish population. Ann Nutr Metab. 2005;49:183–188. - PubMed
-
- American Diabetes Association Economic costs of diabetes in the U.S. in 2007. Diabetes Care. 2008;31:596–615. - PubMed
Publication types
MeSH terms
Grants and funding
LinkOut - more resources
Full Text Sources
Other Literature Sources
Molecular Biology Databases
