. 2015 Jun 20;6(17):15332-47.
doi: 10.18632/oncotarget.3684.

Inhibition of insulin-like growth factor receptor/AKT/mammalian target of rapamycin axis targets colorectal cancer stem cells by attenuating mevalonate-isoprenoid pathway in vitro and in vivo

Affiliations

Inhibition of insulin-like growth factor receptor/AKT/mammalian target of rapamycin axis targets colorectal cancer stem cells by attenuating mevalonate-isoprenoid pathway in vitro and in vivo

Chetna Sharon et al. Oncotarget. .

Abstract

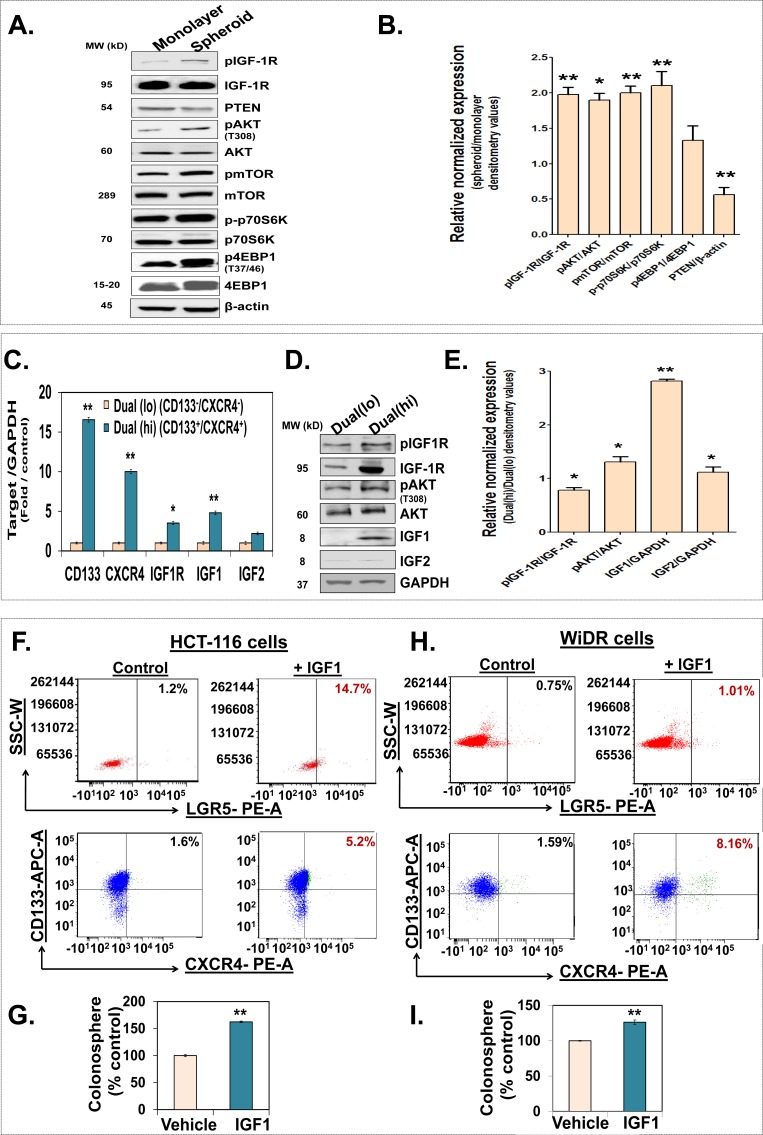
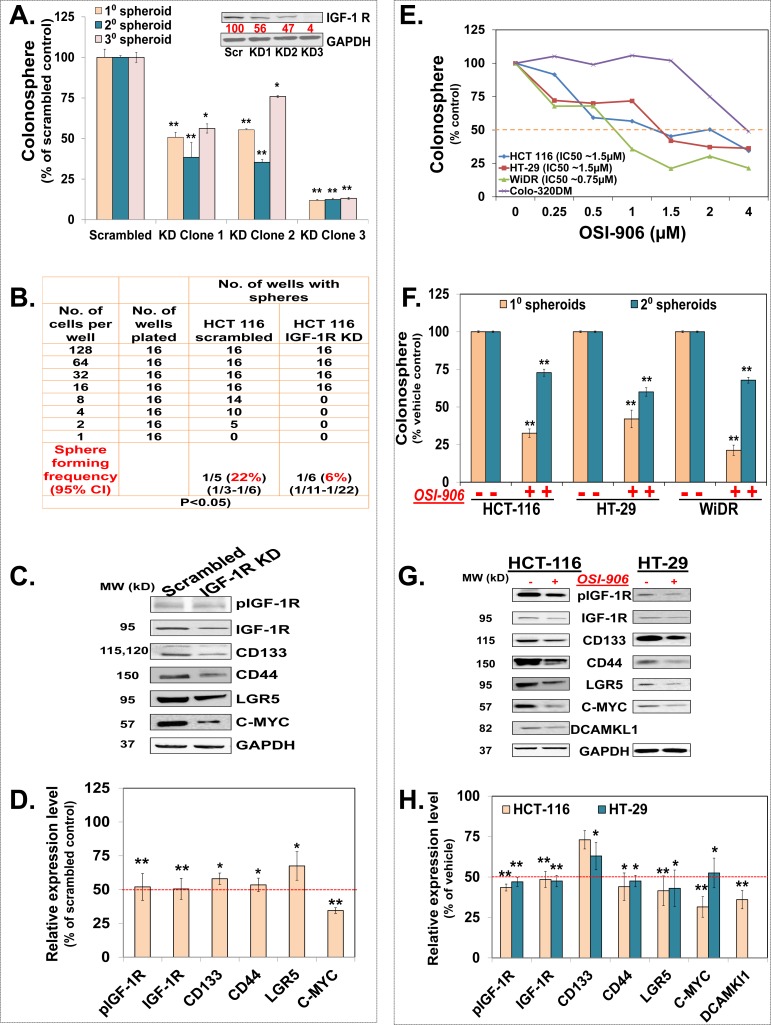
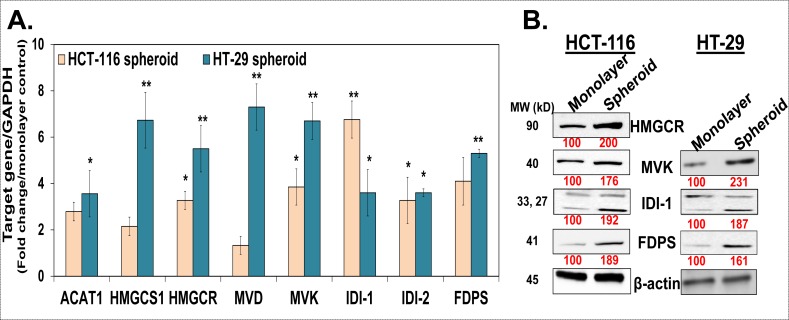
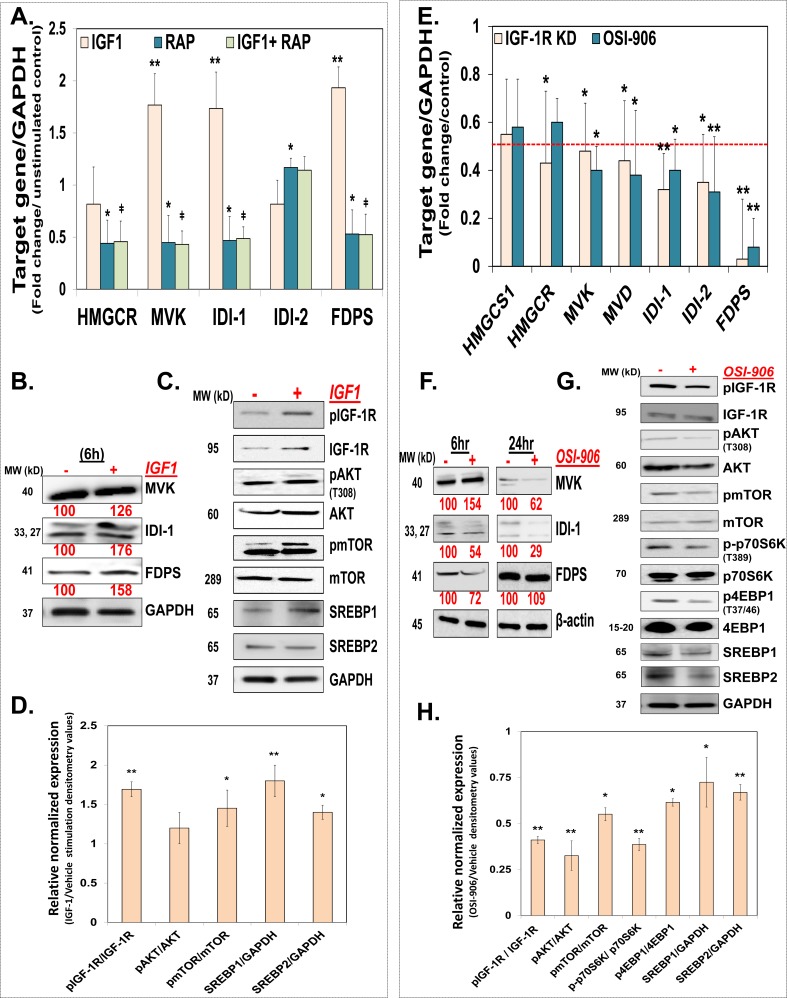
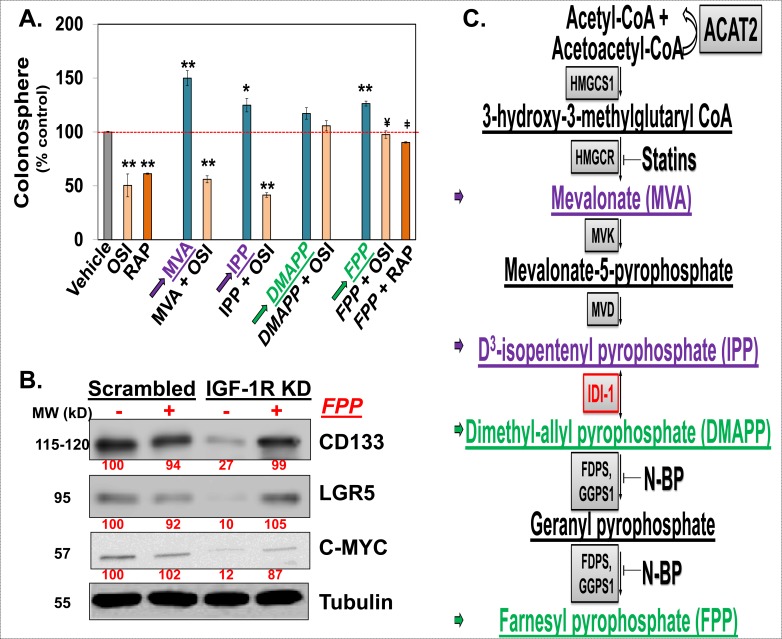
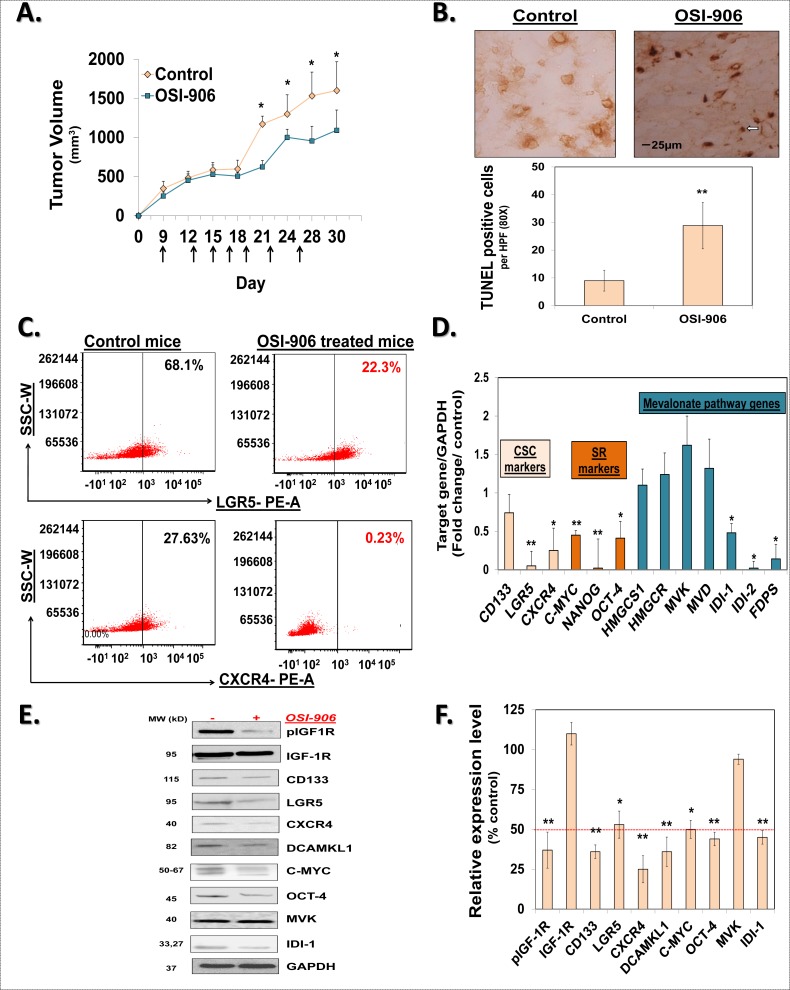
We observed a co-upregulation of the insulin-like growth factor receptor (IGF-1R)/AKT/mammalian target of rapamycin (mTOR) [InAT] axis and the mevalonate-isoprenoid biosynthesis (MIB) pathways in colorectal cancer stem cells (CSCs) in an unbiased approach. Hence, we hypothesized that the InAT axis might regulate the MIB pathway to govern colorectal CSCs growth. Stimulation (IGF-1) or inhibition (IGF-1R depletion and pharmacological inhibition of IGF-1R/mTOR) of the InAT axis produced induction or attenuation of CSC growth as well as expression of CSC markers and self-renewal factors respectively. Intriguingly, activation of the InAT axis (IGF-1) caused significant upregulation of the MIB pathway genes (both mRNA and protein); while its inhibition produced the opposite effects in colonospheres. More importantly, supplementation with dimethylallyl- and farnesyl-PP, MIB metabolites downstream of isopentenyl-diphosphate delta isomerase (IDI), but not mevalonate and isopentenyl-pp that are upstream of IDI, resulted in a near-complete reversal of the suppressive effect of the InAT axis inhibitors on CSCs growth. The latter findings suggest a specific regulation of the MIB pathway by the InAT axis distal to the target of statins that inhibit 3-hydroxy-3-methyl-glutaryl-CoA reductase (HMGCR). Effects of IGF-1R inhibition on colonic CSCs proliferation and the MIB pathway were confirmed in an 'in vivo' HCT-116 xenograft model. These observations establish a novel mechanistic link between the InAT axis that is commonly deregulated in colorectal cancer and the MIB pathway in regulation of colonic CSCs growth. Hence, the InAT-MIB corridor is a novel target for developing paradigm shifting optimum anti-CSCs therapies for colorectal cancer.

Keywords: cancer stem cells; insulin-like growth factor-1 receptor; isoprenoids; mTOR; mevalonate pathway.


Conflict of interest statement

CONFLICTS OF INTEREST STATEMENT

The authors declare no competing financial or intellectual property interest.

Figures

Figure 1
Figure 1. Activation of the InAT axis is observed in colorectal CSCs
(A and B) Representative immunoblots and the corresponding bar graph of the gel densitometry analyses of relative normalized expression of the InAT axis proteins including activated (phosphorylated) levels of IGF-1R, AKT, mTOR, p70S6K and 4EBP1 (normalized to total protein expression) as well as PTEN, an inhibitor of InAT axis, in HCT-116 spheroids compared to respective monolayer controls. β-actin is used as a loading control. (C) Q-PCR analyses demonstrating differential expression of IGF-1R pathway genes and CSC markers in Dual(hi) [CD133(hi)/CXCR4(hi), CSCs] compared to Dual(lo) [CD133(low)/CXCR4 (low), non-CSCs] cells. Data was normalized to GAPDH. (D and E) Representative immunoblots and the corresponding bar graph of the gel densitometry analyses show higher expression of phosphorylated IGF-1R and AKT (normalized to total protein expression) as well as substantial increase in IGF1 level in Dual(hi) HT-29 cells compared to Dual(lo) controls. GAPDH is used as a loading control. (F and H) HCT-116 and WiDR cells grown in monolayer condition were serum starved for 24 h followed by stimulation with IGF1 (100 ng/ml) for 48 hours. Representative scattered plots of flow cytometry analyses for LGR5 positive and Dual(hi) cells (CD133 positive cells depicted in blue and CXCR4 positive cells depicted in green) show increase in proportion of CSCs in IGF1 stimulated cells compared to unstimulated controls. (G and I) Colonosphere formation in HCT-116 and WiDR monolayer cells stimulated with IGF1 (100 ng/ml) compared to respective controls. Data are presented as mean ± SD (n = 3). *p < 0.05; **p < 0.005.
Figure 2
Figure 2. Inhibition of IGR-1R, an upstream regulator of the InAT axis, suppresses colon CSCs growth and self-renewal
(A) Immunoblot analyses show reduced IGF-1R expression and corresponding inhibition of 1o/2o/3o spheroid formation in different subclones of HCT-116 cells stably transfected with IGF-1R shRNA compared to scrambled controls; suggesting attenuation of CSC growth and self-renewal by IGF-1R gene knockdown. (B) Extreme limiting dilution assay shows reduced spheroid forming frequency of HCT-116 cells transfected with IGF-1R shRNA (Clone 2, IGF-1R KD) compared to scramble transfected control. (C & D) Representative immunoblots and the corresponding bar graph of the gel densitometry analyses show decreased expression of activated and total IGF-1R as well as CSC markers (CD133, CD44, and LGR5) and self-renewal factor (C-MYC) in IGF-1R KD spheroids compared to scrambled controls. (E) Dose response curve shows dose dependent inhibition of primary colonosphere formation in three out of four colon cancer cell lines treated with OSI-906, a tyrosine kinase inhibitor of IGF-1R, at an IC50 ranging from 0.75 μM −1.5 μM compared to vehicle treated control. (F) OSI-906 (1.5 μΜ) inhibits 1o as well as 2o spheroid formation in HCT-116, HT-29 and WiDR colon cancer cells suggesting attenuation of CSC growth and self-renewal. (G & H) Representative immunoblots and the corresponding bar graph of the gel densitometry analyses show decreased expression of activated IGF-1R (at 15 min) as well as CSC markers (CD133, CD44, LGR5, and DCAMKL1) and self-renewal marker (C-MYC) (24 hours) in HCT-116 and HT-29 spheroids treated with OSI-906 (1.5 μΜ) compared to vehicle treated controls. GAPDH is used as loading control for all immunoblot analyses. Data are presented as mean ± SD (n = 3). Numbers under the blot represent relative densitometry values. *p < 0.05; **p < 0.005.
Figure 3
Figure 3. The mevalonate-isoprenoid biosynthesis (MIB) pathway is upregulated in colon CSCs
(A). Q-PCR analyses show higher expression of several MIB pathway genes in HCT-116 and HT-29 spheroids compared to monolayer controls suggesting upregulation of MIB pathway in colorectal CSCs. Data was normalized to GAPDH. (B). Immunoblot analyses show increased expression of key MIB pathway proteins in both HCT-116 and HT-29 spheroids compared to monolayer controls. β-actin is used as loading control. Data are presented as mean ± SD (n = 3). Numbers under the blot represent relative densitometry values. *p < 0.05; **p < 0.005.
Figure 4
Figure 4. The InAT axis regulates the MIB pathway in CSCs ‘in vitro
(A) Q-PCR analyses show increased expression of MIB pathway genes in HCT-116 spheroids stimulated with IGF1 (10 ng/ml) for 6 h compared to unstimulated controls. Moreover, pretreatment with Rapamycin (3 nM) abrogates increase in MIB pathway gene expression seen with IGF-1 stimulation. Data was normalized to GAPDH. **p < 0.005 compared to vehicle treated control; ǂ p < 0.05 compared to IGF1 treated spheroid. (B) Immunoblots showing increased expression of select MIB pathway proteins in HCT-116 spheroids stimulated with IGF1 (10 ng/ml) for 6 hours compared to controls. GAPDH is used as loading control. (C and D) Representative immunoblots and the corresponding bar graph of the gel densitometry analyses in HCT-116 spheroids stimulated with IGF1 (10 ng/ml) show increased expression of pIGF-1R and downstream mediator pAKT and pmTOR (at 15 min) (normalized to total protein expression) as well as increased expression of cleaved form of SREBPs (transcriptionally active (at 6 hours)), compared to unstimulated controls. GAPDH is used as loading control. (E) Q-PCR analyses showing decreased expression of MIB pathway genes in IGF-1R KD, as well as HCT-116 spheroids treated with OSI-906 (1.5 μΜ) for 24 h compared to scrambled or vehicle treated controls respectively. Data was normalized to GAPDH. (F) Immunoblot analyses show varying degree of inhibition of select MIB pathway proteins at early (6 h) and late (24 h) time points following OSI-906 (1.5 μΜ) treatment in HCT-116 spheroids. β-actin is used as loading control. (G and H) Representative immunoblots and the corresponding bar graph of the gel densitometry analyses show decreased levels of activated form of IGF-1R as well as downstream components of InAT axis (at 15 min) (normalized to total protein expression), as well as cleaved form of SREBP2 (transcriptionally active (1 h treatment)) in OSI-906 (1.5 μM) treated HCT-116 spheroids compared to vehicle treated controls. GAPDH is used as loading control. Numbers under the blot represent relative densitometry values. Data are presented as mean ± SD (n = 3). *p < 0.05; **p < 0.005.
Figure 5
Figure 5. Downregulation of the MIB pathway is required for the InAT axis inhibition mediated attenuation of CSCs growth
(A): Colonosphere formation assays in HCT-116 cells treated with either OSI-906 (1.5 μM) or Rapamycin (3 nM) alone or along with various metabolites of the MIB pathway (1 μM) show near complete reversal of OSI-906 (and/or Rapamycin) mediated inhibition of spheroid formation by DMAPP and FPP (downstream of IDI-1, highlighted with green arrow) but not by MVA or IPP (upstream of IDI-1, highlighted with purple arrow), compared to vehicle treated control. *p < 0.05, **p < 0.005 compared to vehicle treated control; ¥ p < 0.05 compared to OSI-906 treated spheroid; ¥ p < 0.005 compared to Rapamycin treated spheroids. (B) Immunoblots showing reduced expression of CSC markers (CD133 and LGR5) and a self-renewal factor (C-MYC) in IGF-1R KD cells which is almost completely reversed by supplementation with FPP (10 μM) for 48 hours, strongly suggesting critical role of MIB pathway in mediating IGF-1R's effect on expression of CSC markers. Tubulin was used as loading control. (C) Schematic representation of the MIB pathway. Metabolites upstream of IDI-1 are highlighted in purple and downstream of IDI-1 are highlighted in green. Two classes of FDA-approved agents, statins and nitrosylated-bisphophonates (N-BPs), target different enzymes in the MIB pathways than that targeted by InAT axis. Numbers under the blot represent relative densitometry values. Data are presented as mean ± SD (n = 3).
Figure 6
Figure 6. OSI-906 inhibits the MIB pathway and CSCs ‘in vivo
(A) Change in mean tumor volume of HCT-116 xenograft in mice treated with oral gavage of OSI-906 or vehicle (control). Arrows indicate the days of OSI-906 / vehicle gavage. (B) TUNEL staining for apoptosis in HCT-116 xenografts. Arrow indicates an area of positive staining. Average number of TUNEL-positive cells per HPF (80x) shows significant induction of apoptosis in xenograft derived from mice treated with OSI-906, compared to vehicle treated controls. (C) Representative scattered plots of flow cytometry analyses show decrease in expression of CSC markers (LGR5 and CXCR4) in xenograft derived from OSI-906 treated mice, compared to vehicle treated controls. (D) Q-PCR analyses showing significant reduction in the mRNA levels of several CSC markers (CD133, LGR5 and CXCR4), self-renewal factors (C-MYC, NANOG, OCT-4) and select MIB pathway genes in OSI-906 treated mouse xenograft tissue compared to controls. Data was normalized to GAPDH. (E and F) Representative immunoblots and the corresponding bar graph of the gel densitometry analyses show decreased expression of phosphorylated IGF-1R, CSC markers (CD133, LGR5, CXCR4, and DCAMKL1), self-renewal factor (C-MYC and OCT-4) and an MIB pathway protein (IDI-1) in OSI-906 treated xenografts compared to vehicle controls. GAPDH is used as a loading control. Data are presented as mean ± SD (n = 3). *p < 0.05; **p < 0.005.

References

    1. Edwards MS, Chadda SD, Zhao Z, Barber BL, Sykes DP. A systematic review of treatment guidelines for metastatic colorectal cancer. Colorectal Dis. 2012;14:e31–47. - PMC - PubMed
    1. Gangemi R, Paleari L, Orengo AM, Cesario A, Chessa L, Ferrini S, Russo P. Cancer stem cells: a new paradigm for understanding tumor growth and progression and drug resistance. Curr Med Chem. 2009;16:1688–1703. - PubMed
    1. Korkaya H, Wicha MS. Selective targeting of cancer stem cells: a new concept in cancer therapeutics. BioDrugs. 2007;21:299–310. - PubMed
    1. Reya T, Morrison SJ, Clarke MF, Weissman IL. Stem cells, cancer, and cancer stem cells. Nature. 2001;414:105–111. - PubMed
    1. Vaiopoulos AG, Kostakis ID, Koutsilieris M, Papavassiliou AG. Colorectal cancer stem cells. Stem Cells. 2012;30:363–371. - PubMed

Publication types

MeSH terms