. 2015 Jul;144(1):21-38.
doi: 10.1007/s00418-015-1322-6. Epub 2015 Apr 21.

Involvement of unconventional myosin VI in myoblast function and myotube formation

Affiliations

Involvement of unconventional myosin VI in myoblast function and myotube formation

Justyna Karolczak et al. Histochem Cell Biol. 2015 Jul.

Abstract

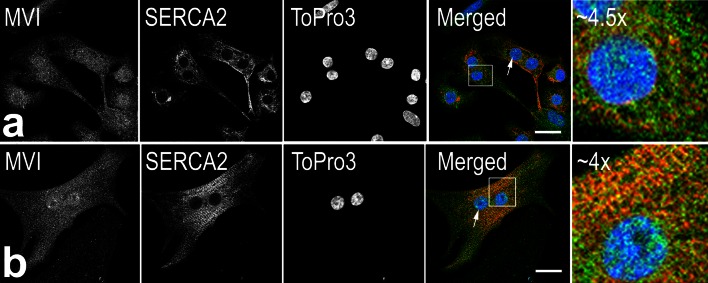
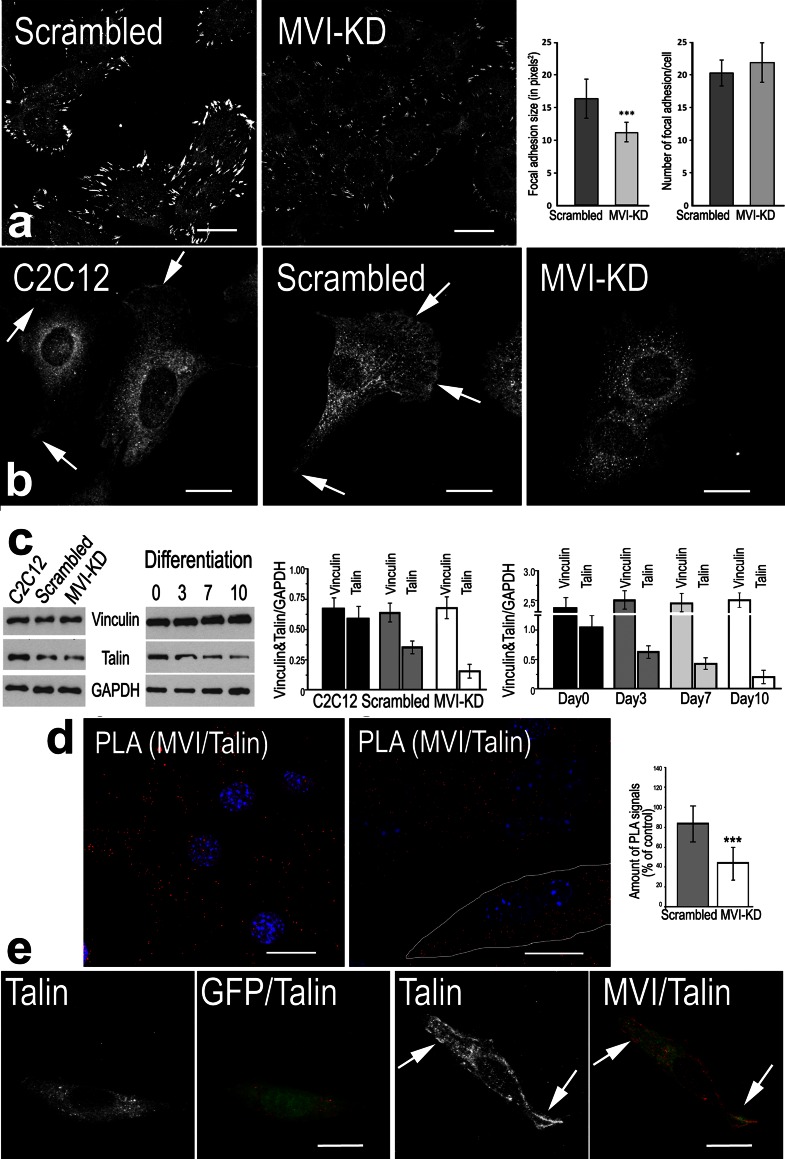
The important role of unconventional myosin VI (MVI) in skeletal and cardiac muscle has been recently postulated (Karolczak et al. in Histochem Cell Biol 139:873-885, 2013). Here, we addressed for the first time a role for this unique myosin motor in myogenic cells as well as during their differentiation into myotubes. During myoblast differentiation, the isoform expression pattern of MVI and its subcellular localization underwent changes. In undifferentiated myoblasts, MVI-stained puncti were seen throughout the cytoplasm and were in close proximity to actin filaments, Golgi apparatus, vinculin-, and talin-rich focal adhesion as well as endoplasmic reticulum. Colocalization of MVI with endoplasmic reticulum was enhanced during myotube formation, and differentiation-dependent association was also seen in sarcoplasmic reticulum of neonatal rat cardiomyocytes (NRCs). Moreover, we observed enrichment of MVI in myotube regions containing acetylcholine receptor-rich clusters, suggesting its involvement in the organization of the muscle postsynaptic machinery. Overexpression of the H246R MVI mutant (associated with hypertrophic cardiomyopathy) in myoblasts and NRCs caused the formation of abnormally large intracellular vesicles. MVI knockdown caused changes in myoblast morphology and inhibition of their migration. On the subcellular level, MVI-depleted myoblasts exhibited aberrations in the organization of actin cytoskeleton and adhesive structures as well as in integrity of Golgi apparatus and endoplasmic reticulum. Also, MVI depletion or overexpression of H246R mutant caused the formation of significantly wider or aberrant myotubes, respectively, indicative of involvement of MVI in myoblast differentiation. The presented results suggest an important role for MVI in myogenic cells and possibly in myoblast differentiation.


Figures

Fig. 1
Fig. 1
MVI expression during differentiation. a Diagram representing the domain structure of MVI. Location of large and small inserts of the mouse MVI is indicated. b Phase-contrast images of C2C12 myotubes after 3 (day-3) and 7 (day-7) days of differentiation. Day-0 myoblasts shortly before switching to 2 % horse serum-containing medium. c Analysis of MVI, fast (MHCf) and slow (MHCs) myosin heavy chains as well as α-, β-, and γ-actin levels by immunoblot at indicated days after the initiation of differentiation. A representative immunoblot is shown. Right panel: a quantitative analysis of the MVI content during myoblast differentiation with respect to the level of glyceraldehyde-3-phosphate dehydrogenase (GAPDH). Values are means ± SD; ***p < 0.001, as measured by Student’s t test. d Assessment of MVI splice variant levels by RT-PCR in differentiating myoblasts. The products obtained with primers designed to produce fragments containing either small or large inserts, as indicated in the figure. e MVI and its splice variants distribution in undifferentiated myoblasts. The endogenous MVI localization was assessed with anti-porcine MVI antibody (αMVI). Myoblasts were also transfected with GFP-tagged human MVI constructs encoding MVI variants with: both inserts (L+S+), the large insert (L+S−), the small insert (L−S+), and without inserts (L−S−). A plasmid encoding GFP alone was used as control. Lower panels ×~3 magnification of the areas marked in the corresponding upper panels. Bars in (b, e), 100 and 20 μm, respectively
Fig. 2
Fig. 2
MVI localization to different compartments of undifferentiated myoblasts. MVI is visualized in green with anti-MVI antibody (ad) or as GFP-associated fluorescence (eh), and nuclei were stained with DAPI (ah). a MVI is present in the regions next to cortical actin (in red, stained with Alexa Flour 536-conjugated phalloidin). b, c MVI is in the close proximity to calreticulin (in red), an endoplasmic reticulum marker, and to GM130 (in red), a Golgi apparatus marker, respectively. d MVI is present next to vinculin-containing (in red) adhesive structures. Regions indicated in the merged images are shown at higher magnification in the right panel. e Overexpression of H246R MVI mutant (in green) myoblasts with MVI knockdown; right panel, merged with DAPI staining. f Overexpression of H246R MVI mutant (in green) in 2-day rat neonatal cardiomyocytes. In red, staining for α-actinin, the marker of Z lines. Arrows on e and f indicate vacuole-like structures. g, h, Day-0 myoblasts overexpressing the GFP-fused wild-type MVI (GFP-MVI) or H246R mutant, respectively. Golgi cisternae (in yellow) were stained with anti-GM130 monoclonal antibody. Arrows in (g), Golgi cisternae in cells overexpressing GFP-MVI, and arrowhead in (h), Golgi cisternae in the cell overexpressing the MVI mutant. Bars 20 μm
Fig. 3
Fig. 3
MVI localization during myoblast differentiation. MVI in day-3 (a, b) and day-7 (c, e) cells is visualized in green with anti-MVI antibody, and in d as GFP-associated fluorescence. In a as well as in (c, d), MVI localizes to actin filaments, especially at myotube edges. b, e, MVI is in close proximity to calreticulin (in red), especially in day-7 myotubes. d Myotube overexpressing GFP-tagged full-length MVI (GFP-MVI). GFP-MVI is also enriched at the actin-rich myotube edge. The far right panels, magnification (as marked on the figure) of the regions indicated in the merged panels. Arrows point to colocalization of MVI with the examined markers and arrowheads to the nuclear MVI presence. Bars 20 μm
Fig. 4
Fig. 4
MVI colocalization with sarcoplasmic reticulum in neonatal rat cardiomyocytes. a and b, Localization of MVI (in green) and SERCA2 (in red) in day-2 and day-8 cardiomyocytes, respectively. Arrows point to the nuclear MVI presence. The far right panels, magnification (as marked in the figure) of the regions indicated in the merged panels. Nuclei were stained with TO-PRO®-3 (in blue). Bars 10 μm
Fig. 5
Fig. 5
MVI is present within acetylcholine receptor-rich clusters. a upper panels, MVI (in red) is enriched in postsynaptic clusters (in green, BTX). In blue, the myotube nuclei stained with DAPI. Middle panels, ×~2 magnification of regions marked in upper panels and bottom panels, ×~1.5 magnification of regions marked in the middle panels. Arrowheads point to the regions stained for MVI but lacking the BTX-staining. Bars 20 μm
Fig. 6
Fig. 6
MVI depletion affects cell morphology and actin cytoskeleton organization. a Immunoblot analysis (WB) of lysates of untransfected myoblasts (C2C12) and myoblasts transfected with a scrambled or MVI shRNA sequence (MVI-KD), probed with anti-MVI and anti-β- and γ-actin isoforms. Bottom panels RT-PCR analysis of the expression of MVI and β-actin in the same cell lines. Right panel a quantitative analysis of the MVI content with respect to the GAPDH level. b Number of cells per well in each cell line was counted after 24, 48, and 72 h. The population doubling time for each culture was found not to be statistically significantly different. The values presented as means ± SD were obtained from three independent experiments. c Assessment of circularity and roundness parameters of the examined cell lines. The analysis was performed for about 100 cell for each cell line from two independent experiments, d Phase-contrast images of untreated (C2C12), scrambled, and MVI-KD myoblasts. e Untreated, scrambled, and MVI-KD cells were stained for filamentous actin with Alexa Flour 647-conjugated phalloidin as well as with antibodies against γ- and β-actin isoforms. Values in ac are means ± SD; ***p < 0.001, as measured by Student’s t test. Bars 20 μm
Fig. 7
Fig. 7
MVI depletion affects Golgi apparatus and endoplasmic reticulum. a, b Staining for GM130 and calreticulin in the scrambled and MVI-KD cells, respectively. The smaller right panels in (a, b) represent ×~2−4 magnification of the regions marked in larger panels. Right panel in (a), assessment of the Golgi area in the scrambled and MVI-KD cells. Right panels in (b), assessment of the whole cell and the ER areas in the scrambled and MVI-KD cells. Inset quantification of the ratio of the area of ER to the area of the cell for each of the examined cells. The analyses were performed for at least 80 cells from each examined condition from two independent experiments. Values are means ± SD. ***p < 0.001; *p < 0.01 as measured by Student’s t test. c Overexpression of GFP-tagged human MVI (GFP-MVI, in green) in MVI-KD cell (left cell) restored to some extent morphology of the Golgi apparatus (stained in red for GM130, marked by arrow). The Golgi apparatus in MVI-KD untransfected cell (on the right, marked by arrowhead) remains to be compact. d Overexpression of GFP-tagged human MVI (GFP-MVI, in green) affects the ER (stained for GRB78, in red) organization of the transfected (an arrow) but not of untransfected (an arrowhead) MVI-KD cells. Nuclei are stained with DAPI (in blue). Bars in (ad), 20 μm
Fig. 8
Fig. 8
MVI in adhesive structures. a Anti-vinculin staining in the scrambled and MVI-KD myoblasts. Graphs show the quantification of the size (on the left, in pixels) and number (on the right) of vinculin-stained focal adhesions. b Anti-talin staining in untransfected (C2C12), scrambled, and MVI-KD myoblasts. Arrows point to the talin-positive cell edges. c Representative immunoblot of lysates of untreated, scrambled, and MVI-KD myoblasts (on the left) as well as of untreated myoblasts transferred to differentiating conditions for up to 10 days (on the right) probed with anti-vinculin, anti-talin, and anti-GAPDH antibodies. Graphs present quantitative analyses of vinculin and talin content relative to GAPDH in C2C12, scrambled and MVI-KD myoblasts as well as during differentiation (days 0–10); d PLA staining (in red) shows proximity of MVI and talin in untreated day-0 myoblasts (left panel) and day-10 myotubes (middle panel a myotube is contoured in white). In blue, nuclei stained with DAPI. Graph (right panel) presents the quantification of the total number of PLA signals in the scrambled and MVI-KD cells expressed as percent of control C2C12 myoblasts. At least 20 cells were quantified for each condition. The values in ac are means ± SD. ***p < 0.001. e Effects of overexpression of GFP (green, left panels) and GFP-tagged human MVI (green, right panels) in MVI-KD cells on localization of talin (in white or red). Overexpression of GFP-MVI but not of GFP restored a wild-type-like talin staining pattern (arrows). Bars 20 μm
Fig. 9
Fig. 9
MVI involvement in cell migration. a Migration tracks (reoriented to zero in migration traces) of 10 randomly chosen nonproliferating untreated (C2C12), scrambled, or MVI-KD myoblasts. The values on x- and y-axes are given in μm. b Cell migration rate and mean distance were measured based on the analysis of tracks of each 30 untreated C2C12, scrambled, and MVI-KD cells. Values are means ± SD. ***p < 0.001
Fig. 10
Fig. 10
MVI in myotube formation. a Phase contrast of representative images of day-7 myotubes. Myotubes formed from untransfected myoblasts (C2C12), or from day-1 myoblasts transiently transfected with a scrambled construct or MVI shRNA (MVI-KD). Arrows point to very wide myotubes. b Representative Western blot analysis of MVI level at day 7. c Quantification of the number of wide myotubes in 12 random fields of view presented as % of all myotubes visible within the respective field of view. The values are means ± SD; ***p < 0.001. d Day-5 myotubes were transfected with pEGFP constructs encoding full-length human MVI fused with GFP (GFP-MVI) or the H246R MVI mutant. F-actin (red) and nuclei (blue) were visualized with Alexa Flour 546-conjugated phalloidin and DAPI, respectively. Bars in (a), 100 μm and in (d), 20 μm

References

    1. Ajima R, Akazawa H, Kodama M, Takeshita F, Otsuka A, Kohno T, Komuro I, Ochiya T, Yokota J. Deficiency of Myo18B in mice results in embryonic lethality with cardiac myofibrillar aberrations. Genes Cells. 2008;13:987–999. doi: 10.1111/j.1365-2443.2008.01226.x. - DOI - PubMed
    1. Allen PG, Shuster CB, Käs J, Chaponnier C, Janmey PA, Herman IM. Phalloidin binding and rheological differences among actin isoforms. Biochemistry. 1996;35:14062–14069. doi: 10.1021/bi961326g. - DOI - PubMed
    1. Ameen N, Apodaca G. Defective CFTR Apical Endocytosis and Enterocyte Brush Border in Myosin VI-Deficient Mice. Traffic. 2007;8:998–1006. doi: 10.1111/j.1600-0854.2007.00587.x. - DOI - PubMed
    1. Arden SD, Puri C, Au JS, Kendrick-Jones J, Buss F. Myosin VI is required for targeted membrane transport during cytokinesis. Mol Biol Cell. 2007;18:4750–4761. doi: 10.1091/mbc.E07-02-0127. - DOI - PMC - PubMed
    1. Aschenbrenner L, Lee TT, Hasson T. Myo6 facilitates the translocation of endocytic vesicles from cell peripheries. Mol Biol Cell. 2003;14:2728–2743. doi: 10.1091/mbc.E02-11-0767. - DOI - PMC - PubMed

Publication types

MeSH terms

LinkOut - more resources