. 2015 Jun 11;522(7555):221-5.
doi: 10.1038/nature14308. Epub 2015 Apr 20.

Intrinsic retroviral reactivation in human preimplantation embryos and pluripotent cells

Affiliations

Intrinsic retroviral reactivation in human preimplantation embryos and pluripotent cells

Edward J Grow et al. Nature. .

Abstract

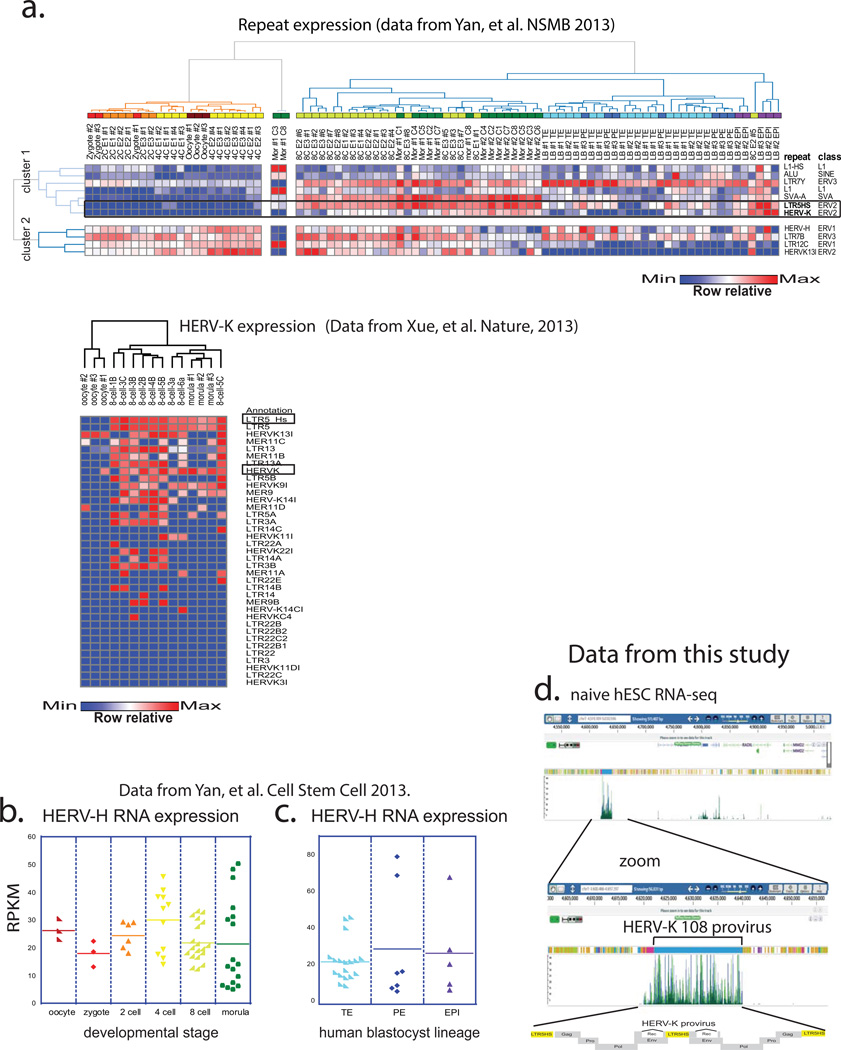
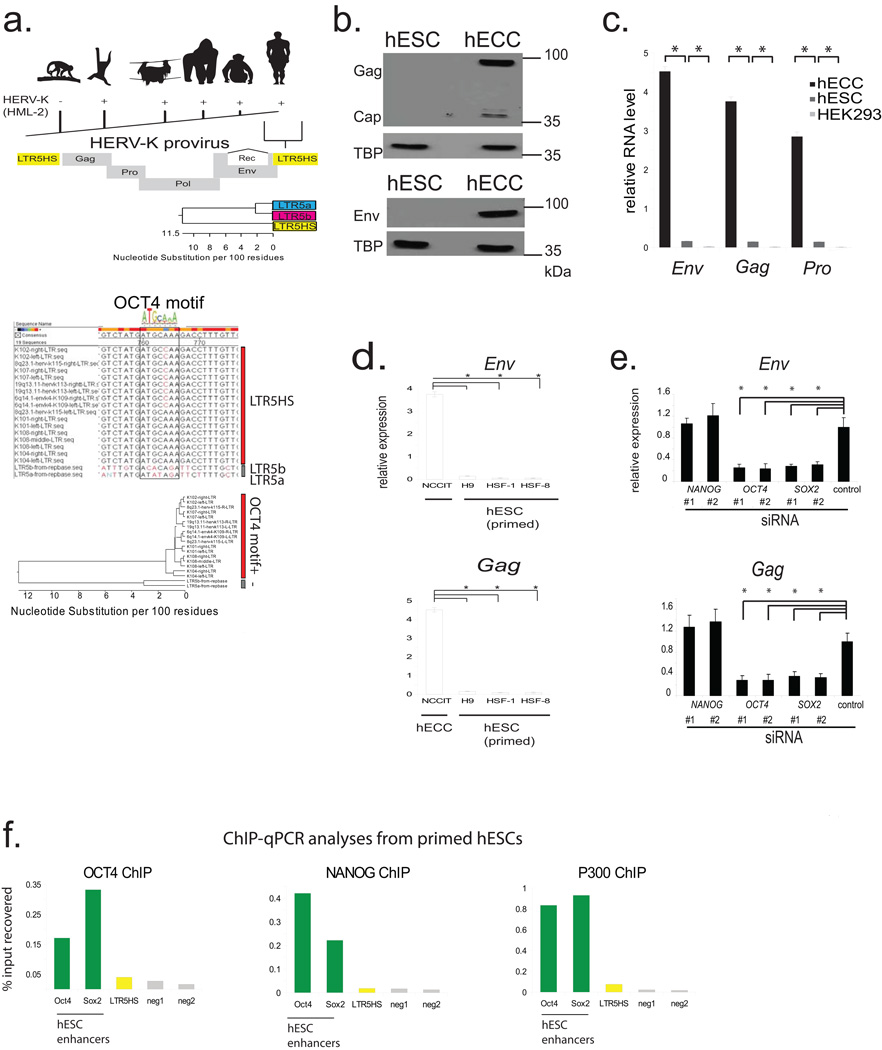
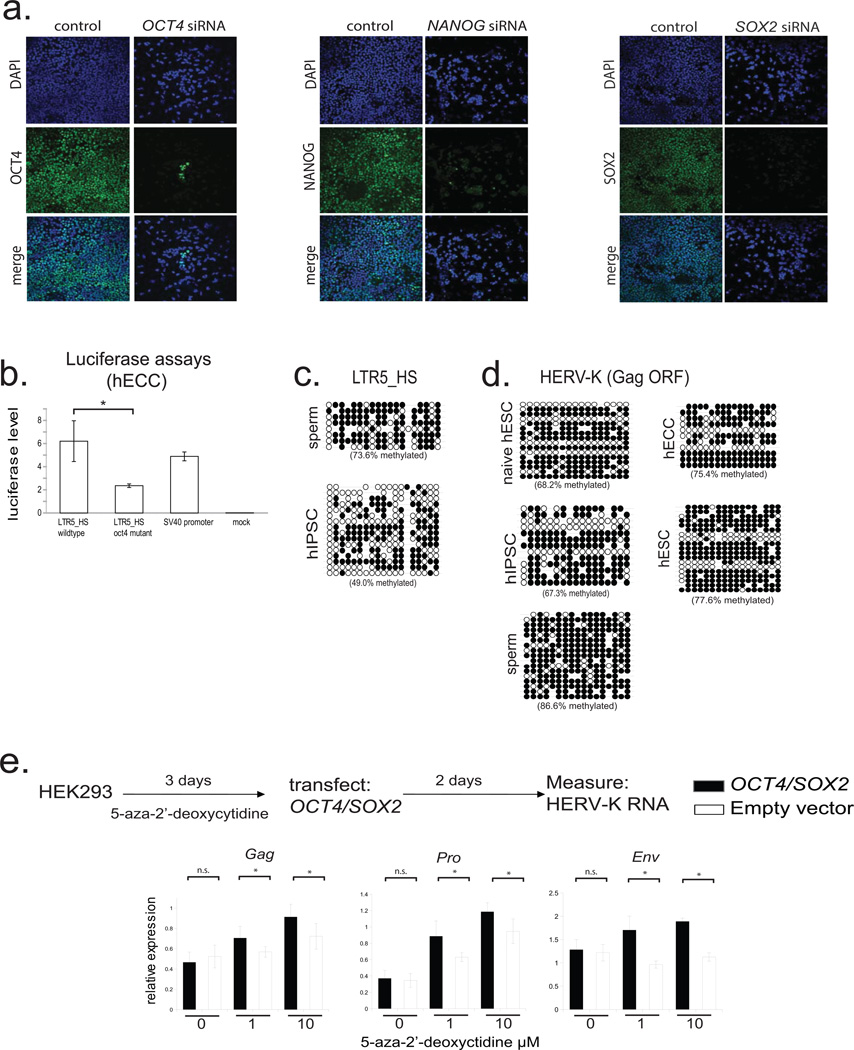
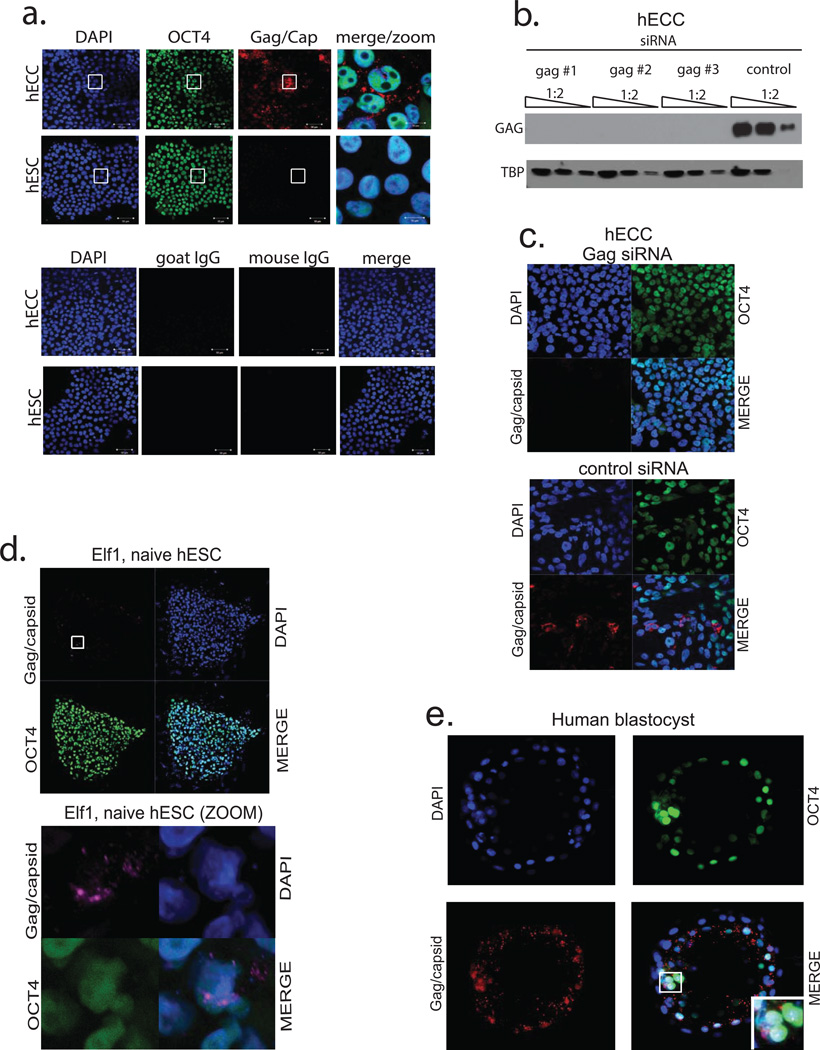
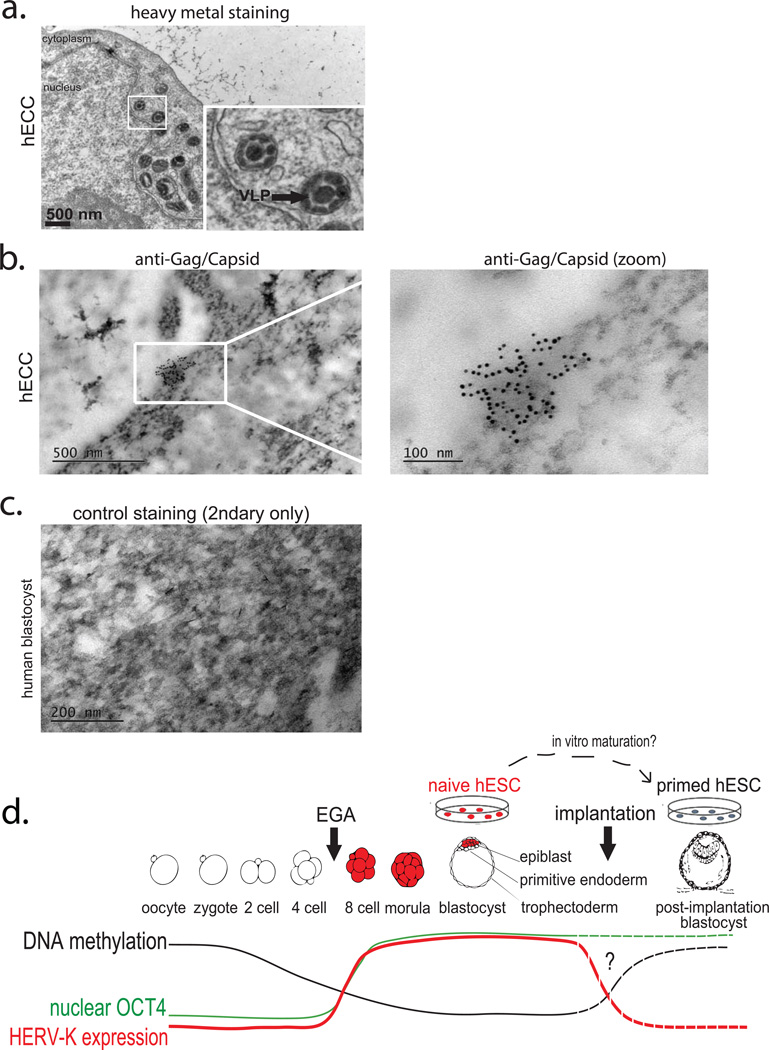
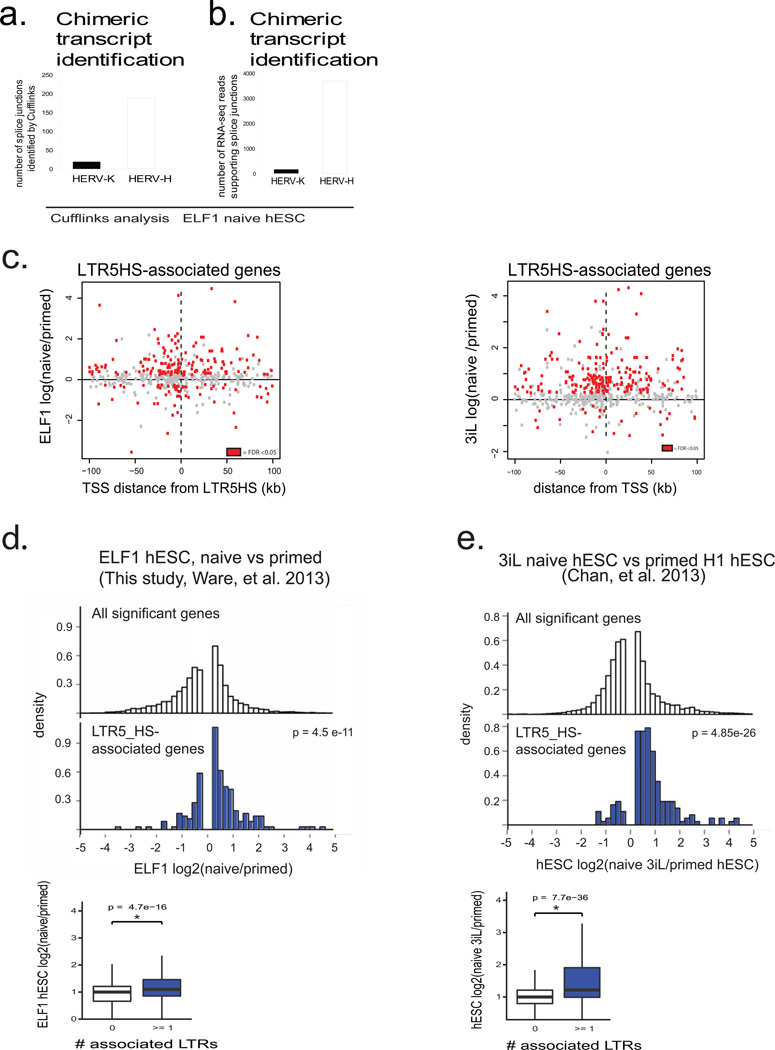
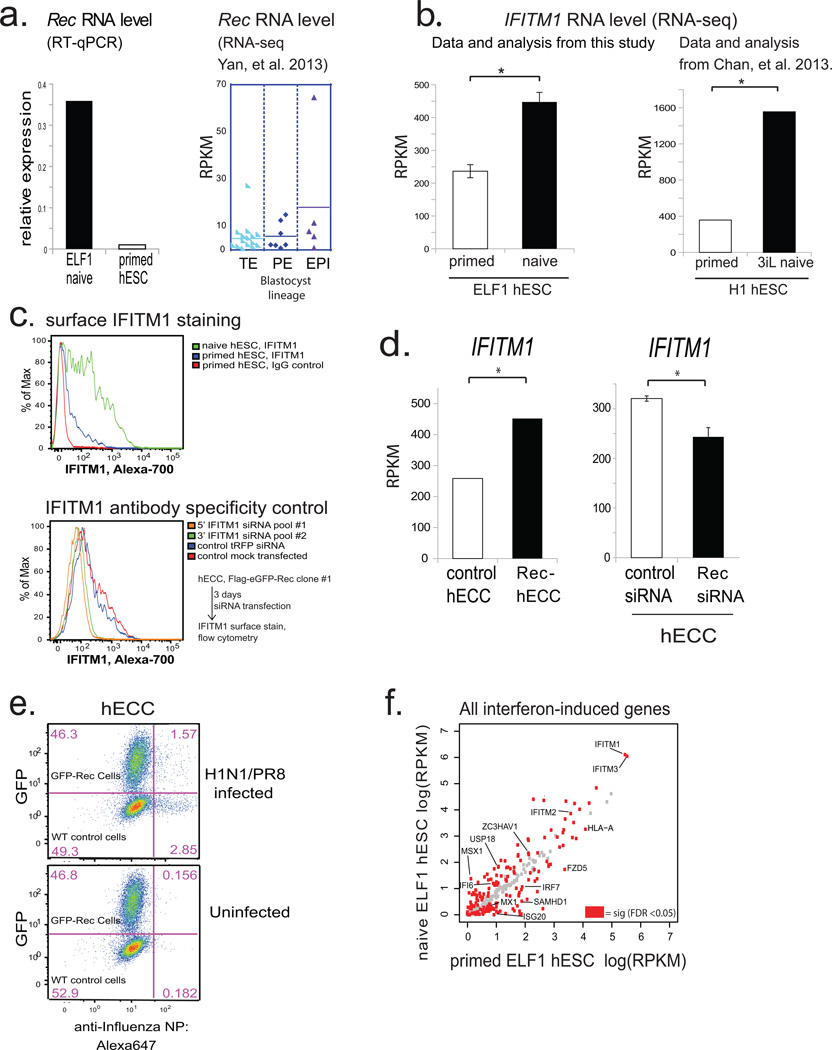
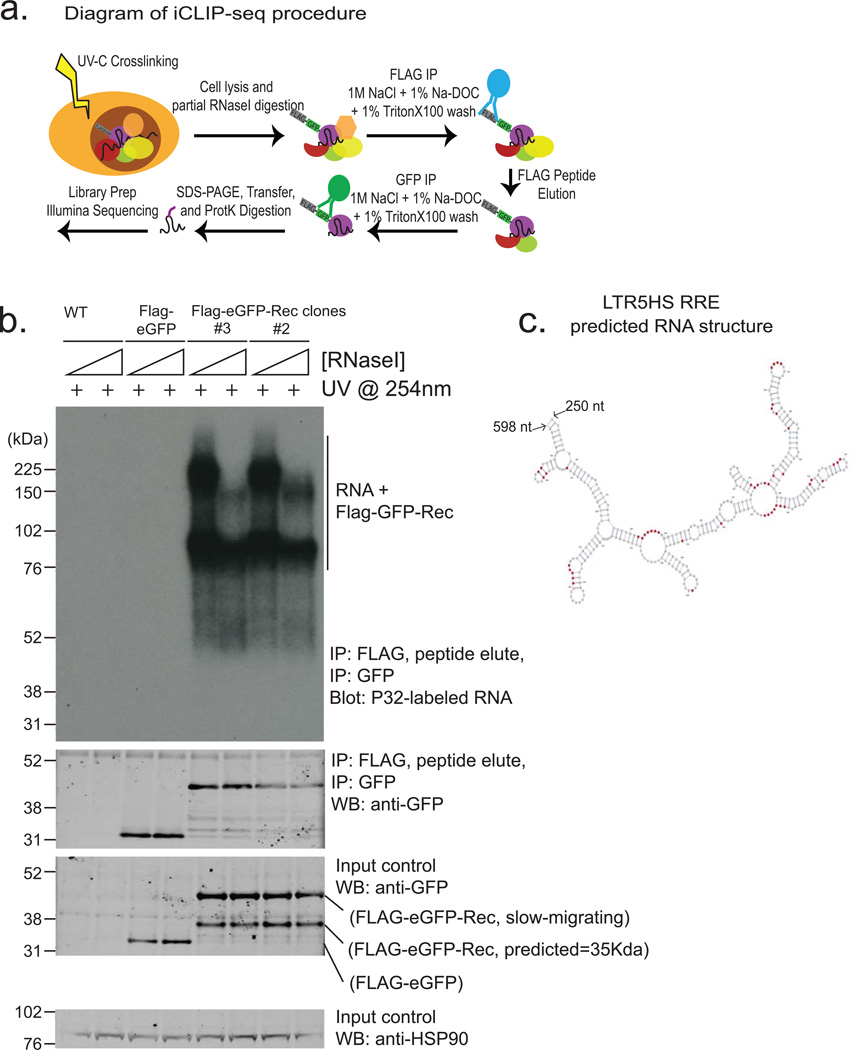
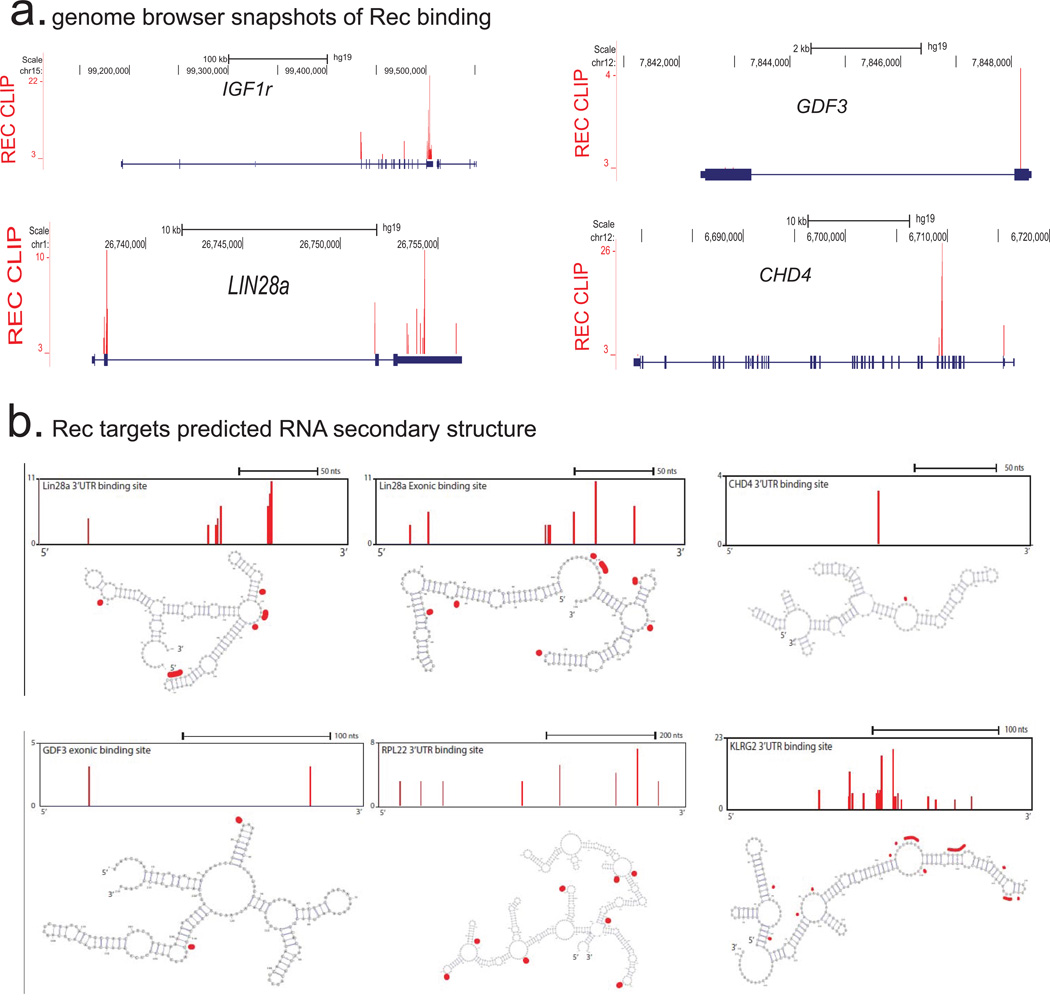
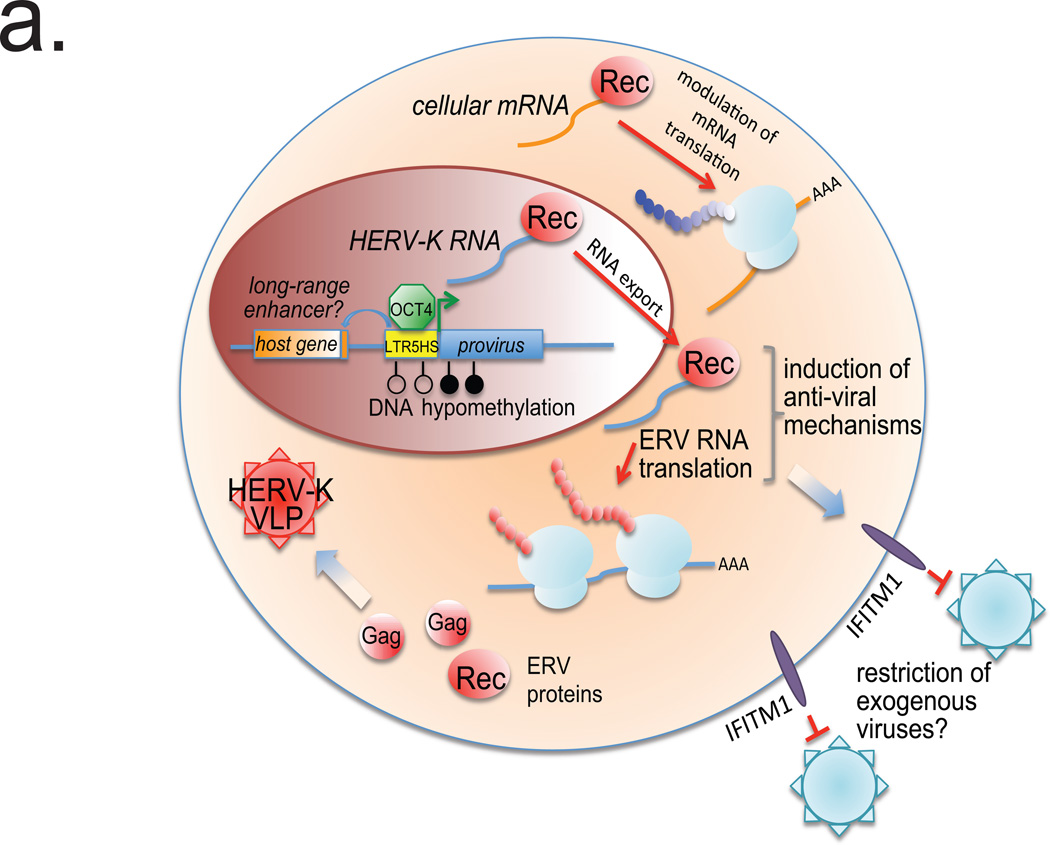
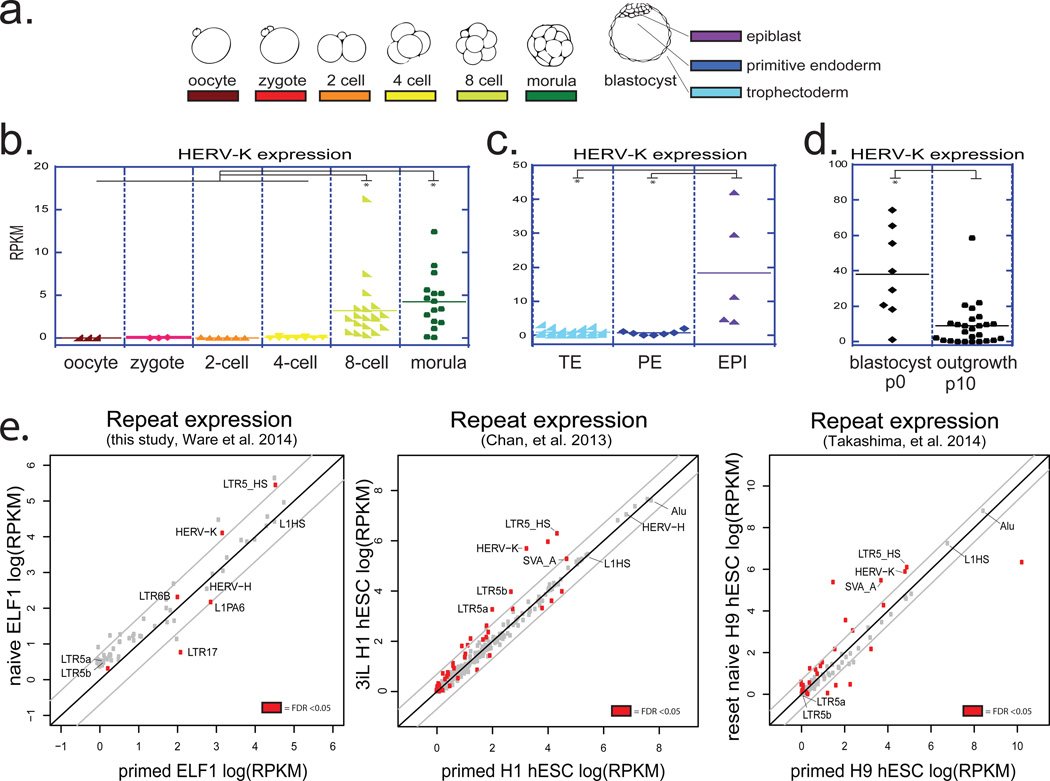
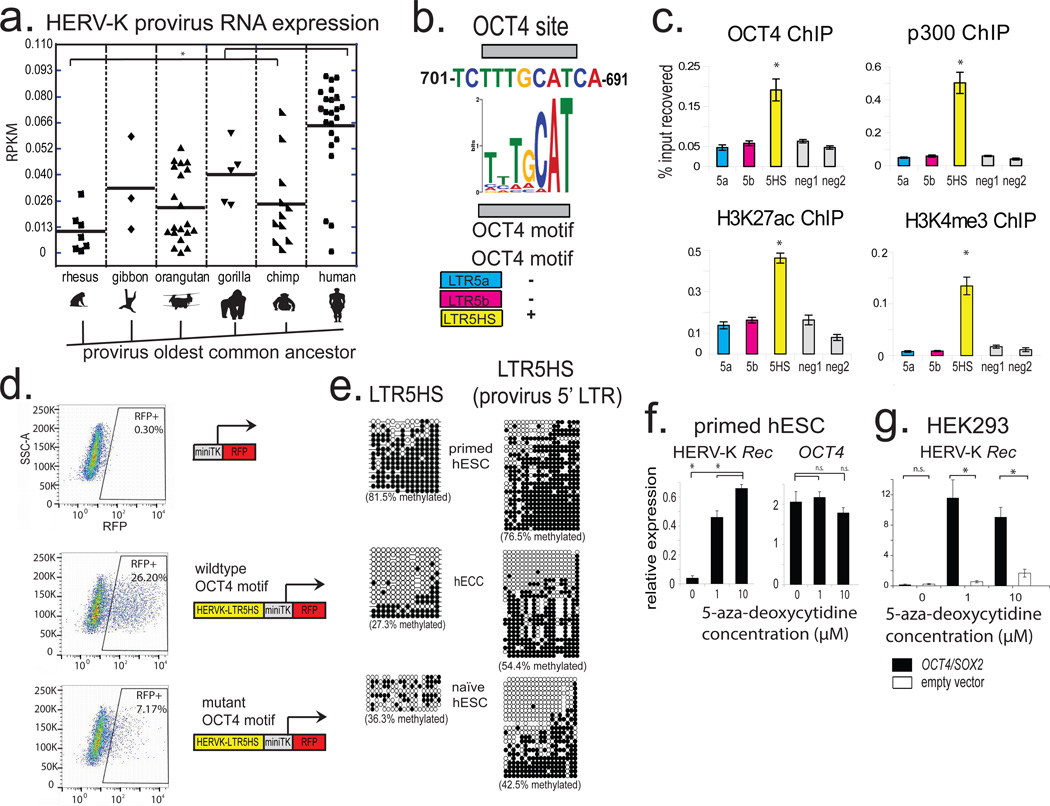
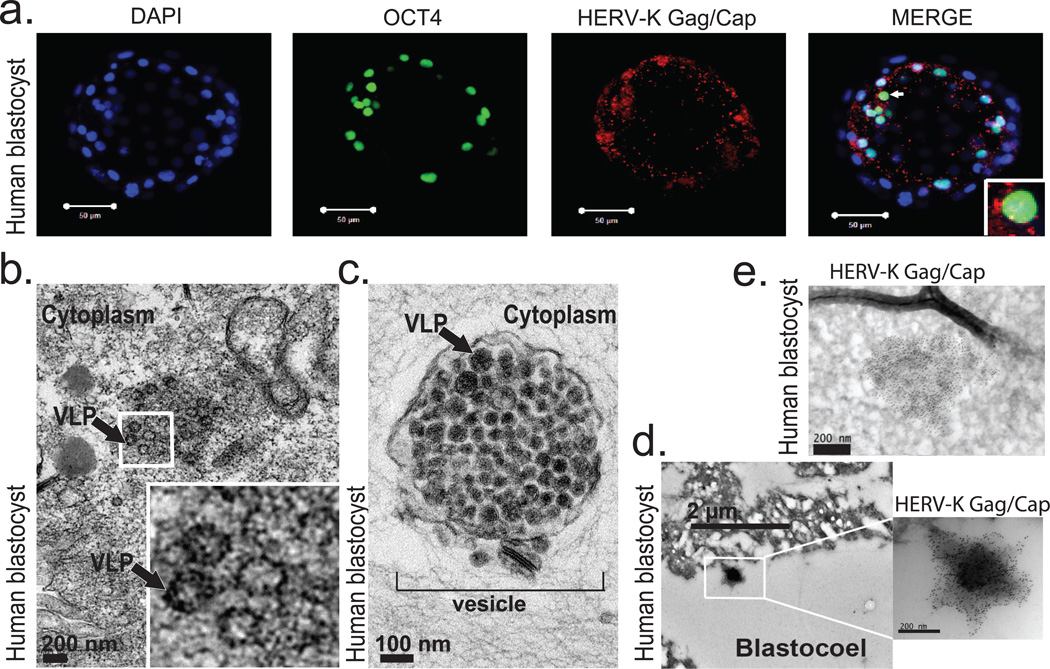
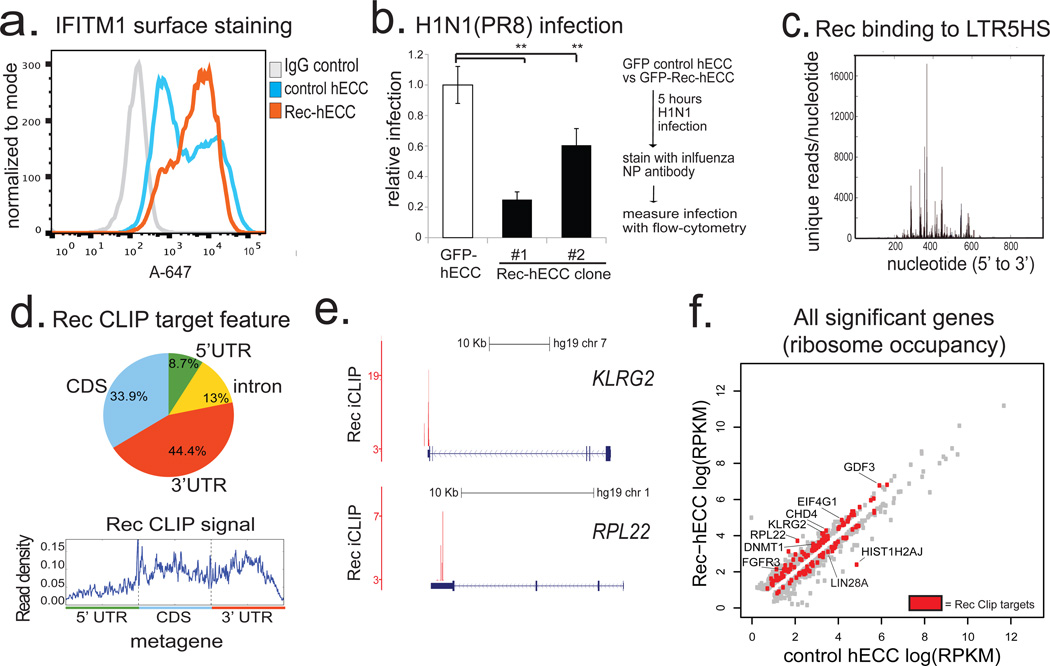
Endogenous retroviruses (ERVs) are remnants of ancient retroviral infections, and comprise nearly 8% of the human genome. The most recently acquired human ERV is HERVK(HML-2), which repeatedly infected the primate lineage both before and after the divergence of the human and chimpanzee common ancestor. Unlike most other human ERVs, HERVK retained multiple copies of intact open reading frames encoding retroviral proteins. However, HERVK is transcriptionally silenced by the host, with the exception of in certain pathological contexts such as germ-cell tumours, melanoma or human immunodeficiency virus (HIV) infection. Here we demonstrate that DNA hypomethylation at long terminal repeat elements representing the most recent genomic integrations, together with transactivation by OCT4 (also known as POU5F1), synergistically facilitate HERVK expression. Consequently, HERVK is transcribed during normal human embryogenesis, beginning with embryonic genome activation at the eight-cell stage, continuing through the emergence of epiblast cells in preimplantation blastocysts, and ceasing during human embryonic stem cell derivation from blastocyst outgrowths. Remarkably, we detected HERVK viral-like particles and Gag proteins in human blastocysts, indicating that early human development proceeds in the presence of retroviral products. We further show that overexpression of one such product, the HERVK accessory protein Rec, in a pluripotent cell line is sufficient to increase IFITM1 levels on the cell surface and inhibit viral infection, suggesting at least one mechanism through which HERVK can induce viral restriction pathways in early embryonic cells. Moreover, Rec directly binds a subset of cellular RNAs and modulates their ribosome occupancy, indicating that complex interactions between retroviral proteins and host factors can fine-tune pathways of early human development.


Figures

Extended Data Figure 1
Extended Data Figure 1. Additional single-cell RNA-seq data analyses from pre-implantation human embryos (supporting Fig.1)
a) Heat map and hierarchical K-means clustering of highly expressed (average RPKM>6 across 89 embryo libraries) repetitive elements in single cells of human preimplantation embryos at indicated developmental stages (top) and HERV-K expression (bottom) using indicated datasets. b) HERV-H expression (RPKM) in single cells of human embryos at indicated preimplantation stages. Solid line = mean. RNA-seq from Yan, et al. 2013. c) HERV-H expression (RPKM) in single cells of human blastocysts, grouped by lineage, solid line = mean. Oocyte (n=3), zygote (n=3), 2C (n=6), 4C (n=11), 8C (n=19), mor (n=16), TE (n=18), PE (n=7), EPI (n=5), p0 (n=8), p10 (n=26). RNA-seq dataset was from Yan, et al. 2013. d) Genome browser snap-shot showing 100bp-PE-RNA-seq reads from ELF1 naïve hESC cells aligning at the HERV-K 108 provirus on chromsome 7.
Extended Data Figure 2
Extended Data Figure 2. LTR5 alignments, HERV-K expression data in cell lines, and control ChIP-qPCR analyses in primed hESC (supporting Fig. 2)
a) Top: Presence of HERV-K (HML-2) sequences in Old World Primates, but absence in New World Primates. Middle: Schematic of HERV-K proviral genome; all human-specific insertions contain LTR5HS. Bottom: Phylogenetic relationship of HERV-K LTR sub-classes showing high degree of sequence similarity. Abbreviations: Gag = group specific antigen, Pro = protease, Pol= polymerase, Env= envelope, LTR= long terminal repeat, Rec = HERV-K accessory protein produced from a doubly-spliced subgenomic transcript. Bottom: ClustLW multiple sequence alignment of indicated HERV-K LTR sequences (top), region around OCT4 motif is boxed, phylogenetic tree (bottom) indicating presence/absence of OCT4 motif. b) HERV-K protein expression in hECCs and hESCs. Protein extracts from hECCs (NCCIT) and hESC (H9) were analyzed by immunoblotting with an antibody detecting HERV-K Gag precursor and the processed Capsid (top), or glycosylated, unprocessed form of HERV-K envelope protein Env (bottom). Tata-binding protein (TBP) was used as a loading control. Shown is a representative result of three independent experiments. c) RT-qPCR analysis of HERV-K RNA expression in hECC line NCCIT, hESC line H9, and HEK293 cells. Three distinct qPCR amplicons, corresponding to Env, Gag and Pro are shown. Samples were normalized to 18s rRNA levels. * denotes p-value <0.05, one-sided t-test, error bars= +/− 1 SD, n=3 biological replicates. d) HERV-K Gag or Env expression in male hESC lines HSF-1, HSF-8, female hESC H9 and hECC line NCCIT. e) RT-qPCR analysis of HERV-K transcripts after siRNA knockdown of NANOG, OCT4, or SOX2 in hECC (NCCIT). Signals were normalized to 18s rRNA. * denotes p-value <0.05, one sided t-test compared to control siRNA, n=3 biological replicates, error bars are +/− 1 S.D. f) ChIP-qPCR analyses of hESCs (H9) with indicated antibodies. Signals were interrogated with primer sets for positive control regions (active hESC OCT4 and SOX2 enhancers), LTR5HS, or non-repetitive, intergenic negative regions, as indicated at the bottom. Shown is a representative result of two biological replicates.
Extended Data Figure 3
Extended Data Figure 3. HERV-K regulation by OCT4 and DNA methylation (supporting Fig. 2)
a) Transcription factor knockdown in hECCs (NCCIT). Cells were transfected with siRNA pools targeting indicated TFs and protein depletion was measured by immunofluoresence with respective antibodies in comparison to control, mock-transfected cells. DAPI (blue), OCT4 (green, left), NANOG (green, middle), SOX2 (green, right). Shown is one of three representative fields of view. b) Dual luciferase assays with indicated reporter constructs in hECCs (NCCIT) showing that mutation of OCT4 site decreases reporter activity. N=3 biological replicates, error-bars = +/− 1 S.D.* = p-value <0.05, one-sided t-test. SV40 enhancer/promoter construct was used as a positive control. c) Bisulfite sequencing for indicated cell types (WT33 hIPSC) analyzing consensus LTR5HS-specific amplicon as in Fig. 2f. d) Bisulfite sequencing analysis of HERV-K proviral consensus amplicon containing 3' end of LTR, primer binding site, and 5' region of Gag ORF (see Extended Data Fig. 2a) in indicated cell types: ELF1 naïve, hESC, WT33 hIPSC, NCCIT hECC, or H9 hESC. e) RT-qPCR analysis of HERV-K RNA levels in HEK293 cells treated with indicated concentrations of 5-aza-2'-deoxycytidine for three days, followed by transfection with OCT4/SOX2 expression constructs and RNA collection 48h after transfection. qPCR primer sets designed to 3 independent amplicons of HERV-K. *denotes p-value <0.05, one-sided t-test, n=4 biological replicates, error bars +/− 1 SD.
Extended Data Figure 4
Extended Data Figure 4. HERV-K Gag/Capsid antibody validation and staining (supporting Fig. 3)
a) Immunofluorescence analysis of hECCs (NCCIT) and hESCs (H9) stained with DAPI (blue), OCT4 (green), Gag/Capsid (red), or IgG control (bottom). White boxes indicate regions shown in higher magnification/merge (right) Shown are representative fields of three independent experiments. b) Sensitivity of HERV-K Gag/Capsid antibody immunoblot signal to HERV-K knockdown. hECCs were transfected with one of three independent siRNA pools targeting HERV-K Gag or with a control, non-targeting pool (synthesized against RFP) and total protein was analyzed by immunoblotting with anti-Env and anti-Gag/Capsid antibodies. 1:2 serial dilution of total protein was loaded, as indicated. Blots were stripped and re-probed with TBP as a loading control. Shown is a representative result of two independent experiments. c) Sensitivity of HERV-K Gag/Capsid antibody immunofluorescence signal to siRNA knockdown of Gag/Capsid (top) or control siRNA targeting RFP (bottom). Shown is a representative result of three fields of view. d) Immunoflourescence of naïve ELF1 hESC with antibodies against OCT4 (green), HERV-K Gag/Capsid (pink), DAPI in blue. Region marked with white box on left is shown with larger magnification (bottom). e) Another representative example of immunoflourescence of human blastocyst with DAPI (blue), OCT4 (green), Gag/Capsid (red) shown (n=19 blastocysts), DPF=5–6.
Extended Data Figure 5
Extended Data Figure 5. TEM analyses of hECCs and control embryo staining (supporting Fig. 3)
a) TEM analysis of hECCs (NCCIT) with heavy metal staining, arrow indicates VLPs. Boxed region is shown with higher magnification in an inset. Scale bar = 500 nm. Shown is a representative example of two independent experiments. b) TEM immuno-gold labeling of hECC (NCCIT) with Gag/Capsid antibodies. Shown is a representative example from 2 independent experiments. c) Secondary only control for Immuno-gold labeling of human blastocysts. Shown is a representative example from 8 fields of view. d) Model figure summarizing HERV-K transcriptional regulation in human embryos and in vitro cultured pluripotent cells. Dashed lines indicate inference of OCT4, DNA methylation and HERV-K level changes at implantation from those observed between naïve and primed hESCs, in the absence of data from actual postimplantation human embryos.
Extended Data Figure 6
Extended Data Figure 6. Correlation of HERV-K LTR5HS elements with gene expression (supporting Fig. 4)
a) Number of splice junctions identified linking indicated HERV class to annotated ReqSeq genes. Analysis was done using RNA-seq dataset from ELF1 naïve hESC, n= 3 biological replicates. b) Number of reads supporting chimeric transcripts from indicated HERV class in ELF1 naïve hESC, n =3 biological replicates. c) Expression of LTR5_HS linked genes plotted as a function of distance to the gene's TSS. X axis: distance of TSS from the nearest LTR5_HS in kb; Y axis: fold change in expression in ELF1 naive vs primed hESC (this study, left) the 3iL versus primed H1 hESC (right, Chan et al. 2013). d) Top panel: Histograms showing expression of all genes that significantly change in expression between naïve and primed ELF1 hESC (top histogram, white) or significantly changed genes that are LTR5_HS associated (bottom histogram, blue); expression values from naïve vs primed ELF1 hESC RNA-seq datasets (FDR <0.05 DESeq). Fischer's exact test gives indicated p-value indicating enrichment of LTR5HS linked genes in naïve upregulated category. Bottom panel: quantification of average expression of LTR5HS-linked (blue) or unlinked (white) genes. Non-paired Wilcoxon test with stated p-value indicating that genes linked to 1 or more LTR5HS have significantly higher mean expression. e) Top panel: Histograms showing expression of all genes that significantly change in expression between 3iL and primed H1 hESC (top histogram, white) or significantly changed genes that are LTR5_HS associated (bottom histogram, blue); expression values from RNA-seq datasets reported by Chan, et al. 2013, FDR <0.05 DESeq. Fischer's exact test gives indicated p-value indicating enrichment of LTR5HS linked genes in naïve upregulated category. Bottom panel: quantification of average expression of LTR5HS-linked (blue) or unlinked (white) genes. Non-paired Wilcoxon test with stated p-value indicating that genes linked to 1 or more LTR5HS have significantly higher mean expression.
Extended Data Figure 7
Extended Data Figure 7. Rec and IFITM1 expression in naïve hESC, and effect of Rec expression on H1N1(PR8) infection (supporting Fig. 4)
a) (left) RT-qPCR analysis of HERV-K Rec expression levels in ELF1 naïve hESC (n=3 biological replicates) or H9 primed hESC(one biological replicate). Normalized to 18s rRNA. Right, Rec RNA levels in indicated blastocyst lineages, solid line= mean; data from Yan, et al. 2013. b) RNA-seq quantification of IFITM1 RNA levels in naïve or primed ELF1 hESC (left) or 3iL hESC versus primed H1 hESC from Chan, et al. 2013 (right). N= 3 biological replicates for each condition, error-bars = +/− 1 S.D. * indicates significance at FDR<0.05, DESeq. c) Flow-cytometry for surface-localized IFITM1 staining in the indicated H9 hESC or naïve ELF1 hESC (top panel) or, as a control for IFITM1 antibody specificity, knockdown of IFITM1 with two independent IFITM1 siRNA pools compared to control siRNA treated cells in FLAG-eGFP-Rec-hECCs (bottom panel). d) Left: IFITM1 expression in control hECC vs Rec-hECC (NCCIT) RNA-seq datasets. N = 2 biological replicates. Significance = FDR<0.05, DESeq. Right: IFITM1 expression in control siRNA vs Rec siRNA-treated hECC (NCCIT) RNA-seq. N= 3 biological replicates, error-bars = +/− 1 S.D. Significance = FDR<0.05, DESeq. e) Flow-cytometry profiles for indicated cell types in H1N1(PR8) infected (top) or non-infected (bottom) wildtype (WT) control hECC or FLAG-GFP-Rec-hECC, clone #1. Shown is one representative example of 4 independent experiments showing a co-plating experiment in which GFP-Rec cells and wildtype control (GFP negative) cells are infected in the same well, stained in the same tube and identified by GFP fluorescence after gating for FSC and SSC. f) Scatterplot of ELF1 naïve vs primed hESC RNA-seq showing all interferon induced genes, with differentially regulated genes (FDR<0.05 DESeq, n= 3 biological replicates each) highlighted in red. There is a significant overlap between differentially regulated genes and interferon-induced genes as measured by a hypergeometric test (p-value <0.05).
Extended Data Figure 8
Extended Data Figure 8. iCLIP analysis of Rec-associated RNAs (supporting Fig. 4)
a) Diagram of iCLIP-seq procedure (see Methods for details). Briefly, cells are crosslinked using UV, lysed and digested with RNAse to trim RNAs. Sequential immunopurification is performed using FLAG M2, peptide elution, and GFP IP. After stringent washing, RNAs are recovered and either radiolabeld (shown in Extended Data Fig. 8b) or reverse transcribed and prepared for Illumina HTPS libraries. b) Autoradiogram of labeled RNAs (top panel) recovered from UV-crosslinked cells using sequential Flag-eGFP IP from: wildtype hECC (lanes 1, 2), Flag-eGFP control hECC (lanes 3,4),or two independent Rec-hECC transgenic lines (lanes 5–8), separated on an SDS-PAGE gel. Free Rec protein runs as a ∼35 kDa band, while Rec protein crosslinked to RNA molecules show lower electrophoretic mobility. Please note that: i) Rec-bound RNAs are resistant to even high concentrations of RNAseI, likely indicating extensive secondary RNA structures, and (ii) low/no background of contaminating RNAs in control IP from wildtype hECCs or Flag-eGFP control hECC. Western blots with anti-GFP antibody were also performed to confirm the presence of tagged protein in Flag-eGFP control and Flag-eGFP-Rec cells, both in input and IP fractions (middle panels). HSP90 was used as a loading control (bottom panel). c) Computationally predicted (using mFold) secondary structure of LTR5HS sequence around the Rec-response element, (identified experimentally in vitro by Lower, et al.1997). Single nucleotide resolution Rec UV-crosslinking sites determined by iCLIP are shaded in red; (n=2 biological replicates).
Extended Data Figure 9
Extended Data Figure 9. Rec target mRNA analysis (supporting figure 4)
a) Genome browser representations of the Rec iCLIP read (n=2 biological replicates) distribution at indicated mRNA targets b) Computationally predicted (using mFold) secondary structures of indicated Rec iCLIP-seq targets. Single nucleotide resolution Rec UV-crosslinking sites determined by iCLIP are shaded in red; to orient the reader, browser representation of the folded fragment is shown above each respective cartoon.
Extended Data Figure 10
Extended Data Figure 10. model figure (supporting figure 1–4)
a. Model figure summarizing HERV-K regulation and function.
Figure 1
Figure 1. Transcriptional reactivation of HERV-K in human preimplantation embryos and naïve hESC
a) schematic of human preimplantation development. b) HERV-K expression in single cells of human embryos at indicated stages. Solid line = mean. Oocyte (n=3), zygote (n=3), 2C (n=6), 4C (n=11), 8C (n=19), morula (n=16). (panels b,c,d; Yan et al., 2013). * denotes p-value <0.05, non-paired Wilcoxon test. c) HERV-K expression in single cells of human blastocysts, grouped by lineage. Solid line = mean. TE (n=18), PE (n=7), EPI (n=5). Abbreviations: TE=trophectoderm, PE=primitive endoderm, EPI=epiblast. d) HERV-K expression in single cells of blastocyst outgrowths (passage 0) or hESCs at passage 10. Solid line = mean. p0 (n=8), p10 (n=26). e) Analysis of the repetitive transcriptomes of three, genetically matched naive/primed hESC pairs. Left: naïve/primed ELF1 hESC (this study; Ware, et al. 2014) (n= 3 biological replicates for both conditions). Middle: 3iL/primed H1 hESC (Chan, et al. 2013) (n=3 biological replicates for both conditions). Right: naïve/primed H9 hESC (Takashima, et al. 2014, right) (n=3 biological replicates for both conditions). Significant repeats indicated in red at FDR <0.05, DESeq.
Figure 2
Figure 2. Transactivation by OCT4 and DNA hypomethylation of LTR5HS synergistically regulate HERV-K transcription
a) Expression of different HERV-K proviral sequences, grouped according to the oldest common ancestor, as defined by Subramanian et al. 2011. * denotes p-value <0.05, non-paired Wilcoxon test. Solid line = mean. RNA-seq dataset used for the analysis was from 3iL naïve H1 cells (Chan et al. 2013); n= 3 biological replicates. b) Conserved OCT4 site in LTR5HS with position weight matrix of the corresponding motif shown for comparison (top). Presence/absence of OCT4 motif in distinct LTR5 sequences is indicated (bottom); more detailed sequence information in Extended Data Fig. 2a. c) ChIP-qPCR analyses from hECCs (NCCIT) using antibodies indicated on top of each graph. Signals were quantified using primer sets specific to LTR5HS, LTR5a, and LTR5b consensus sequences or two “negative” intergenic, non-repetitive regions. * denotes p-value <0.05 compared to negative control, one sided t-test, n=4 biological replicates, error bars are +/− 1 S.D. d) Flow cytometry analysis of hECCs with integrated LTR5HS fluorescent reporters, either wild type (middle) or with OCT4 motif mutation (bottom). RFP positive population was gated using side-scatter area (SSC-A) and cells with integrated negative control reporter (top). Shown is a representative result of two independent experiments. e) Bisulfite conversion quantification of LTR5HS 5-methyl-cytosine levels measured using LTR5HS-specific primer pairs anchored in the LTR5HS consensus sequence (left) or provirus-specific 5' LTR5HS (right) for hECCs (NCCIT) or hESCs (H9) or naïve hESC (ELF1). Filled circles depict modified cytosines, empty circles depict unmodified cytosines. hECC (NCCIT) and naïve hESC (ELF1) are less methylated than hESC (H9), p <0.05, non-paired Wilcoxon test. f) RT-qPCR analysis of hESC (H9) treated with indicated concentrations of 5-aza-2'-deoxycytidine for 24 hours. *denotes p-value <0.05, one-sided t-test, n=3 biological replicates, error bars +/− 1 SD. g) RT-qPCR analysis of HERV-K Rec RNA levels in HEK293 cells treated with indicated concentrations of 5-aza-2'-deoxycytidine, followed by transfection with OCT4/SOX2 expression constructs. *denotes p-value <0.05, one-sided t-test, n=4 biological replicates, error bars +/− 1 S.D.
Figure 3
Figure 3. Human blastocysts contain HERV-K proteins and viral-like particles
a) Immunofluorescence of human blastocysts (days post fertilization, DPF =5–6) stained with DAPI (blue), OCT4 antibody (green), and HERV-K Gag/Capsid antibody (Red). Images show a representative example (n=19 embryos). Scale bar = 50 microns, 1 micron confocoal z-slice. White arrow points to an OCT4+ cell, surrounded by cytoplasmic Gag/Capsid, which is shown with higher magnification in an inset. b) Heavy metal staining transmission electron microscopy (TEM) of human blastocyst, arrow denotes putative VLP (found in n=2/3 blastocysts, DPF=5–6). Higher magnification of indicated region shown in inset. Scale bar = 200nm. c) Heavy metal staining TEM of human blastocyst, arrow denotes putative immature VLP, bracket indicates vesicle filled with putative VLP, (found in n=2/3 blastocysts, DPF=5–6). Scale bar = 100 nm. d-e) Immuno-TEM of human blastocysts with Gag/Capsid staining, region of higher magnification is boxed. Representative examples of budding (d) and cell-internal (e) particles are shown; n =3 blastocysts (DPF=5–6), n=3 labeled particles in 2 embryos.
Figure 4
Figure 4. HERV-K accessory protein Rec upregulates viral restriction pathway and engages cellular mRNAs
a) Flow cytometry histograms of IFITM1 surface staining in control hECC or Rec-hECC (NCCIT) cells, histogram of negative control cells stained with isotype IgG+Alexa-647 secondary is shown for comparison. Shown is a representative result of two independent experiments. b) H1N1(PR8) influenza infection of control GFP-hECC cells or two clonal lines of Rec-hECC (NCCIT). Control cells were set as 100%, shown is aggregate results from 2 independent experiments, n=8 total biological replicates for each condition. Error bars are +/− 1 S.D. ** denotes p-value <0.005, one-sided t-test. c) Rec iCLIP reads mapped to the LTR5HS sequence, n= 2 biological replicates. d) Distribution of Rec binding sites on endogenous mRNAs (top) and aggregate Rec iCLIP-seq signal on a metagene (bottom), n=2 biological replicates. e) Distribution of Rec iCLIP reads at representative target mRNAs KLRG2 (top), RPL22 (bottom); y-axis, iCLIP score, at cut-off = 3 (see Methods for details) f) Ribosome profiling signal for all significant genes (FDR<0.05 Cuffdiff) in wildtype hECC cells vs Rec-hECC (NCCIT), n=4 biological replicates. Rec iCLIP targets are colored in red

References

    1. Stoye JP. Studies of endogenous retroviruses reveal a continuing evolutionary saga. Nat. Rev. Microbiol. 2012;10:395–406. - PubMed
    1. Belshaw R, et al. Long-term reinfection of the human genome by endogenous retroviruses. Proc. Natl. Acad. Sci. U. S. A. 2004;101:4894–4899. - PMC - PubMed
    1. Barbulescu M, et al. Many human endogenous retrovirus K (HERV-K) proviruses are unique to humans. Curr. Biol. 1999;9 861–S1. - PubMed
    1. Subramanian RP, Wildschutte JH, Russo C, Coffin JM. Identification, characterization, and comparative genomic distribution of the HERV-K (HML-2) group of human endogenous retroviruses. Retrovirology. 2011;8:90. - PMC - PubMed
    1. Herbst H, Sauter M, Mueller-Lantzsch N. Expression of human endogenous retrovirus K elements in germ cell and trophoblastic tumors. Am. J. Pathol. 1996;149:1727–1735. - PMC - PubMed

Additional references

    1. Chavez SL, Meneses JJ, Nguyen HN, Kim SK, Pera RAR. Characterization of Six New Human Embryonic Stem Cell Lines (HSF7, −8, −9, −10, −12, and −13) Derived Under Minimal-Animal Component Conditions. Stem Cells Dev. 2008;17:535–546. - PubMed
    1. Boyer LA, et al. Core Transcriptional Regulatory Circuitry in Human Embryonic Stem Cells. Cell. 2005;122:947–956. - PMC - PubMed
    1. Peng JC, et al. Jarid2/Jumonji Coordinates Control of PRC2 Enzymatic Activity and Target Gene Occupancy in Pluripotent Cells. Cell. 2009;139:1290–1302. - PMC - PubMed
    1. Myers JWJEF., Jr . In: RNA Silencing. Carmichael GG, editor. Humana Press; 2005. pp. 93–196. at < http://link.springer.com/protocol/10.1385/1-59259-935-4%3A093>. - DOI
    1. Chavez SL, et al. Dynamic blastomere behaviour reflects human embryo ploidy by the four-cell stage. Nat. Commun. 2012;3:1251. - PMC - PubMed

Publication types

MeSH terms

Associated data