

The first murine zygotic transcription is promiscuous and uncoupled from splicing and 3' processing
- PMID: 25896510
- PMCID: PMC4474528
- DOI: 10.15252/embj.201490648
The first murine zygotic transcription is promiscuous and uncoupled from splicing and 3' processing
Abstract
Initiation of zygotic transcription in mammals is poorly understood. In mice, zygotic transcription is first detected shortly after pronucleus formation in 1-cell embryos, but the identity of the transcribed loci and mechanisms regulating their expression are not known. Using total RNA-Seq, we have found that transcription in 1-cell embryos is highly promiscuous, such that intergenic regions are extensively expressed and thousands of genes are transcribed at comparably low levels. Striking is that transcription can occur in the absence of defined core-promoter elements. Furthermore, accumulation of translatable zygotic mRNAs is minimal in 1-cell embryos because of inefficient splicing and 3' processing of nascent transcripts. These findings provide novel insights into regulation of gene expression in 1-cell mouse embryos that may confer a protective mechanism against precocious gene expression that is the product of a relaxed chromatin structure present in 1-cell embryos. The results also suggest that the first zygotic transcription itself is an active component of chromatin remodeling in 1-cell embryos.
Keywords: RNA‐Seq; gene expression; preimplantation mouse embryo; pre‐mRNA splicing; transcription.
© 2015 The Authors.
Figures
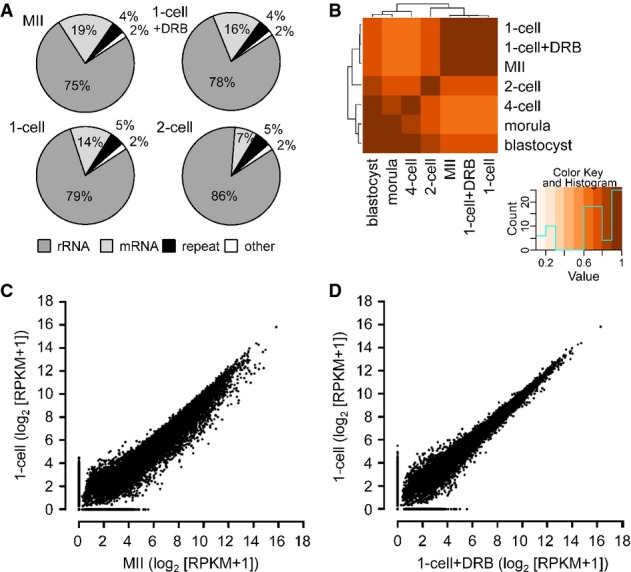
A Composition of selected libraries produced from total RNA. Shown is the proportion of reads matching rRNA-derived transcripts (rRNA), transcripts produced from repeats identified by RepeatMasker (repeat), annotated mRNAs (mRNA), and other sequences (other).
B Hierarchical clustering of 76-nt paired-end datasets from different stages of preimplantation development performed on Spearman correlations between log2 of RPKM values for transcripts.
C, D Comparison of MII and 1-cell transcriptomes (C) and 1-cell and 1-cell + DRB transcriptomes (D). The graph was made by plotting expression values for mRNAs (log2[RPKM + 1]) from 76PE sequencing data. Each point represents one transcript whose position indicates its abundance value in indicated stages. RPKM values were increased by adding 1 in order to obtain log2 values above zero.
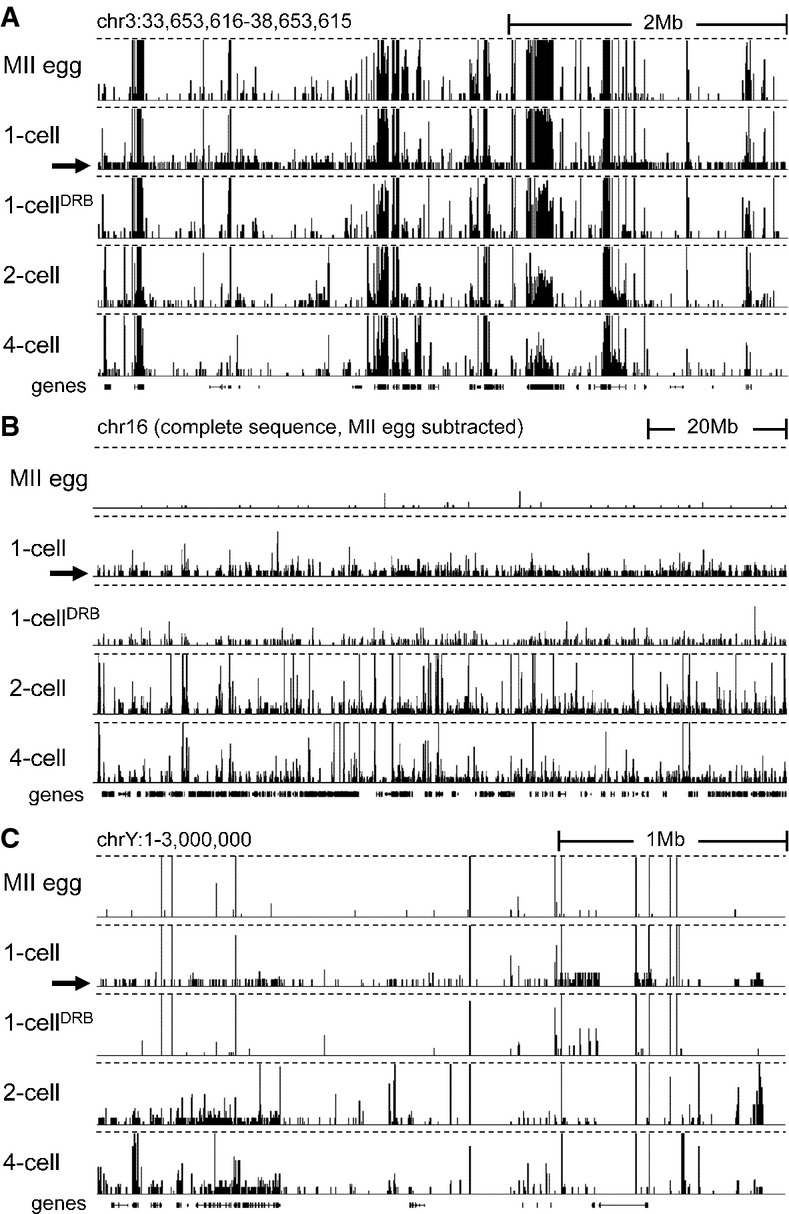
Transcription at the 1-cell stage manifests as increased number of low CPM reads scattered across the genome. Shown are HTS data [a customized screenshot from the UCSC Genome browser (Karolchik et al, 2012)] from different stages mapped into a 5-Mb region of the genome with a variable gene density. The vertical scale was trimmed at 0.5 CPM; trimming is indicated by horizontal dashed lines. Note the appearance of low-density reads in 1-cell embryos (indicated by the black arrow), which are not observed in unfertilized oocytes and 1-cell embryos treated with DRB. Low CPM reads also appear in intergenic regions.
Masking maternally transcribed regions reveals chromosome-wide presence of low CPM reads in 1-cell embryos. A UCSC browser screenshot of the chromosome 16 shows 76PE raw data mapped to the genome upon masking reads derived from oocytes. The vertical scale was trimmed at 20 reads; trimming is indicated by horizontal dashed lines. A small number of reads detected in MII eggs comes from repetitive sequences, which otherwise do not yield signal because of multi-mapping restrictions.
Zygotic transcription from the Y chromosome initiates at the 1-cell stage. Shown are HTS data from different stages mapped into the ˜3-Mb annotated region of the chromosome Y. The vertical scale was trimmed at 0.5 CPM; trimming is indicated by horizontal dashed lines. The residual signal on the chromosome Y in MII eggs and 1-cell embryos treated with DRB is an artifact caused by common retrotransposon-derived sequences (mainly MT-derived).
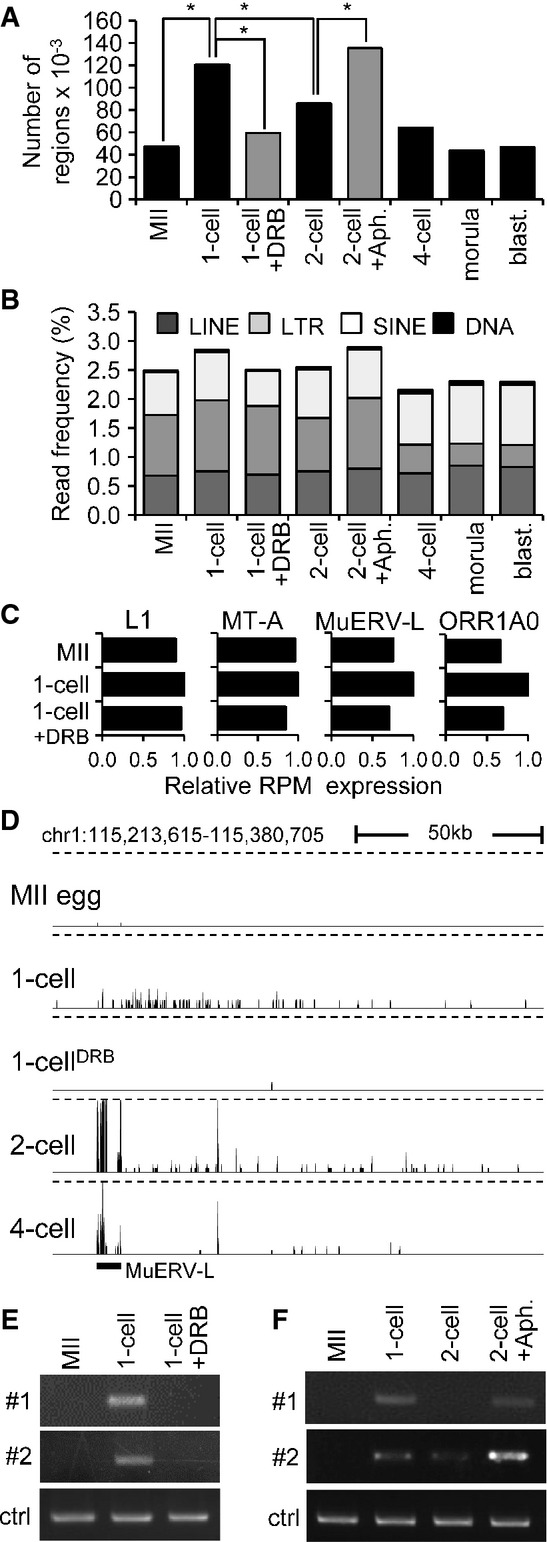
A Quantitative analysis of transcription from intergenic regions in oocytes and preimplantation embryos. Intergenic regions were divided into 1-kb segments across the whole genome, and the number of segments to which at least a single read was uniquely mapped was determined. Results suggest that treatment of 1-cell embryos with DRB reduced the number of segments yielding intergenic transcripts. In contrast, treatment of 2-cell embryos with aphidicolin (Aph.) prevented reduction of the number of segments yielding intergenic transcripts. Bars representing samples treated with DRB and aphidicolin are gray to distinguish results from treated embryos and from the normal course of preimplantation development. An asterisk indicates a significant difference by chi-square test (P < 0.05).
B Frequency of reads derived from mobile elements. Association of reads with a particular class of mobile DNA in each sample was determined by RepeatMasker and is displayed as a percentage of those reads in each library.
C Relative changes of expression of four specific retrotransposons. Relative expression for each retrotransposon was calculated from RPKMs where expression in 1-cell embryos was set to one.
D MuERV-L retrotransposons asymmetrically neighbor higher frequency of low CPM reads in large intergenic regions. Shown is an example of MuERV-L located in an intergenic region, which is not maternally expressed and becomes highly transcribed during zygotic genome activation at the 2-cell stage. A part of its transcription apparently invades almost 150 kb of its genomic flank, whereas the same region downstream of the MuERV-L yields higher frequency of low CPM reads in 1-cell stage in DRB-dependent manner. This pattern is most apparent for MuERV (see also Supplementary Fig S4B), but MT2 and ORR1AO insertions can also produce a similar asymmetric pattern (data not shown). The vertical scale was trimmed at 0.5 CPM; trimming is indicated by horizontal dashed lines.
E, F Validation of intergenic transcription at the 1-cell stage. Two intergenic regions harboring low CPM reads on chromosome 2 in 1-cell embryos were analyzed by RT–PCR. Both loci are annotated in Supplementary Fig S4C. Shown in (E) is RT–PCR analysis of intergenic transcription of two loci (shown in detail in Supplementary Fig S4C) in MII eggs and 1-cell embryos treated with and without DRB. ctrl = RT–PCR of a spiked α-rabbit globin mRNA demonstrating consistent RT–PCR efficiency across samples. Shown in (F) is the effect of inhibiting the second round of DNA replication in intergenic transcription at the 2-cell stage as examined by RT–PCR. Two-cell embryos were treated with aphidicolin (Aph.) 15 h after insemination to inhibit the second round of DNA replication. ctrl = RT–PCR of a spiked rabbit α-globin mRNA demonstrating consistent RT–PCR efficiency across samples. Experiments were performed three times with reproducible results; a representative result is shown (E, F).
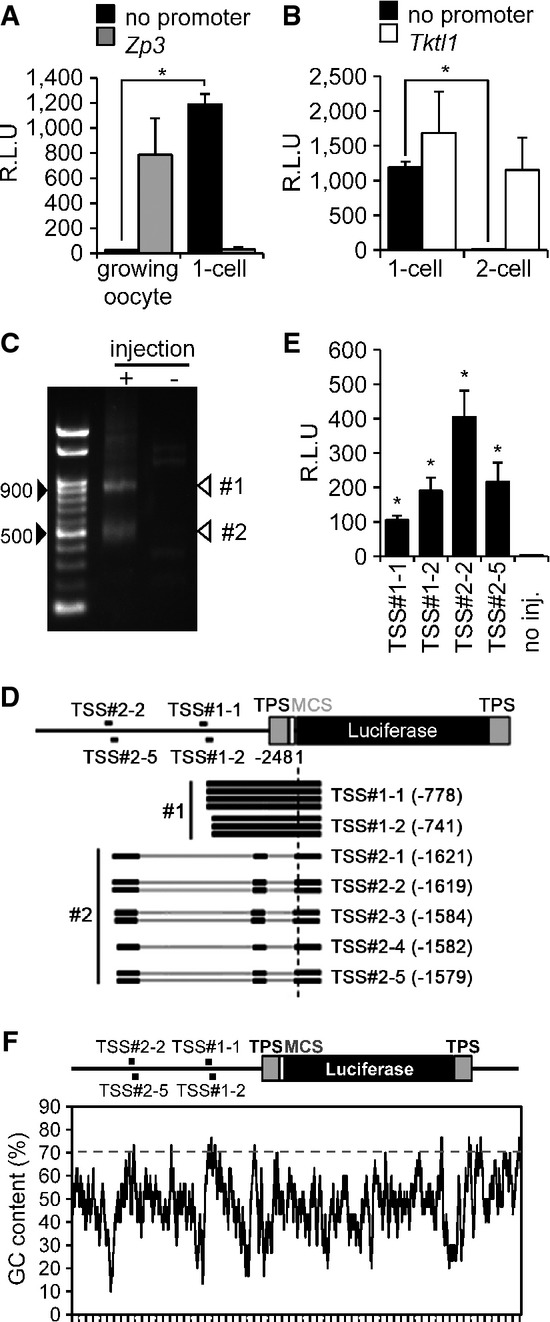
Transcriptional activity in pGL3-Basic vector lacking a promoter in oocytes and 1-cell embryos. pGL3 vector with the Zp3 or no promoter sequence (pGL3-Zp3 or pGL3-Basic vector, respectively) was injected into the nuclei of growing oocytes or the male pronucleus of 1-cell embryos. After 8 h, luciferase activity was measured. Data are expressed as mean ± SEM (n = 3) and were analyzed using Student's t-test. Asterisks indicate significant differences (P < 0.05).
Transcriptional activity in pGL3-Basic vector lacking a promoter in 1-cell and 2-cell embryos. The analysis was performed similarly as in (A), except a pGL3 vector with the Tktl1 promoter (pGL3-Tktl1) replaced pGL3-Zp3 and the experiment was performed in 1-cell and 2-cell embryos. Data are expressed as mean ± SEM (n = 3) and were analyzed using Student's t-test. Asterisks indicate significant differences (P < 0.05).
Determination of the transcriptional start sites (TSSs) of the pGL3-Basic vector by 5′ RACE. The 5′ RACE technique generated two major DNA fragments of ˜900 and 500 bp. Black arrowheads indicate the 500- and 900-bp positions after gel electrophoresis; white arrowheads show the major products of 5′ RACE (TSS#1 and TSS#2).
Schematic depiction of results from sequencing of seven and eight randomly selected RACE-derived cDNA clones of TSS#1 and TSS#2, respectively, which indicated two and five TSSs for TSS#1 (TSS#1-1 and TSS#1-2) and TSS#2 (TSS#2-1, TSS#2-2, TSS#2-3, TSS#2-4, and TSS#2-5), respectively, in the pGL3-Basic vector. Black lines represent the regions of pGL3-Basic vector corresponding to the results of DNA sequencing. Gray bars represent those of pGL3-Basic vector that were not found in the results of DNA sequencing. TPS represents the transcriptional pause site, a polyadenylation signal site. MCS represents the multi-cloning site.
Analysis of promoter activity in the upstream regions of identified TSSs in the pGL3-Basic vector. The 76-bp regions upstream of the TSSs shown in (D) were inserted into the pEluc vector; virtually no luciferase activity is produced in 1-cell embryos microinjected with the pEluc vector (Hamamoto et al, 2014). The vectors were injected into the male pronucleus of 1-cell embryos, and luciferase activity was measured after 8 h. The experiments were performed three times. The data are presented as mean ± SEM and were analyzed using Student's t-test. Asterisks indicate significant differences between the sample without injection (no injection) and the other samples (P < 0.05).
GC content in the pGL3-Basic vector. The percentage GC content was determined using a 30-bp sliding window analysis with a 1-bp shift.
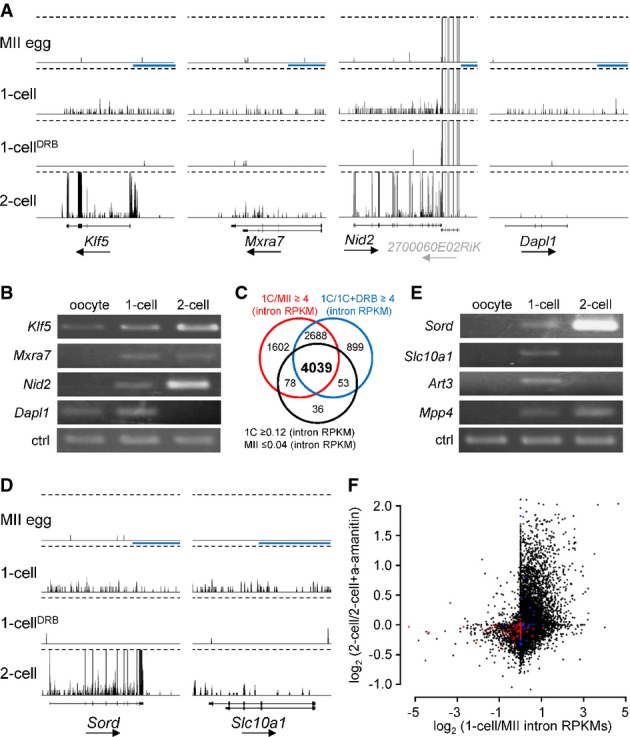
Examples of four genes exhibiting DRB-dependent 1-cell transcription, which were selected using mRNA (exon) RPKM-based filtering. Shown are 76PE HTS data from four different stages visualized in a customized UCSC browser. All sets are shown at the same scale 0–0.5CPM. Dashed lines indicate trimming at 0.5CPM. The horizontal blue scale bar = 10 kb. The black arrow under each gene name indicates transcription orientation. A simplified exon–intron structure of each gene is shown above the gene name.
RT–PCR analysis of the four genes from (A). ctrl = RT–PCR of a spiked α-rabbit globin mRNA demonstrating consistent RT–PCR efficiency across samples.
Intron RPKM-based filtering conditions for selecting genes transcribed in 1-cell embryos. The Venn diagram shows an overlap between gene populations where (i) RPKMs of introns in 1-cell embryos were more than fourfold greater than those in MII eggs oocytes (red circle), (ii) RPKMs of introns in 1-cell embryos were more than fourfold greater than those in 1-cell embryos treated with DRB, and (iii) the numbers of reads mapped to introns for a gene were ≥ 0.12 RPKM in 1-cell embryos and ≤ 0.04 in MII eggs.
Examples of two genes identified among the 4,039 genes depicted in (C). Figure design is the same as in (A).
RT–PCR analysis of expression of four genes found among the 4,039 genes identified by filtering conditions described in (C). Ctrl amplicon is the same as in (B).
Relationship between the minor and major wave of ZGA. Each point represents one transcript (gene). The y-axis depicts α-amanitin sensitivity in 2-cell embryos [log2-fold change inferred from microarray profiling (Zeng & Schultz, 2005)]. The x-axis depicts 1-cell/MII intron RPKM ratio. Red points represent the 100 most expressed oocyte-specific genes, and blue points represent the 100 most expressed testis-specific genes [tissue specificity and level of expression were inferred from BioGPS source data (Su et al, 2004)].
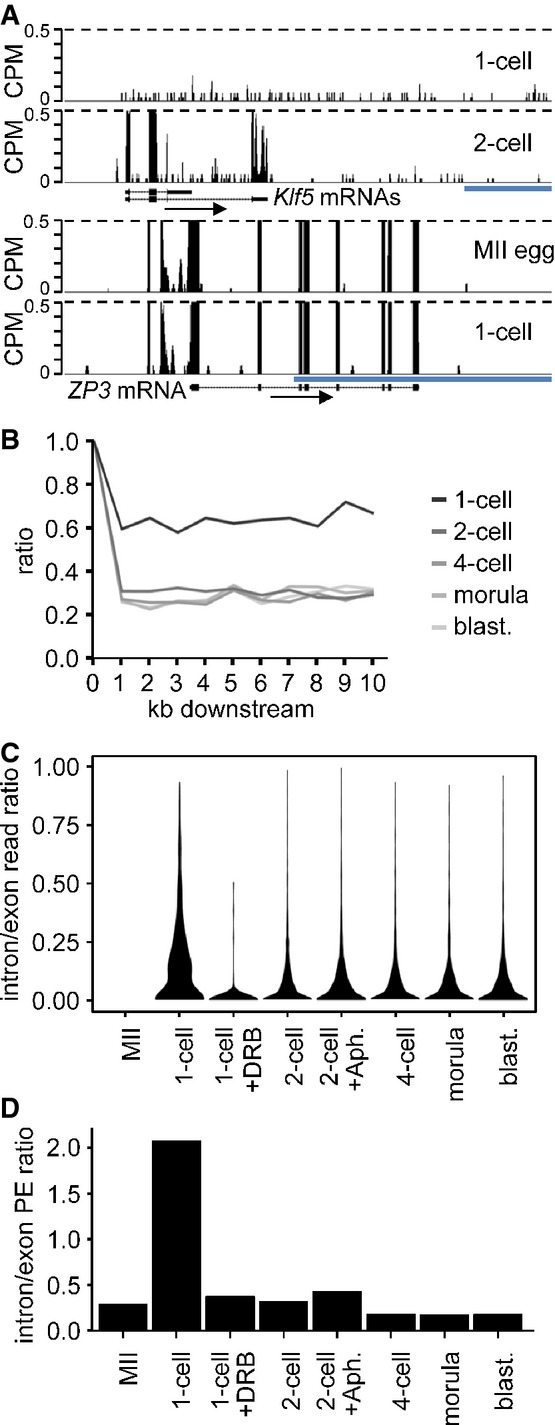
Example of a gene transcribed at 1-cell stage. Shown are reads from 1-cell- and 2-cell-derived paired-end-sequenced libraries mapping to the Klf5 gene region. Their distribution indicates inefficient splicing and 3′ end processing in 1-cell embryos. In contrast to the 2-cell embryo, the 1-cell embryo does not show any enrichment of exon-derived reads (exons are depicted as black rectangles) and no apparent transcriptional termination at the 3′ end. A detailed analysis of all reads mapping to the Klf5 gene identified a single read derived from a spliced Klf5 transcript. Below is shown profile of Zp3, an abundantly expressed oocyte-specific gene with very well defined exon–intron boundaries, which are retained also at the 1-cell stage. The vertical scale was trimmed at 0.5 CPM; trimming is indicated by horizontal dashed lines. The blue scale bars represent 10 kb.
Transcription termination analysis. Lines represent median ratios of read counts per kb (RPK) of reads downstream of transcription termination site to exons for gene sets transcribed in 1-cell embryos and subsequent stages but not in MII eggs. Downstream regions for genes with at least one RPK in exons are divided into 1-kb slices, and reads in each slice are counted and divided by the RPK value of the respective exon (point 1, 100%). The 1-cell stage shows higher downstream to exon read ratio indicating the extension of transcription past the polyA site.
Violin plot distributions of intron/exon read count ratios per cell stage for genes not transcribed in MII eggs. Intron and exon read counts were normalized to 1 kb length (RPK) and divided to obtain the read ratio for each region transcribed at the 1-cell stage or later. The 1-cell stage shows a shift toward higher intron/exon ratios indicating that a larger proportion of transcripts contain unspliced intronic regions, compared to the later stages. The MII stage is displayed as control and contains no values.
Comparison of unspliced/spliced read pair ratios per cell stage. Read counts where one end maps to intron/exon junction or entirely in intron and the other end maps to the adjacent exon were labeled as ‘unspliced’. The ‘spliced’ pairs were selected so that the one end maps either to the splice site and covers two adjacent exons or with each end mapping to separate, adjacent exons. The ratios of unspliced/spliced pair counts normalized to 1-kb length were calculated for all transcribed regions in 1,786 transcripts not expressed at MII and expressed at later stages. The 1-cell stage shows a clear dominance of unspliced reads over the spliced ones, indicating the increased incidence of intron retention in sequenced transcripts.
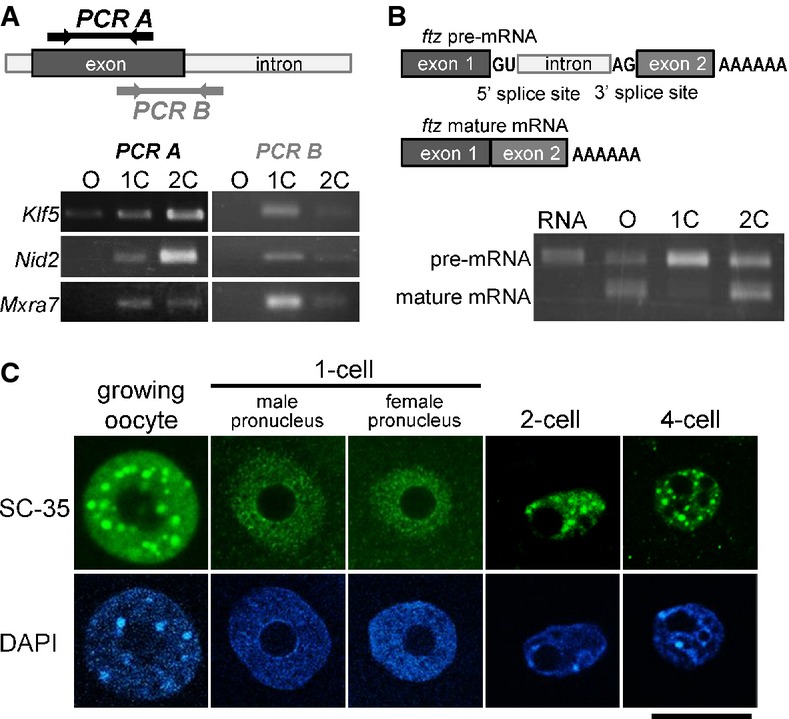
RT–PCR analysis of unspliced introns. Upper portion shows the locations for which primer pairs were designed. Lower portion depicts results of an RT–PCR analysis using the primer pairs described in the upper diagram.
Upper diagrams show the structures of pre- and mature ftz mRNAs. Synthesized ftz pre-mRNA was microinjected into growing oocytes, and 1- and 2-cell-stage embryos. Lower portion shows the results of RT–PCR using primer pairs for exons 1 (forward) and 2 (reverse).
Immunofluorescence with an anti-SC-35 antibody of the nuclei of growing oocytes, and 1-, 2-, and 4-cell-stage embryos. The position of the nucleus, detected with DAPI, is shown in the lower portion of the figure. Scale bar, 20 μm.
References
-
- Abe K-I, Inoue A, Suzuki MG, Aoki F. Global gene silencing is caused by the dissociation of RNA polymerase II from DNA in mouse oocytes. J Reprod Dev. 2010;56:502–507. - PubMed
-
- de Almeida SF, Carmo-Fonseca M. Reciprocal regulatory links between cotranscriptional splicing and chromatin. Semin Cell Dev Biol. 2014;32:2–10. - PubMed
-
- Aoki F, Worrad DM, Schultz RM. Regulation of transcriptional activity during the first and second cell cycles in the preimplantation mouse embryo. Dev Biol. 1997;181:296–307. - PubMed
-
- Bachvarova R, De Leon V. Polyadenylated RNA of mouse ova and loss of maternal RNA in early development. Dev Biol. 1980;74:1–8. - PubMed
Publication types
MeSH terms
Substances
Grants and funding
LinkOut - more resources
Full Text Sources
Other Literature Sources
Molecular Biology Databases
