. 2015 Jun 12;34(12):1612-29.
doi: 10.15252/embj.201490791. Epub 2015 Apr 20.

USP18 lack in microglia causes destructive interferonopathy of the mouse brain

Affiliations

USP18 lack in microglia causes destructive interferonopathy of the mouse brain

Tobias Goldmann et al. EMBO J. .

Abstract

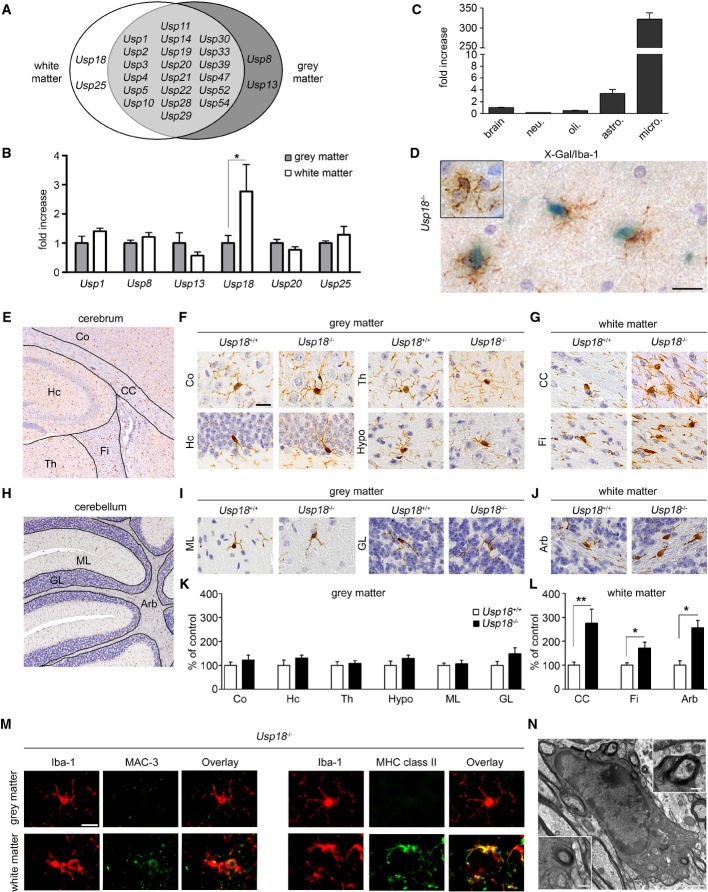
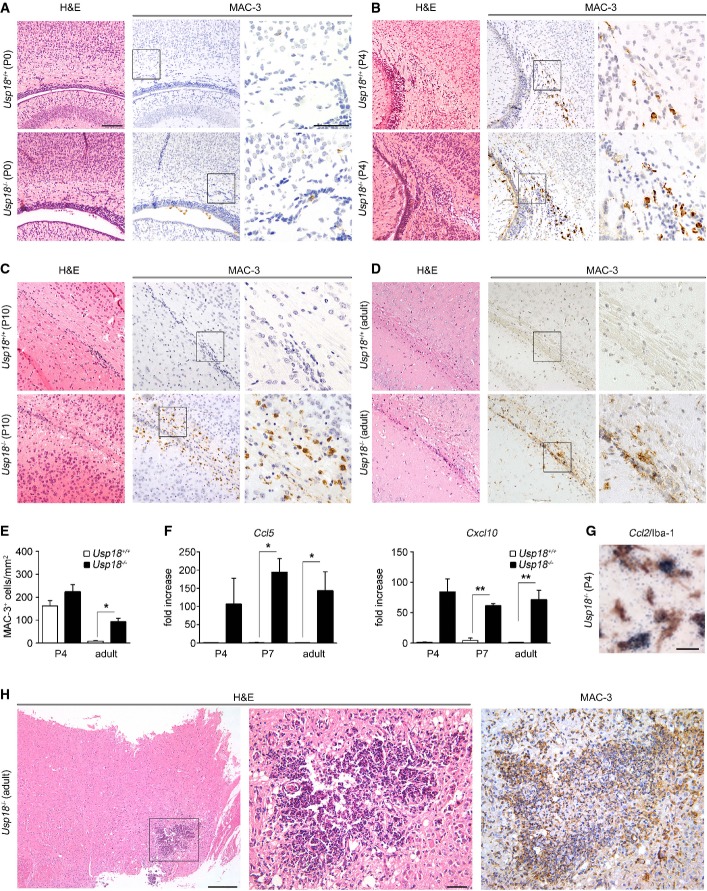
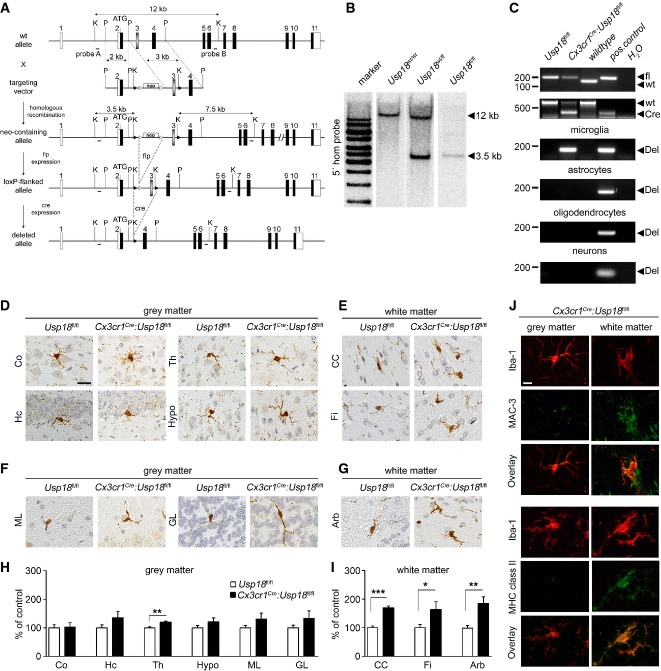
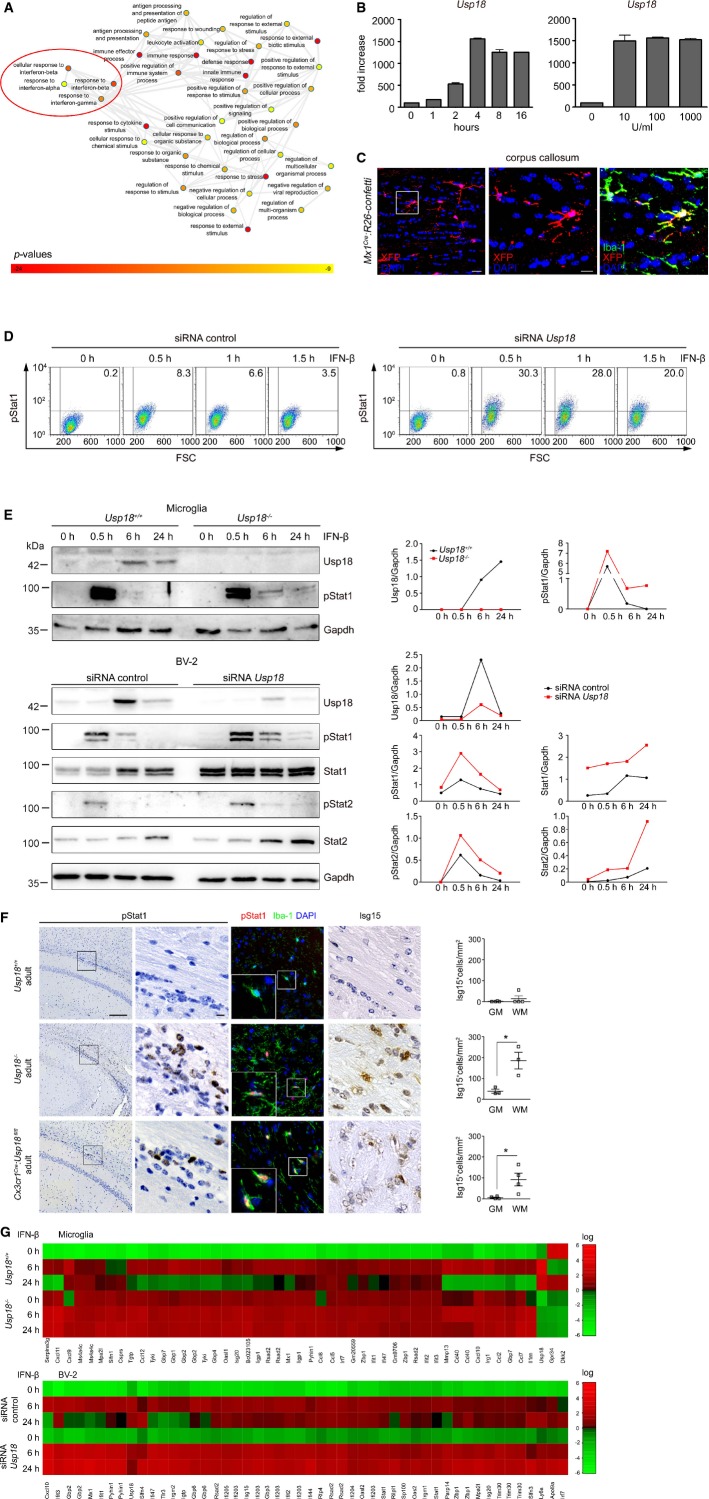
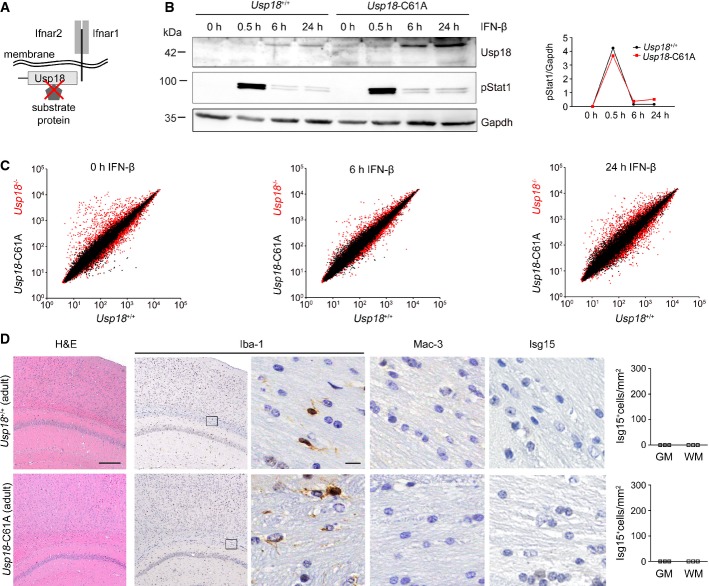
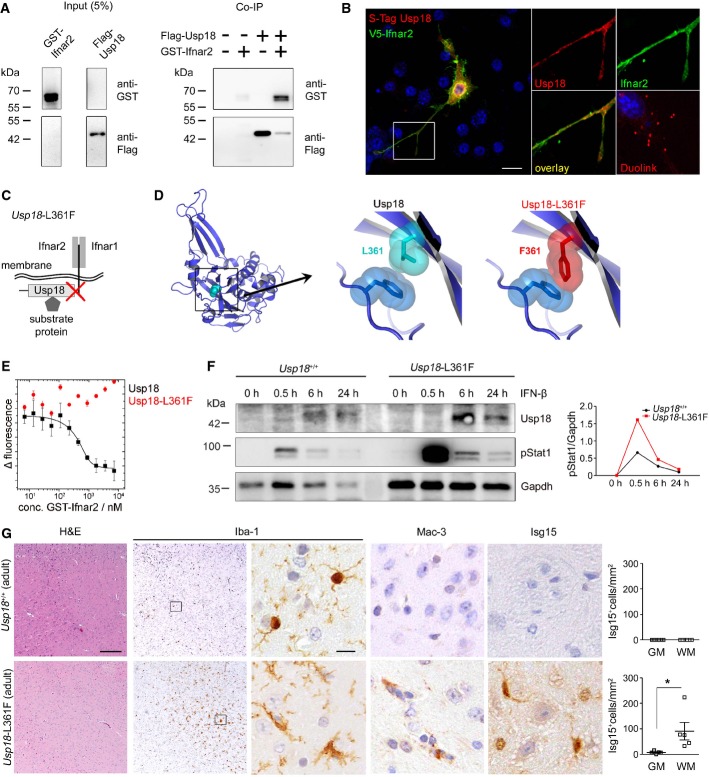
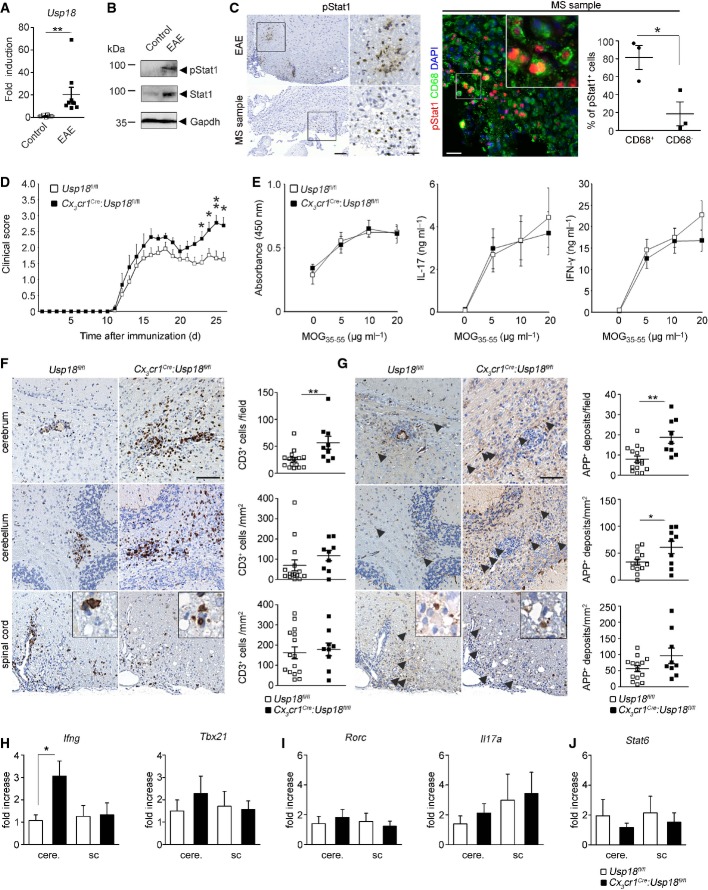
Microglia are tissue macrophages of the central nervous system (CNS) that control tissue homeostasis. Microglia dysregulation is thought to be causal for a group of neuropsychiatric, neurodegenerative and neuroinflammatory diseases, called "microgliopathies". However, how the intracellular stimulation machinery in microglia is controlled is poorly understood. Here, we identified the ubiquitin-specific protease (Usp) 18 in white matter microglia that essentially contributes to microglial quiescence. We further found that microglial Usp18 negatively regulates the activation of Stat1 and concomitant induction of interferon-induced genes, thereby terminating IFN signaling. The Usp18-mediated control was independent from its catalytic activity but instead required the interaction with Ifnar2. Additionally, the absence of Ifnar1 restored microglial activation, indicating a tonic IFN signal which needs to be negatively controlled by Usp18 under non-diseased conditions. These results identify Usp18 as a critical negative regulator of microglia activation and demonstrate a protective role of Usp18 for microglia function by regulating the Ifnar pathway. The findings establish Usp18 as a new molecule preventing destructive microgliopathy.

Keywords: EAE; Usp18; microglia; multiple sclerosis; type I interferon.


Figures

Figure 1
Figure 1. Usp18 is a distinct feature of white matter microglia and essentially regulates microglia quiescence
A Spatial distribution of ubiquitin-specific protease (USP) transcripts based on FACS-sorted adult microglia isolated from the white or gray matter that were subsequently examined by MouseRef-8 v2.0 Expression Bead Chip (Illumina) array analysis (Olah et al, 2012). Each USP shown exceeds a median expression value of two resulting from five mice compared to the mean expression value of the same gene in the other brain region. B Quantitative RT–PCR of indicated genes in FACS-isolated adult microglia. Bars represent means ± s.e.m. with three mice in each group (*P < 0.05). Significant differences are determined by an unpaired t-test. C Expression of Usp18mRNA measured by qRT–PCR in primary microglia (micro.), astrocytes (astro.), neurons (neu.) and oligodendrocytes (oli.). Bars represent means ± s.e.m with at least three samples in each group normalized to the mean expression value of Usp18 transcripts in the whole brain. D Cell-specific expression of Usp18. Light microscopic analysis of X-gal-stained (blue) white matter brain tissue of adult Usp18LacZ/LacZ mice. Iba-1 staining (brown) reveals microglia. Inserts show microglia from the cortex. Scale bar, 20 μm. E–G Histology of different brain areas in the cerebrum of adult Usp18+/+ and Usp18LacZ/LacZ (Usp18−/−) mice. Cortex (Co), hippocampus (Hc), thalamus (Th) and hypothalamus (Hypo) represent areas of the gray matter, whereas corpus callosum (CC) and fimbria (Fi) are defined as white matter. Scale bar, 10 μm. H–J Histological pictures of different cerebellar regions of adult Usp18+/+ and Usp18LacZ/LacZ (Usp18−/−) mice. Molecular layer (ML) and granular layer (GL) represent areas of the gray matter, whereas arbor vitae (Arb) is part of the white matter. K, L Quantification of Iba-1+ microglia in the different areas of Usp18LacZ/LacZ (Usp18−/−) mice. Microglia numbers are normalized to that found in Usp18+/+ littermates and are displayed as % of control. At least five mice per genotype were counted. Significant differences are determined by an unpaired t-test or Mann–Whitney U-test and marked with asterisks (*P < 0.05, **P < 0.01). Bars represent means ± s.e.m. M Immunofluorescence of white matter and gray matter microglia (Iba-1, red) in adult Usp18−/− animals (green, scale bar, 10 μm). Three animals per genotype were examined. One characteristic picture is shown. N Transmission electron microscopy of myelin-phagocytosing microglia in adult Usp18LacZ/LacZ (Usp18−/−) mice. Scale bars, 1 μm (overview) and 250 nm (zoom).
Figure 2
Figure 2. WMMA starts at early postnatal stages
A–D Histology of brain sections of newborn (P0), 4-day-old (P4), 10-day-old (P10) and adult Usp18+/+ and Usp18LacZ/LacZ (Usp18−/−) mice revealing an early white matter microglia activation (WMMA). Hematoxylin and eosin (H&E), MAC-3 for activated microglia. Scale bars, 100 μm (overviews in H&E and MAC-3) and 50 μm (insert in MAC-3). Data are representative of two experiments with two mice each. E Quantification of MAC-3-labeled microglia of P4 and adult Usp18+/+ and Usp18LacZ/LacZ (Usp18−/−) mice. At least three animals per genotype were examined. Bars represent means ± s.e.m. Significant differences are determined by an unpaired t-test and marked with an asterisk (*P < 0.05). F Gene expression levels of Ccl5 and Cxcl10mRNA in the brains of P4, P7 and adult Usp18+/+ (white bars) and Usp18LacZ/LacZ (Usp18−/−, black bars) mice. Data are expressed as the ratio of induced factors normalized to endogenous Gapdh compared to Usp18+/+ mice and expressed as mean ± s.e.m. At least three mice were used in two independent experiments. Significant differences are determined by an unpaired t-test and marked with asterisks (*P < 0.05, **P < 0.01). G In situ hybridization of Ccl2mRNA displays co-labeling in Iba-1+ white matter microglia of Usp18LacZ/LacZ (Usp18−/−) mice. Scale bar, 20 μm. Two mice were used in two independent experiments. H Occurrence of cerebral calcifications in adult Usp18LacZ/LacZ (Usp18−/−) mice. Scale bars, 200 μm (overview) and 50 μm (zoom).
Figure 3
Figure 3. WMMA due to Usp18 deletion occurs in a cell-autonomous manner
A Targeting strategy for the conditional mutagenesis of the Usp18 gene. A targeting vector was used to modify the Usp18 gene locus. Upon homologous recombination and elimination of the frt-flanked selection marker (neo), the third exon of the gene was flanked by loxP sites allowing Cre-mediated deletion of Usp18. B Homologous recombination in ES cells was detected by genomic Southern blot analysis. As depicted in (A), probe A detects a diagnostic 3.5-kb band upon KpnI restriction digest diagnostic for the mutated Usp18 allele. C PCR analysis of the Usp18 deletion in primary microglia, astrocytes, oligodendrocytes or neurons of Usp18fl/fl, Cx3cr1Cre:Usp18fl/fl and wild-type mice. Recombination is only taking place in microglia but not in astrocytes, oligodendrocytes or neurons. One representative experiment out of two performed is shown. D, E Histology of different brain areas in the cerebrum of adult Usp18fl/fl and Cx3cr1Cre:Usp18fl/fl mice. Cortex (Co), hippocampus (Hc), thalamus (Th) and hypothalamus (Hypo) represent areas of the gray matter, whereas corpus callosum (CC) and fimbria (Fi) are parts of the white matter. Scale bar = 10 μm. F, G Histological pictures of different cerebellar regions of adult Usp18fl/fl and Cx3cr1Cre:Usp18fl/fl mice. Molecular layer (ML) and granular layer (GL) represent areas of the gray matter, whereas arbor vitae (Arb) is part of white matter. H, I Quantification of Iba-1+ cells in Cx3cr1Cre:Usp18fl/fl mice. Microglia numbers are normalized to that found in Usp18+/+ littermates and are displayed as % of control. At least five mice per genotype were counted. Significant differences are determined by an unpaired t-test or Mann–Whitney U-test and marked with asterisks (*P < 0.05, **P < 0.01, ***P < 0.0001). Bars represent means ± s.e.m. J Immunofluorescence of white and gray matter microglia (Iba-1, red) in adult Usp18−/− animals (green, scale bar, 10 μm). Three animals per genotype were examined. One characteristic sample is shown.
Figure 4
Figure 4. Lack of Usp18 enhances type I IFN gene expression in microglia due to prolonged Stat1 phosphorylation
A Gene ontology enrichment network on differentially expressed genes in microglia from unstimulated Usp18+/+ and Usp18LacZ/LacZ (Usp18−/−) microglia on the basis of an Affymetrix DNA microarray analysis. Diagram depicts results of GO clustering through GORilla. Only very highly significantly overrepresented GO terms are included with P-values ranging from P < 10−9 (yellow) to P < 10−24 (red). B Quantitative RT–PCR for Usp18 transcripts in primary microglia stimulated for the designated time points with 100 U/ml of IFN-β (left panel) or with 10, 100 or 1,000 U/ml of IFN-β and measured after 4 h (right panel). Bars represent means ± s.e.m with three to four samples in each group. Data are representative of two independently performed experiments. C Fluorescence microscopy of the white matter (corpus callosum) of Mx1Cre:R26-confettimice raised under specific pathogen-free conditions. Recombination of GFP, RFP, CFP or YFP (combined into one channel to XFP and displayed in red) was found in Iba-1+ microglia of the white matter. Scale bars: 20 μm (overview) and 10 μm (zoom). D Flow cytometric quantification of Stat1 phosphorylation in BV-2 microglial cells transfected with control siRNA (siRNA co) or siRNA against Usp18. Representative dot blots of IFN-β-treated cells at indicated time points are shown that were obtained from two independent experiments. FSC: forward scatter. E Immunoblot analysis of type I IFN signaling in microglia lacking Usp18. Upper panel: Absence of Usp18 protein leads to prolonged Stat1 activation upon IFN-β challenge (500 U/ml) of microglia from Usp18+/+ and Usp18LacZ/LacZ (Usp18−/−) mice. Gapdh is shown as a loading control. Lower panel: Altered IFN signaling in the microglia cell line BV-2 transfected with control siRNA (siRNA co) or siRNA against Usp18. Quantification of band intensities is depicted next to the blots. Representative Western blots of three to four independently performed experiments are shown. F Brain histology of the white matter reveals increased pStat1 and interferon-induced gene (ISG) 15 levels in white matter microglia in adult Cx3cr1Cre:Usp18fl/fl and Usp18LacZ/LacZ (Usp18−/−) mice but not in Usp18+/+ individuals. Quantification of Isg15+ cells in the gray (GM) and white matter (WM) is presented next to the respective histological images. Scale bars: 200 μm (overview) and 10 μm (insert). Each symbol indicates the mean of one mouse. Error bars represent s.e.m. Significant differences are determined by an unpaired t-test and marked with an asterisk (*P < 0.05). G Heat map (standardized and scaled to log2 expression) of non-stimulated conditions (0 h) or after IFN-β (500 U/ml for 6 h and 24 h) treatment in primary microglia from Usp18LacZ/LacZ (Usp18−/−) and Usp18+/+ mice or the microglia cell line BV-2 (transfected with control siRNA [siRNA co] or siRNA against Usp18). Expression profile of top 50 induced genes in Usp18+/+ or siRNA co upon 6 and 24 h IFN-β is shown.
Figure 5
Figure 5. Usp18-mediated microglia activation is independent of its catalytic activity
A Scheme of Usp18 interactions with either cytoplasmatic substrate/interacting proteins or trans-membrane anchored type I interferon receptor (Ifnar) and its subunits 1 and 2. The red cross indicates the genetically inactivated motif in Usp18-C61A mutant mice. B Immunoblot of primary microglia from Usp18+/+ and catalytically inactive Usp18-C61A mutant mice reveals normal pStat1 kinetics at different time points after IFN-β (500 U/ml) challenge. Gapdh is shown as a loading control. Quantification of band intensities is depicted next to the blots. One representative data set out of three independent experiments is illustrated. C Gene expression scatter plot of Affymetrix oligo-array data depicting different gene expression patterns in microglia from Usp18 mutants. The relative mRNA levels from wild-type microglia (Usp18+/+, x-axis) are normalized to Usp18LacZ/LacZ (Usp18−/−) microglia (y-axis, red dots) and catalytically inactive Usp18-C61A (y-axis, black dots) microglia under non-stimulated conditions and after IFN-β (500 U/ml) exposure. Pooled data from two independent experiments are shown. D CNS histology of adult Usp18-C61A mice discloses unchanged microglial cells with normal morphological appearance (Iba-1) but no MAC-3+ amoboid microglia. Quantification of Isg15+ cells in the GM and WM is shown next to the respective histological images. Three mice per genotype were examined. Scale bars: 200 μm (overview), 10 μm (zoom).
Figure 6
Figure 6. WMMA is regulated by interaction of Usp18 with the Ifnar2 domain
A Co-immunoprecipitation (Co-IP) of flag-tagged Usp18 with the GST-Ifnar2 subunit upon overexpression in HEK293T cells. FLAG-Usp18 was precipitated using anti-FLAG beads, and Ifnar2 was detected by anti-GST immunoblotting revealing direct interaction of Ifnar2 with USsp18. Input is shown as transfection control. B Proximity ligation assay for the co-localization of Usp18 with Inar2 in the microglial cell line BV-2. S-tagged Usp18 (red) associates with V5-tagged Ifnar2 (green). Close proximity of both proteins is shown by fluorescence dots (red) using a Duolink® probe. Scale bar, 10 μm. C Scheme of Usp18 interactions with either cytoplasmatic substrate/interacting proteins or trans-membrane anchored type I interferon receptor (Ifnar) and its subunits 1 and 2. The red cross designates the genetically inactivated motif in Usp18-L361F mutant animals. D Molecular model of Usp18 wild-type and Usp18-L361F variant. The replacement of Leu at position 361 by Phe results in a sterical clash with Phe271 and might disturb the conformation of the surface loop comprising residues 268–275. E Binding analysis of USP18 and USP18-L361F with the intracellular domain of Ifnar2 by microscale thermophoresis. USP18 binds with high affinity (Kd = 54 ± 5 nM) to the intracellular domain of Ifnar2, whereas no binding is observed for USP18-L361F in the same concentration range. Data represent mean ± s.e.m. of two independent experiments. F Immunoblot of microglia from Usp18+/+ and Usp18-L361F mutant mice demonstrates prolonged Stat1 phosphorylation at defined time points after IFN-β (500 U/ml) exposition. Gapdh is presented as a loading control. Quantification of band intensities is shown next to the blots. One representative data set out of three independent experiments is illustrated. G Robust microgliosis (Iba-1), presence of amoboid MAC-3+ microglia and accumulation of Isg15 in adult Usp18-L361F mutant but not in Usp18+/+ mice. Quantification of Isg15+ cells in the GM and WM is depicted next to the respective histological images. Five mice per genotype were examined. Scale bars: 200 μm (overview), 10 μm (insert) Each symbol indicates the mean of one mouse. Error bars represent s.e.m. Significant differences are determined by an unpaired t-test and marked with an asterisk (*P < 0.05).
Figure 7
Figure 7. Myeloid-specific Usp18 deficiency shapes clinical course and pathology of autoimmune CNS inflammation
A Quantitative RT–PCR for Usp18mRNA in the spinal cord of healthy control and EAE-diseased mice. Data are expressed as ratio of Usp18 expression versus endogenous Gapdh relative to control and shown as mean ± s.e.m. Each symbol represents one mouse. (**P < 0.01). Significant differences are determined by a Mann-Whitney U-test and marked with a asterisk (**P < 0.01). B Immunoblot for pStat1 and Stat1 in spinal cord lysates of diseased or control mice. Gapdh is shown as a loading control. Data are representative of three independent experiments performed. C Left panel: immunohistochemistry for phosphorylated Stat1 (pStat1) in the border region of demyelinating lesions in spinal cord EAE samples (above) and brain samples from a patient with multiple sclerosis (MS). Scale bars: 100 μm (overview) and 25 μm (zoom). Four EAE-diseased animals and three biopsies of MS patients were examined, and one representative picture is shown. Right panel: immunofluorescence of pSTAT1 (red) and CD68 (green) in demyelinating lesions of MS patients. Quantification of pSTAT1+CD68+ and pSTAT1+CD68 cells are shown next to the respective histological images. Each symbol represents on patient sample. Error bars represent s.e.m. Significant differences are determined by an unpaired t-test and marked with an asterisk (*P < 0.05). D EAE was induced by active immunization of Cx3cr1Cre:Usp18fl/fl (= 9, filled squares) and Usp18fl/fl (= 15, open squares) mice, and disease was scored. Each data point represents the mean ± s.e.m. Significant differences are determined by a Mann–Whitney U-test and marked with asterisks (*P < 0.05, **P < 0.01). The data shown are the mean from two independent experiments. E Normal recall assay in Cx3cr1Cre:Usp18fl/fl mice. Lymph node T cells were collected and cultured for 48 h at the indicated MOG35–55 concentrations. Proliferation was measured by BrdU incorporation for 16 h (left). IL-17 (middle) and IFN-γ (right) release were measured by ELISA. Data represent mean ± s.e.m. of at least three animals per group. Results are representative of two independent experiments. F, G Histology of cerebral, cerebellar and spinal cord sections from diseased mice using CD3 for T lymphocytes (F) and amyloid precursor protein (APP, arrowhead) for axonal damage (G). Scale bars, 100 μm. Quantification of T-cell infiltrates and axonal damages are depicted below the respective histological images. Each symbol indicates the mean of one mouse. Significant differences are determined by an unpaired t-test and marked with asterisks (*P < 0.05, **P < 0.01). Error bars represent s.e.m. H–J Gene expression levels of TH1- (H), TH17- (I) and TH2-linked factors (J) in isolated mononuclear cells from the cerebrum (cere.) or the spinal cord (sc) of Cx3cr1Cre:Usp18fl/fl (black bars; = 7) or Usp18fl/fl (white bars; = 7) mice. Data are normalized to endogenous Gapdh, expressed as fold increase of diseased Usp18fl/fl mice and displayed as mean ± s.e.m. Significant differences are determined by an unpaired t-test and marked with an asterisk (*P < 0.05).

Comment in

Similar articles

Cited by

References

    1. Altorok N, Coit P, Hughes T, Koelsch KA, Stone DU, Rasmussen A, Radfar L, Scofield RH, Sivils KL, Farris AD, Sawalha AH. Genome-wide DNA methylation patterns in naive CD4+ T cells from patients with primary Sjogren's syndrome. Arthritis Rheumatol. 2014;66:731–739. - PMC - PubMed
    1. Basters A, Geurink PP, El OF, Ketscher L, Casutt MS, Krause E, Ovaa H, Knobeloch KP, Fritz G. Molecular characterization of ubiquitin-specific protease 18 reveals substrate specificity for interferon-stimulated gene 15. FEBS J. 2014;281:1918–1928. - PubMed
    1. Brummelkamp TR, Nijman SM, Dirac AM, Bernards R. Loss of the cylindromatosis tumour suppressor inhibits apoptosis by activating NF-kappaB. Nature. 2003;424:797–801. - PubMed
    1. Crow YJ. Type I interferonopathies: Mendelian type I interferon up-regulation. Curr Opin Immunol. 2015;32C:7–12. - PubMed
    1. De A, Dainichi T, Rathinam CV, Ghosh S. The deubiquitinase activity of A20 is dispensable for NF-kappaB signaling. EMBO Rep. 2014;15:775–783. - PMC - PubMed

Publication types

MeSH terms

Associated data