. 2015 Apr 21:6:6847.
doi: 10.1038/ncomms7847.

Combinatorial code governing cellular responses to complex stimuli

Affiliations

Combinatorial code governing cellular responses to complex stimuli

Antonio Cappuccio et al. Nat Commun. .

Abstract

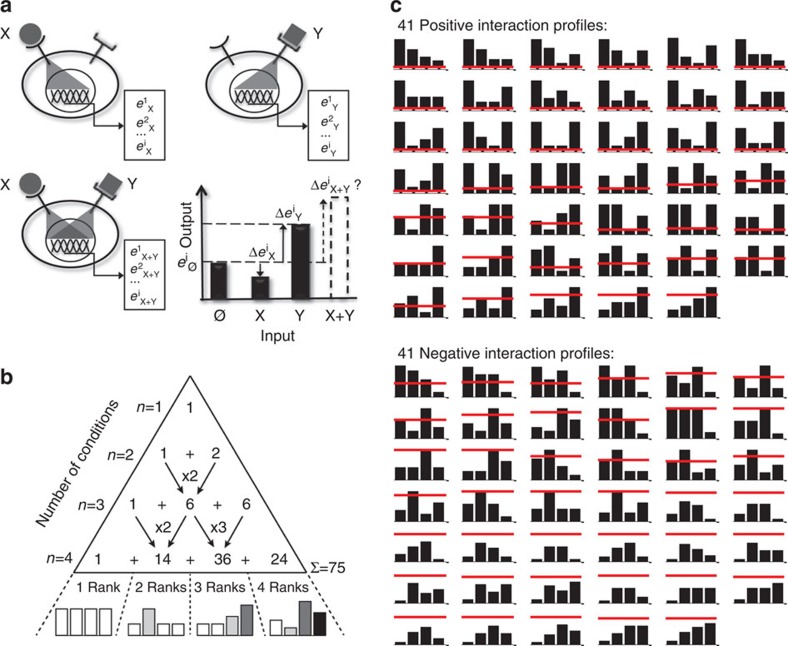
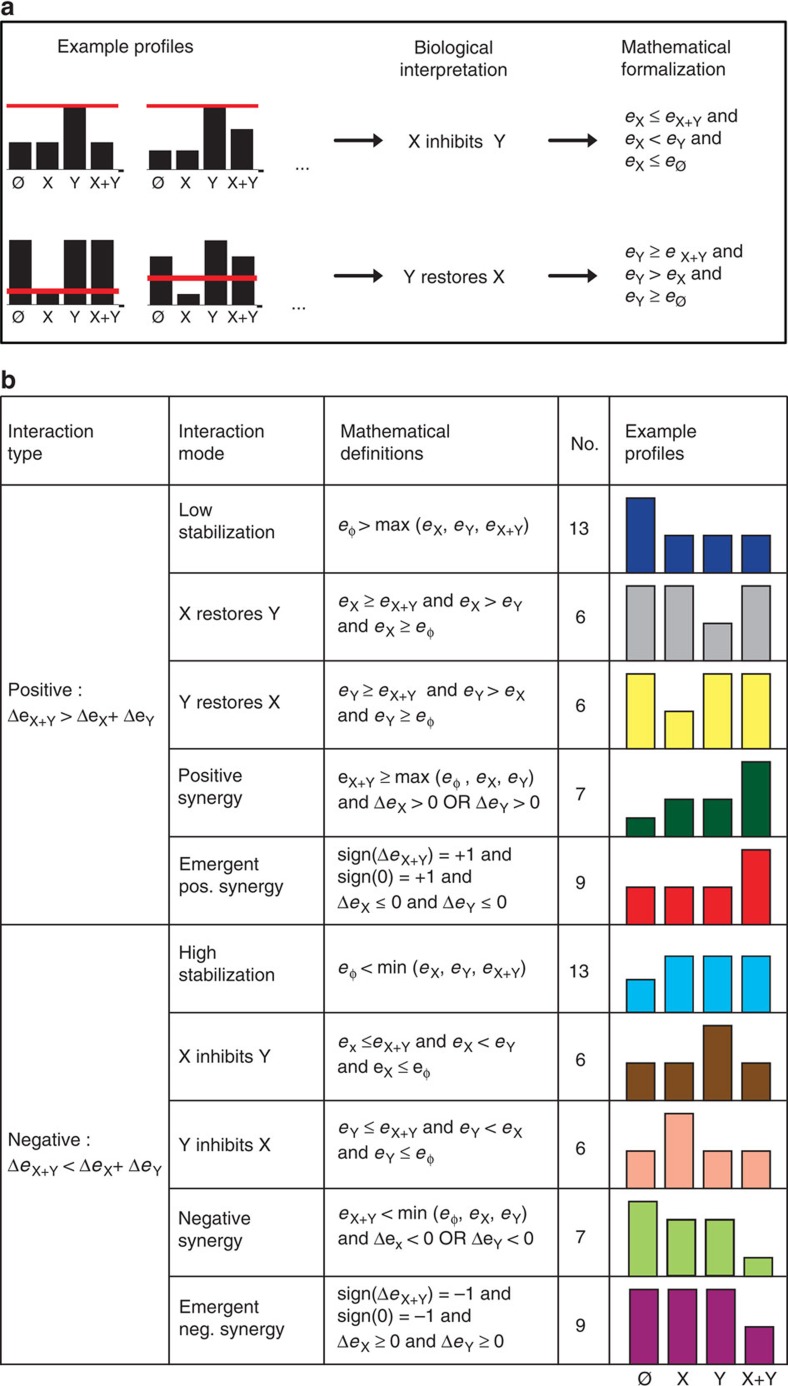
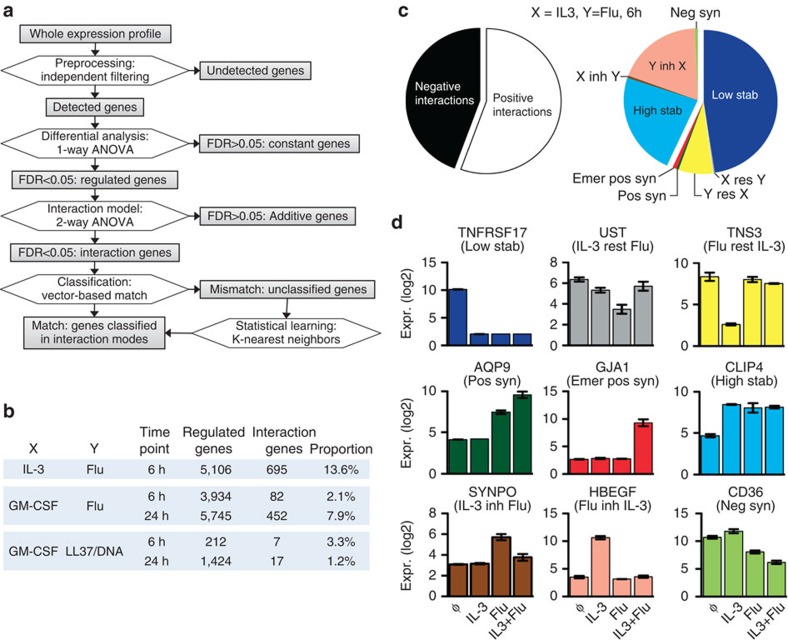
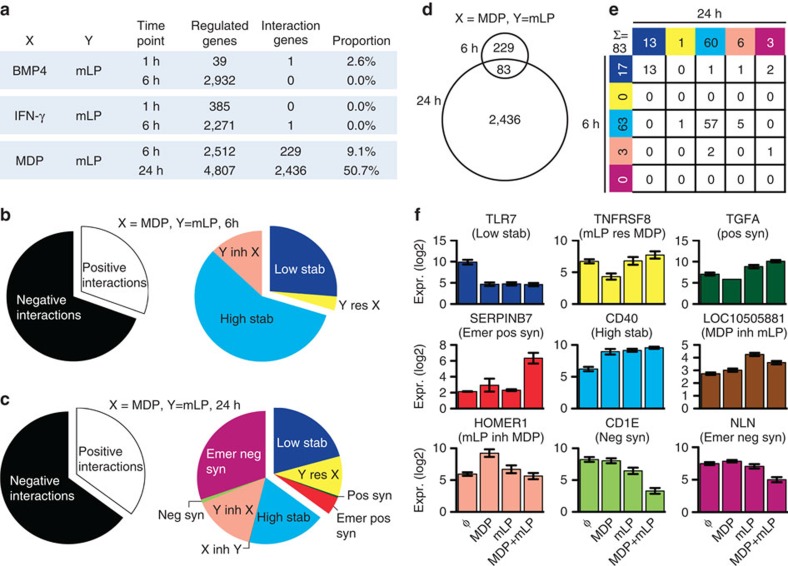
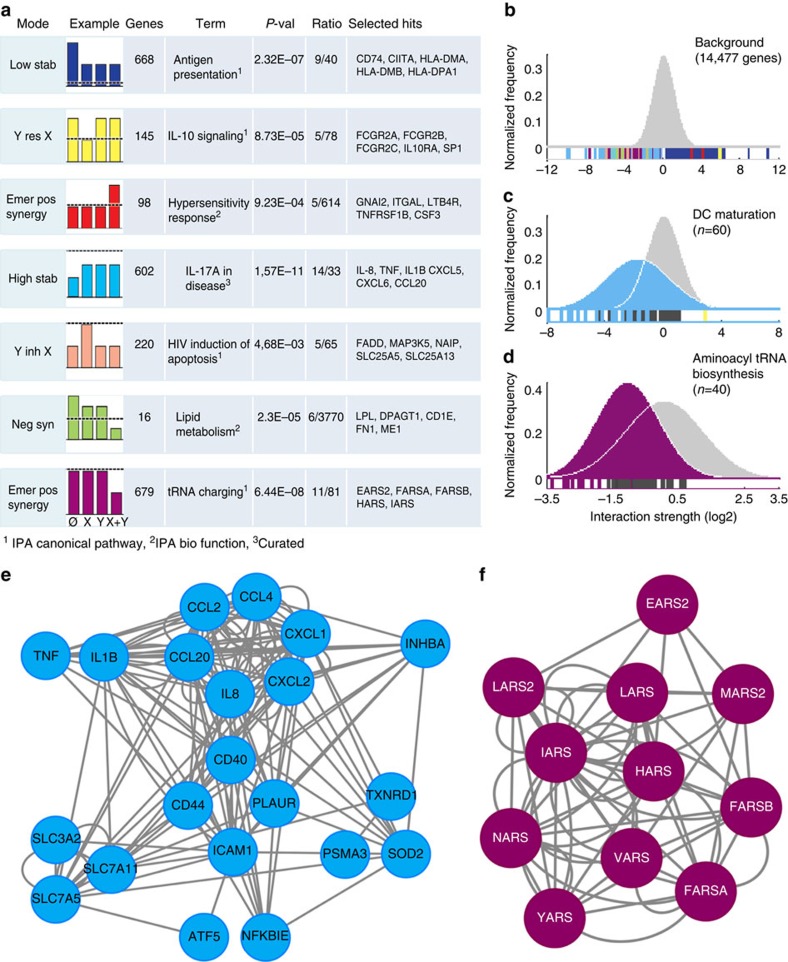
Cells adapt to their environment through the integration of complex signals. Multiple signals can induce synergistic or antagonistic interactions, currently considered as homogenous behaviours. Here, we use a systematic theoretical approach to enumerate the possible interaction profiles for outputs measured in the conditions 0 (control), signals X, Y, X+Y. Combinatorial analysis reveals 82 possible interaction profiles, which we biologically and mathematically grouped into five positive and five negative interaction modes. To experimentally validate their use in living cells, we apply an original computational workflow to transcriptomics data of innate immune cells integrating physiopathological signal combinations. Up to 9 of the 10 defined modes coexisted in context-dependent proportions. Each interaction mode was preferentially used in specific biological pathways, suggesting a functional role in the adaptation to multiple signals. Our work defines an exhaustive map of interaction modes for cells integrating pairs of physiopathological and pharmacological stimuli.


Figures

Figure 1
Figure 1. Theoretical analysis reveals 82 possible interaction profiles of two stimuli.
(a) We consider two cues X or Y inducing the transcriptional states [e1X…eiX] or [e1YeiY], where eiX and eiY denote the expression of gene i due to X or Y. We hypothesize that after simultaneous triggering of the receptors for X and Y, the transcriptional state [e1X+YeiX+Y] cannot be predicted, as the downstream effects induced by both stimuli might interact either positively [ΔeiX+yeiXeiY] or negatively [ΔeiX+yeiXeiY]. (b) To enumerate the theoretical outcomes of an interaction, we first counted how many ways k statistically different groups can be observed from n experimental conditions. The generalized solution [Ank=An−1k+kAn−1k−1] of this combinatorial problem is illustrated as a modified Pascal's triangle. Our experimental design involves n=4 conditions and therefore a maximum of k=4 statistically different groups, which results in 75 possible combinations. We then applied a constraint satisfaction algorithm to compute how many of these possibilities are mathematically consistent with the inequalities that define positive and negative interactions. We obtained 82 instances (41 positive and 41 negative) referred to as interaction profiles. (c) Tabular view of example profiles belonging to each of the 82 interaction profiles. The heights of the bars in each graph represent the expression levels of the four conditions (from left to right): No stimulus, X, Y and X+Y. The red line corresponds to the height of X+Y if the integration of the stimuli was additive.
Figure 2
Figure 2. Classification of the 82 interaction profiles into 10 biological interaction modes.
(a) Classification procedure on example interaction profiles belonging to the ‘X inhibits Y' and ‘Y restores X' interaction modes. The red line corresponds to the height of X+Y if the integration of the stimuli was additive. (b) Table showing the classification of the 82 interaction profiles in 10 groups called interaction modes. Each interaction mode contains a subset of interaction profiles that share a biological interpretation and satisfy common mathematical rules. The number of interaction profiles contained in each mode is shown as well as one representative interaction profile. Neg, negative; Pos, positive.
Figure 3
Figure 3. Multimodal signal integration in human pDC.
(a) Gene classification flowchart showing the analysis steps from the whole transcriptome data to the classification of non-additive genes in the different interaction modes (IMs). (b) Number of regulated genes, interaction genes and the proportion of interaction genes with different stimuli combinations after 6 and 24 h of stimulation. (c) Distribution of IM for the combination IL-3 and Flu at 6 h, the number of genes per interaction mode was normalized to the number of interaction profiles per mode. Inh, inhibits; Res, restores. (d) Expression (Expr.) of example genes classified in different IM. Low stab, low stabilization; IL-3 rest Flu, IL-3 restores Flu; Flu rest IL-3, Flu restores IL-3; pos syn, positive synergy; emer pos syn, emergent positive synergy; high stab, high stablization; IL-3 inh Flu, IL-3 inhibits Flu; Flu inh IL-3, Flu inhibits IL-3; neg syn, negative synergy. Error bars represent s.e.m. of three 3 independent replicates.
Figure 4
Figure 4. Multimodality and dynamics of the integration profile in human monocytes.
(a) Number of regulated genes, interaction genes and the proportion of interaction genes with different stimuli combinations at 1, 6 and 24 h. BMP4, bone morphogenetic protein 4; IFN-γ, interferon-γ; MDP=muramyl dipeptide; mLP, 19 kDa mycobacterial lipopeptide. (b) Distribution of the integration modes proportions for the combination of MDP and mLP at 6 and 24 h (c), respectively. Inh, inhibits; Res, restores. (d) MDP and mLP interaction genes in common at 6 and 24 h. (e) Evolution of interaction genes classification over time. (f) Expression of example genes belonging to the different interaction modes. Low stab, low stabilization; mLP rest MDP, mLP restores MDP; pos syn, positive synergy; emer pos syn, emergent positive synergy; high stab, high stabilization; MDP inh mLP, MDP inhibits mLP; mLP inh MDP, mLP inhibits MDP; neg syn, negative synergy; Emer neg syn, emergent negative synergy. Error bars represent s.e.m. of five independent replicates.
Figure 5
Figure 5. Selective integration mode imprinting of pathways and networks.
(a) The table shows the top enriched canonical pathways or biological functions corresponding to each interaction mode. (b) The background distribution of the interaction strength (ΔeiX+Y−ΔeiXeiY) for all expressed genes, modelled by a Gaussian distribution (continuous line). Each vertical bar corresponds to a gene whose colour code represents its classification in one interaction mode. Additive genes are in dark. (c) Distribution of the interaction strength calculated for the genes in the annotation terms ‘DC maturation' and (d) ‘tRNA aminoacyl biosynthesis', as compared with the background. The continuous lines represent a Gaussian fit to the empirical distributions, and the colour keeps track of the dominating mode in the corresponding annotation term. (e,f) Fully monomodal connected networks extracted from the classes ‘DC maturation' and ‘tRNA aminoacyl biosynthesis'. Abbreviations as in Fig. 4. IPA: Ingenuity Pathway Analysis.

References

    1. Edwards J. S., Ibarra R. U. & Palsson B. O. In silico predictions of Escherichia coli metabolic capabilities are consistent with experimental data. Nat. Biotechnol. 19, 125–130 (2001). - PubMed
    1. Prost L. R. et al.. Activation of the bacterial sensor kinase PhoQ by acidic pH. Mol. Cell 26, 165–174 (2007). - PubMed
    1. Bassel G. W. et al.. Systems analysis of plant functional, transcriptional, physical interaction, and metabolic networks. Plant Cell 24, 3859–3875 (2012). - PMC - PubMed
    1. Plate L. & Marletta M. A. Nitric oxide modulates bacterial biofilm formation through a multicomponent cyclic-di-GMP signaling network. Mol. Cell 46, 449–460 (2012). - PMC - PubMed
    1. Capra E. J. & Laub M. T. Evolution of two-component signal transduction systems. Annu. Rev. Microbiol. 66, 325–347 (2012). - PMC - PubMed

Publication types