. 2015 Apr 21:6:6899.
doi: 10.1038/ncomms7899.

A STIM2 splice variant negatively regulates store-operated calcium entry

Affiliations

A STIM2 splice variant negatively regulates store-operated calcium entry

Anna-Maria Miederer et al. Nat Commun. .

Abstract

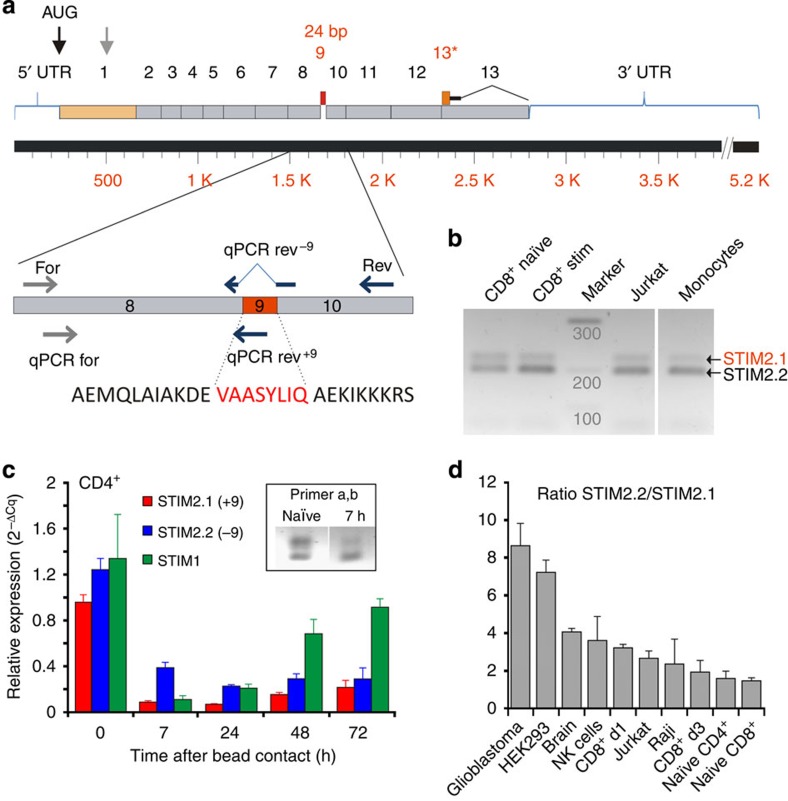
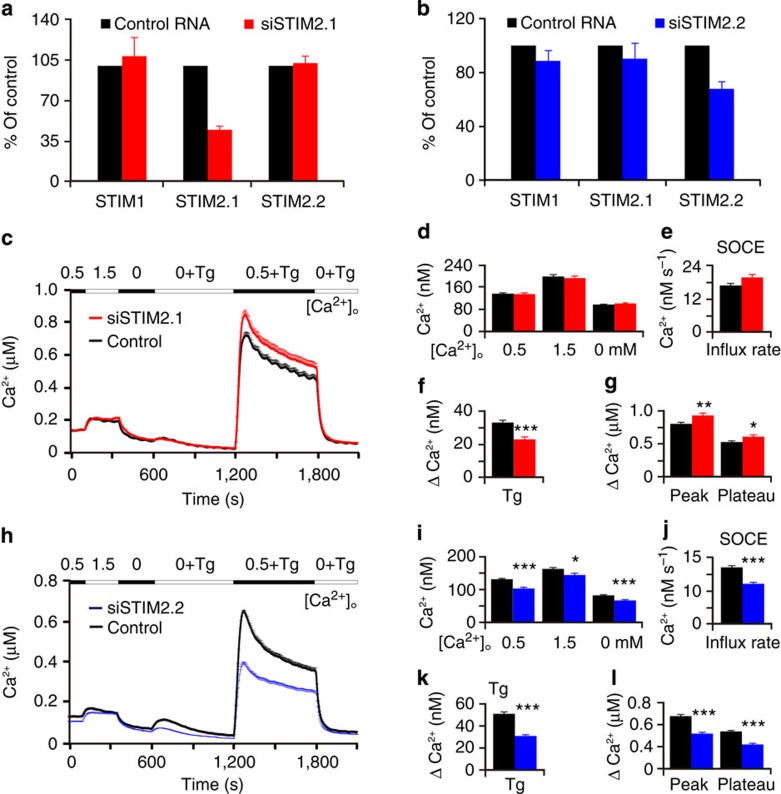
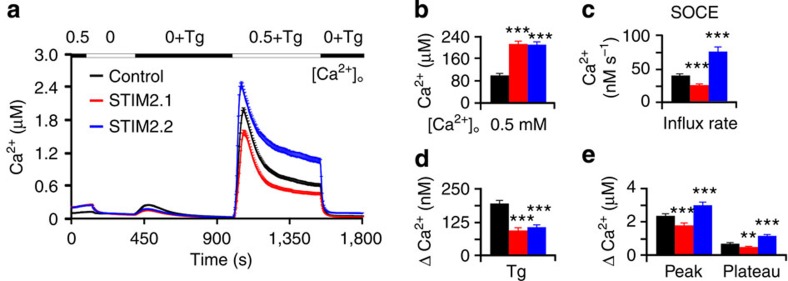
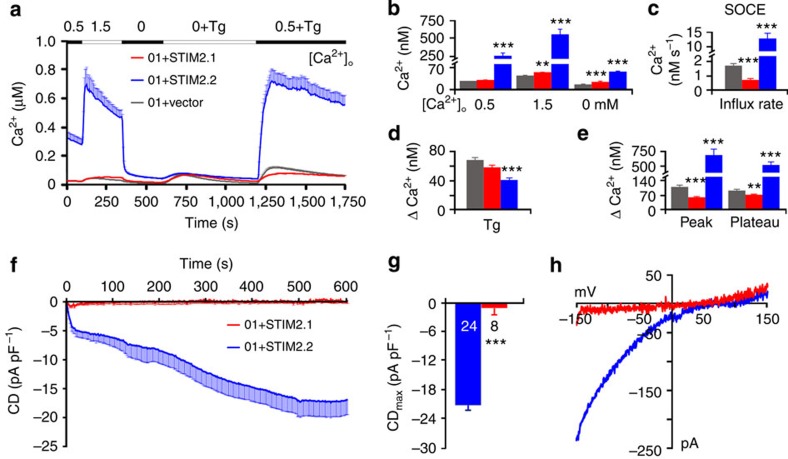
Cellular homeostasis relies upon precise regulation of Ca(2+) concentration. Stromal interaction molecule (STIM) proteins regulate store-operated calcium entry (SOCE) by sensing Ca(2+) concentration in the ER and forming oligomers to trigger Ca(2+) entry through plasma membrane-localized Orai1 channels. Here we characterize a STIM2 splice variant, STIM2.1, which retains an additional exon within the region encoding the channel-activating domain. Expression of STIM2.1 is ubiquitous but its abundance relative to the more common STIM2.2 variant is dependent upon cell type and highest in naive T cells. STIM2.1 knockdown increases SOCE in naive CD4(+) T cells, whereas knockdown of STIM2.2 decreases SOCE. Conversely, overexpression of STIM2.1, but not STIM2.2, decreases SOCE, indicating its inhibitory role. STIM2.1 interaction with Orai1 is impaired and prevents Orai1 activation, but STIM2.1 shows increased affinity towards calmodulin. Our results imply STIM2.1 as an additional player tuning Orai1 activation in vivo.


Figures

Figure 1
Figure 1. Identification of a novel STIM2 splice variant.
(a) Schematic representation of human STIM2 mRNA with exon boundaries. Highlighted in red are exon 9 and 13* present only in the splice variants STIM2.1 and STIM2.3, respectively. The enlarged region shows the primer pairs used in conventional (for: grey arrow and rev: blue arrow) or quantitative (qPCR for, qPCR rev −9, qPCR rev +9) PCRs to detect and analyse splice variant expression. (b) Image showing PCR amplification products obtained with primer pair (for and rev) using cDNA from naive and stimulated human CD8+T cells, Jurkat T cells and human monocytes. (c) Relative expression of STIM1, STIM2.1 and STIM2.2 in naive and stimulated CD4+ T cells with indicated time periods after initial contact with anti-CD3/anti-CD28-coated beads. Expression was normalized to that of TBP (three donors) (d) Ratio of STIM2.2/STIM2.1 expression obtained by qRT–PCR using reverse-transcribed mRNA isolated from the cell types indicated below the bars (3–12 donors or independent RNA preparations).
Figure 2
Figure 2. Specific knockdown of STIM2.1 alters SOCE in primary cells.
(a) Relative expression of STIM1, STIM2.1 and STIM2.2 after transfection with siRNA against exon 9 (STIM2.1) red or siRNA against exon 8/10 boundary (b, STIM2.2, blue), corresponding control transfection, black bars. (c) Traces showing average changes in intracellular Ca2+ concentration [Ca2+]i over time in CD4+ T cells transfected with control (black, n=698) or siRNA against STIM2.1 (red, n=579) in response to perfusion of different [Ca2+]o indicated in the upper bar. (dg) Quantification of changes in [Ca2+]i measured in c. (h) Traces showing changes in [Ca2+]i in CD4+ T cells treated as in c after transfection with control (black, n=978) or siRNA against STIM2.2 (blue, n=776). (il) Quantification of changes in [Ca2+]i measured in h. Measurements shown in cl are obtained from cells of three independent blood donors and ⩾8 experiments. *P<0.05, **P<0.01, ***P<0.001, Student's T-test. Data obtained are presented as mean±s.e.m.
Figure 3
Figure 3. Upregulation of STIM2.1 decreases T-cell SOCE.
(a) Traces showing average changes in intracellular Ca2+ concentration [Ca2+]i over time in Jurkat T cells transfected with control (black), STIM2.1-mCherry (red) or STIM2.2-mCherry (blue) in response to perfusion of different [Ca2+]o indicated in the upper bar. (be) Quantification of changes in [Ca2+]i measured in a from 131 to 216 cells of 6 experiments. **P<0.01, ***P<0.001, Student's T-test. Data obtained are presented as mean±s.e.m.
Figure 4
Figure 4. STIM2.1 is unable to activate Orai1 in overexpression systems.
(a) Traces showing average changes in intracellular Ca2+ concentration [Ca2+]i over time in response to perfusion of different [Ca2+]o indicated in the upper bar in HEKO1 cells transfected with YFP-STIM2.1 (red, n=96) or YFP-STIM2.2 (blue, n=107) or an empty vector control (grey, n=72), 6 experiments per condition. (be) Quantification of changes in [Ca2+]i measured in a. (f) Average traces showing whole-cell current density (CD) over time extracted at −130 mV in HEKO1 cells transfected with YFP-STIM2.1 (red) or YFP-STIM2.2 (blue). (g) Average maximum CD recorded from cells measured in f. (h) Current–voltage (IV) relationship of representative cells recorded in f. **P<0.01, ***P<0.001, Student's T-test. Data obtained are presented as mean±s.e.m.
Figure 5
Figure 5. Co-localization and interaction analyses.
(a) Images showing HEKWT cells expressing Orai1-GFP (green), STIM2.1- (upper panel) or STIM2.2 (lower panel)-mCherry (red) and the corresponding overlay and FRET images (LUT 0–0.3). (b) Analysis of co-localization of STIM2 and Orai1 using Manders coefficient (M1) or vice versa (M2) (n=9 images for both conditions) in the same cells as analysed for FRET (STIM2.1-Orai1 n=36; STIM2.2-Orai1 n=31, from 3 independent experiments). (c) Quantification of the FRET signals measured in a. *P<0.05, ***P<0.001, Student T-test. Data obtained are presented as mean±s.e.m. (d) Representative images of cells measured in a before Tg stimulation. Scale bars, 10 μm.
Figure 6
Figure 6. STIM2.1 opposes STIM2.2 function.
(a) Traces showing average changes in intracellular Ca2+ concentration [Ca2+]i over time in response to perfusion of different [Ca2+]o indicated in the upper bar in HEKO1 cells co-transfected with 0.5 μg CFP-STIM2.2 together with YFP-control vector (blue) or 1 μg YFP-STIM2.1 (purple). (be) Quantification of changes in [Ca2+]i measured in a from 66–69 cells of 6 experiments. (f) Average traces showing whole-cell current density (CD) over time extracted at −130 mV in HEKO1 cells co-transfected like in a or with 1 μg YFP-STIM2.1 (red, same trace as Fig. 4f) with internal solution clamping [Ca2+] to 0. (g) Average traces showing whole-cell CD over time measured from cells transfected like in f with an internal solution clamping [Ca2+] to 150 nM. Grey box denotes time points between 12 and 90 s after break-in. (h,j) Average maximum CD recorded from cells measured in f and g, respectively. (i,k) Current–voltage (IV) relationship of representative cells recorded at maximal current in f and g, respectively. **P<0.01, ***P<0.001, Student's T-test. Data obtained are presented as mean±s.e.m.
Figure 7
Figure 7. Structural comparison of the STIM CAD domains in the presence or absence of Orai1 C-terminal peptide domain.
(a) Homology models of the STIM1, STIM2.2 and STIM2.1 CAD domains. The homology models were built according to the template human STIM1 CAD domain (PDB ID: 3TEQ). The inserted segment in the STIM2.1 model is coloured in pink. (b) Docking the C-terminal helix of Orai1 on STIM dimers. STIM CAD domains are coloured in grey. The conformations of the C-terminal helix of Orai1 were predicted by the docking packages DOT2 (cyan), FRODOCK (magenta) and ZDOCK (yellow). Motif 1: upper part of CAD domain that is supposed to be close to or in contact with the membrane containing ORAI channel proteins. Motif 2: region near the crossing of STIM CAD dimerization domain. Motif 3: the lateral face of STIM CAD near the dimerization domain. (c) Electrostatic potential distribution on the solvent-accessible surfaces of the STIM CAD domains. The unit of electrostatic potential used is kT e−1. Dimerization domain (Dd).
Figure 8
Figure 8. Characterization of Orai1 and Calmodulin-binding properties of STIM2.1 and STIM2.2.
(a) 14C-labelled calmodulin (CaM) binding to STIM2 peptide arrays. (b) Biotinylated Orai1 C-term peptide binding to identical STIM2 peptide array as in a. Spots encircled with a red dotted line represent peptides encoding exon 9 sequences, blue dotted line represent peptides encoding the sequence flanking exon 9 (exon 8/10 transition unique in STIM2.2) and black circles represent peptides encoding conserved sequence in both splice variants. (c) Quantification of bound Orai1 peptide (black bars) or CaM (white bars) to the different peptide spots. (d) Schematic representation of partial sequences of STIM2.1 (upper sequence) or STIM2.2 (lower sequence) encoded by the spotted peptides, showing the domains binding to CaM in STIM2.1 (yellow, encoded by peptides 7–9 and 16–17) and in STIM2.2 (yellow, encoded by peptides 35–38) and the identical Orai1-binding domain (red encoded by peptide 12 for STIM2.1 and peptide 41 for STIM2.2). (e,f) Surface plasmon resonance (SPR) analysis of the binding affinity of calmodulin with representative binding curve sensorgrams showing real association and dissociation of purified CAD domains of STIM2.2 (red-filled boxes denote differences to STIM1). (e) or STIM2.1 (f) with immobilized CaM. (g) Average Kd values for CaM binding of STIM2.2 (blue) or STIM2.1 (red) obtained from five independent experiments using CAD concentrations ranging from 7.5 to 750 nM, *P<0.05, Student's T-test. Data obtained are presented as mean±s.e.m.

Similar articles

Cited by

References

    1. Demaurex N. & Frieden M. Measurements of the free luminal ER Ca(2+) concentration with targeted ‘cameleon' fluorescent proteins. Cell Calcium 34, 109–119 (2003). - PubMed
    1. Prakriya M. E. Store-operated calcium channels. Curr. Top. Membr. 71, 1–273 (2013). - PubMed
    1. Soboloff J. et al.. Orai1 and STIM reconstitute store-operated calcium channel function. J. Biol. Chem. 281, 20661–20665 (2006). - PubMed
    1. Brandman O., Liou J., Park W. S. & Meyer T. STIM2 is a feedback regulator that stabilizes basal cytosolic and endoplasmic reticulum Ca2+ levels. Cell 131, 1327–1339 (2007). - PMC - PubMed
    1. Zheng L., Stathopulos P. B., Li G. Y. & Ikura M. Biophysical characterization of the EF-hand and SAM domain containing Ca2+ sensory region of STIM1 and STIM2. Biochem. Biophys. Res. Commun. 369, 240–246 (2008). - PubMed

Publication types