. 2015 Jul;134(7):717-35.
doi: 10.1007/s00439-015-1554-5. Epub 2015 Apr 21.

Compound mouse mutants of bZIP transcription factors Mafg and Mafk reveal a regulatory network of non-crystallin genes associated with cataract

Affiliations

Compound mouse mutants of bZIP transcription factors Mafg and Mafk reveal a regulatory network of non-crystallin genes associated with cataract

Smriti A Agrawal et al. Hum Genet. 2015 Jul.

Abstract

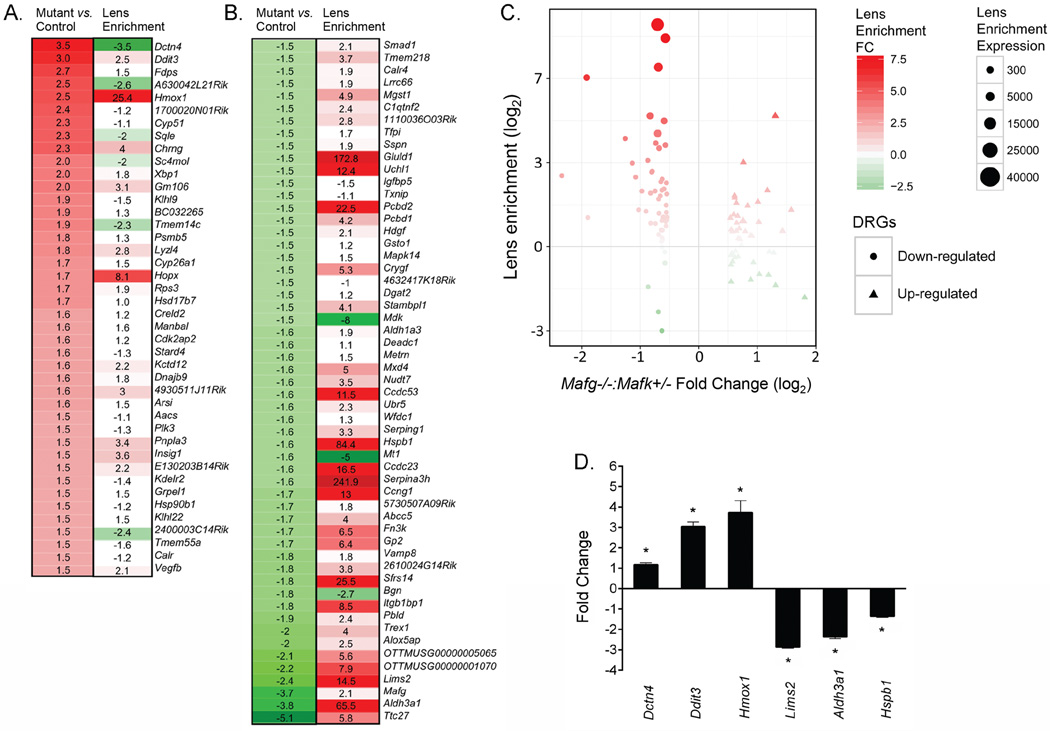
Although majority of the genes linked to early-onset cataract exhibit lens fiber cell-enriched expression, our understanding of gene regulation in these cells is limited to function of just eight transcription factors and largely in the context of crystallins. We report on small Maf transcription factors Mafg and Mafk as regulators of several non-crystallin human cataract-associated genes in fiber cells and establish their significance to this disease. We applied a bioinformatics tool for cataract gene discovery iSyTE to identify Mafg and its co-regulators in the lens, and generated various null-allelic combinations of Mafg:Mafk mouse mutants for phenotypic and molecular analysis. By age 4 months, Mafg-/-:Mafk+/- mutants exhibit lens defects that progressively develop into cataract. High-resolution phenotypic characterization of Mafg-/-:Mafk+/- mouse lens reveals severely disorganized fiber cells, while microarray-based expression profiling identifies 97 differentially regulated genes (DRGs). Integrative analysis of Mafg-/-:Mafk+/- lens-DRGs with (1) binding motifs and genomic targets of small Mafs and their regulatory partners, (2) iSyTE lens expression data, and (3) interactions between DRGs in the String database, unravel a detailed small Maf regulatory network in the lens, several nodes of which are linked to cataract. This approach identifies 36 high-priority candidates from the original 97 DRGs. Significantly, 8/36 (22%) DRGs are associated with cataracts in human (GSTO1, MGST1, SC4MOL, UCHL1) or mouse (Aldh3a1, Crygf, Hspb1, Pcbd1), suggesting a multifactorial etiology that includes oxidative stress and misregulation of sterol synthesis. These data identify Mafg and Mafk as new cataract-associated candidates and define their function in regulating largely non-crystallin genes linked to human cataract.


Conflict of interest statement

CONFLICT OF INTEREST

None declared.

Figures

Figure 1
Figure 1
Expression of small Maf transcription factors in the mouse lens. A. iSyTE identifies MAFG as a highly lens-enriched gene, among the top 1% of lens-enriched genes. iSyTE is based on microarray expression datasets of genes that are scored for their differential regulation in the lens when compared to a reference dataset of whole body embryonic tissue (WB) allowing for t-statistic-based estimation of “lens-enrichment”. Based on the t-statistic values, lens-enriched genes can be viewed through user-friendly “iSyTE” tracks in the UCSC Genome browser to aid prioritization of genes with potential lens function. Genes with high lens-enrichment are represented by intense red color while genes that are not lens-enriched are represented by intense blue color. B. Analysis of lens microarrays from mouse embryonic and postnatal stages indicates that while Maff is largely absent and Mafk is expressed at low levels, Mafg exhibits highly enriched expression in the embryonic and early post-natal mouse lens. Probe binding fluorescent signal intensity values for all three small Maf genes, which are reflective of their expression, are plotted on the Y-axis for different lens stages and the WB reference dataset described in iSyTE. C. Real time quantitative RT-PCR confirms that Mafg and Mafk, but not Maff are expressed in post-natal mouse lens, and Mafg expression, although always lens-enriched, is progressively reduced in postnatal development. D. In situ hybridization demonstrates the presence of Mafg transcripts in transition zone (tz) cells and fiber cells (f) but not in epithelium (e) of E12.5 mouse lens. D’. High magnification image of area indicated by dotted box in D. Mafg expression is indicated by white asterisks. E. At E14.5, in situ hybridization demonstrates the continued presence of Mafg transcripts in mouse lens transition zone (tz) cells and fiber cells (f) but not in epithelium (e). E’. High magnification image of area indicated by dotted box in E, in which white asterix indicates Mafg expression. F. Immunostaining with antibody that recognizes Mafg, Mafk, Maff demonstrates the presence of small Maf proteins (sMaf) in the nuclei and cytoplasm of transition zone (tz) cells and fiber cells (f) but not in epithelium (e) of E14.5 mouse lens. F’. High magnification image of area indicated by dotted box in F. sMaf expression is indicated by white arrowheads. G. At E16.5, the above antibody demonstrates the continued presence of small Maf proteins in the nuclei and cytoplasm of mouse lens transition zone (tz) cells and fiber cells (f) but not in epithelium (e). G’. High magnification image of area indicated by dotted box in G, in which white arrowheads indicate the expression of sMaf proteins. Statistical significance in B, C, is as follows: one asterisk indicates p-value of 0.05, two asterisks indicate p-value of 0.005, three asterisks indicate p-value of 0.001. Scale bar in F is 50 µm, F’ is 15 µm; G is 100 µm and G’ is 15 µm.
Figure 2
Figure 2
Investigation of lens defects in Mafg:Mafk mouse mutants. A. Imaging of various Mafg:Mafk mutants at age 4 months revealed that Mafg−/−:Mafk+/− mice exhibit distinct lens opacity (indicated by arrowhead). Dark field imaging of dissected eyes from Mafg−/−:Mafk+/− mice demonstrates the presence of an overt cataract phenotype (back asterisk). Bright field imaging of dissected lens on metal grid indicates a complete lack of visibility of underlying hexagonal patterns in turn demonstrating the severe nature of lens abnormality in Mafg−/−:Mafk+/− mice. Comparative analysis was performed with mouse mutants including Mafg+/+:Mafk+/+, Mafg+/−:Mafk+/−, Mafg+/−:Mafk−/−, and Mafg−/−:Mafk+/+, all of which lacked lens defects. Mafg+/−:Mafk+/+, Mafg+/+:Mafk+/− and Mafg+/+:Mafk−/− mutants were also tested and lacked lens defects (data not shown). B. Progression of lens defects in Mafg−/−:Mafk+/− mouse mutants. Lens defects were analyzed in ages 2 through 8 months Mafg−/−:Mafk+/− mouse mutants (represented by closed circles) and Mafg+/−:Mafk+/− controls (represented by open circles). Lenses were scored as clear, hazy, or opaque as indicated by the images on right. All Mafg+/−:Mafk+/− control double mutants exhibited normal eye and lens through all stages tested. At age 3 months, hazy eyes were observed in Mafg−/−:Mafk+/− mutants, while from age 4 months onwards, lenses with severe opacity and cataract were detected. By age 8 months, all Mafg−/−:Mafk+/− mutants tested exhibit severe lens opacities. Scale bar represents 1mm.
Figure 3
Figure 3
Mafg−/−:Mafk+/− mouse mutant exhibit fiber cell defects. Histological analysis using hematoxylin and eosin staining was performed on eye sections from various Mafg:Mafk mutants at age 4 months. Severely defective Mafg−/−:Mafk+/− mutant lens exhibits large cortical vacuoles (arrowheads) in the fiber cell compartment while eyes and lens of Mafg+/+:Mafk+/+, Mafg+/−:Mafk+/−, and Mafg+/−:Mafk−/− appear normal. High resolution scanning electron microscopy of severely affected Mafg−/−:Mafk+/− mutant mouse lens shows disorganization of fiber cell packing, lack of membrane protrusions, and overall severe disruption of the cortical fibers. In contrast, cortical fiber cells of Mafg+/+:Mafk+/+, Mafg+/−:Mafk+/−, and Mafg+/−:Mafk−/− mouse lens at age 4 months appear normal. For both analyses, high magnification images of specific areas are indicated by dotted box in lower panels. Histology scare bars: top panel, 100µm; bottom panel, scale bar, 50µm. Scanning electron microscopy scale bars: top panel, 10µm; bottom panel, 5µm.
Figure 4
Figure 4
Mafg−/−:Mafk−/− double knockout mouse mutants exhibit defects in embryonic lens development. Histological analysis using hematoxylin and eosin staining was performed on embryonic head sections from E16.5 Mafg−/−:Mafk−/− mutant or Mafg+/−:Mafk+/− control mice. The white broken line box in the image on left indicates area that is shown at high magnification on the right. While the lens appears normal in control, Mafg−/−:Mafk−/− mutant lens exhibits abnormalities (indicated by white arrowhead) near the lens fulcrum and beyond the transition zone (tz) where cells of the epithelium (e) exit the cell cycle and begin differentiating into fiber cells (f).
Figure 5
Figure 5
Mafg−/−:Mafk+/− mouse mutants exhibit defects in lens gene expression. A. Analysis of genes that are up-regulated in Mafg−/−:Mafk+/− lens. Column on left is a heatmap that is indicative of genes up-regulated in Mafg−/−:Mafk+/− lens compared to control (Mafg+/−:Mafk+/−) lens. Increased expression in fold-change is indicated by intensity of red color. Column on right is a heatmap that is indicative of lens-enrichment of each candidate gene as per the iSyTE approach. Increased lens-enrichment in fold-change is indicated by intensity of red color. Decreased lens-enrichment in fold-change is indicated by intensity of green color. B. Analysis of genes that are down-regulated in Mafg−/−:Mafk+/− lens. Column on left is a heatmap that is indicative of genes down-regulated in Mafg−/−:Mafk+/− lens compared to control lens. Increased expression in fold-change is indicated by intensity of green color. Column on right is a heatmap that is indicative lens-enrichment of each candidate gene as per the iSyTE approach as described above. C. Genes down-regulated in Mafg−/−:Mafk+/− mutants are identified as significantly lens-enriched by iSyTE. Candidate genes from microarray analysis are plotted on the X-axis based on their differential regulation (up-regulated genes are represented by triangles, down-regulated genes are represented by circles) in Mafg−/−:Mafk+/− mutant lens and on the Y-axis based on their lens-enrichment (lens-enrichment represented by red intensity, non-enrichment in lens represented by green intensity) as per the iSyTE approach. While 46 of the 55 down-regulated genes in mutant lens are lens-enriched, only 15 of 42 up-regulated genes are identified as such. Chi-square calculated for differences between lens enriched and non-enriched genes between these datasets equals 425.92 at two-tailed p-value less than 0.0001, and therefore is statistically significant. D. Real time quantitative RT-PCR analysis validates the differential regulation in Mafg−/−:Mafk+/− mutant lens of select candidate genes identified by microarray analysis. Fold-change over Mafg+/−:Mafk+/− control lens is indicated on Y-axis. Statistical significance is indicated by asterisk as p-value of <0.05.
Figure 6
Figure 6
Integrated analysis-derived small Maf regulatory network in the mouse lens. Based on the integration of various datasets - including differentially regulated genes (DRGs) in Mafg−/−:Mafk+/− mutant lens and their interactions in String database, in vivo cis-binding evidence for small Maf or their co-regulatory proteins in DRGs, presence of small Maf binding motifs in DRGs, as well as lens-relevant expression in iSyTE - a model for the small Maf functional regulatory network in the lens is proposed. Since mouse genetics-based analysis indicates the importance of Mafg in the lens, the circuitry is featured around it. This regulatory network suggests that lens defects in the small Maf mutant Mafg−/−:Mafk+/− are caused by altered regulation of genes largely encoding non-crystallin proteins that function in diverse pathways critical to various aspects of lens biology. Key to nodes, edges, and color schemes in provided in the figure and more details are discussed in the manuscript. In GO terminology, “Cataract-associated gene” represents a custom-assigned category.
Figure 7
Figure 7
Integrated analysis-derived small MAF regulatory network predicted in the human lens. Similar to the analysis performed using mouse datasets, a model for the small MAF functional regulatory network in the human lens is proposed. This analysis is based on the integration of various datasets - including DRGs in Mafg−/−:Mafk+/− mutant lens and their specific interactions in the String database for human, in vivo cis-binding evidence for small MAF or their co-regulatory proteins in DRGs, presence of small MAF binding motifs in DRGs, and expression in the lens according to the iSyTE approach. Key to nodes, edges, and color schemes in provided in the figure.

References

    1. Alizadeh A, Clark J, Seeberger T, et al. Characterization of a mutation in the lens-specific CP49 in the 129 strain of mouse. Invest Ophthalmol Vis Sci. 2004;45:884–891. - PubMed
    1. Bassnett S, Shi Y, Vrensen GFJM. Biological glass: structural determinants of eye lens transparency. Philos Trans R Soc Lond, B, Biol Sci. 2011;366:1250–1264. - PMC - PubMed
    1. Bayle JH, Randazzo F, Johnen G, et al. Hyperphenylalaninemia and impaired glucose tolerance in mice lacking the bifunctional DCoH gene. J Biol Chem. 2002;277:28884–28891. - PubMed
    1. Berry V, Francis P, Reddy MA, et al. Alpha-B crystallin gene (CRYAB) mutation causes dominant congenital posterior polar cataract in humans. Am J Hum Genet. 2001;69:1141–1145. - PMC - PubMed
    1. Berthoud VM, Beyer EC. Oxidative stress, lens gap junctions, and cataracts. Antioxid Redox Signal. 2009;11:339–353. - PMC - PubMed

Publication types