. 2015 Apr 22:15:69.
doi: 10.1186/s12862-015-0339-8.

Do larger genomes contain more diverse transposable elements?

Affiliations

Do larger genomes contain more diverse transposable elements?

Tyler A Elliott et al. BMC Evol Biol. .

Abstract

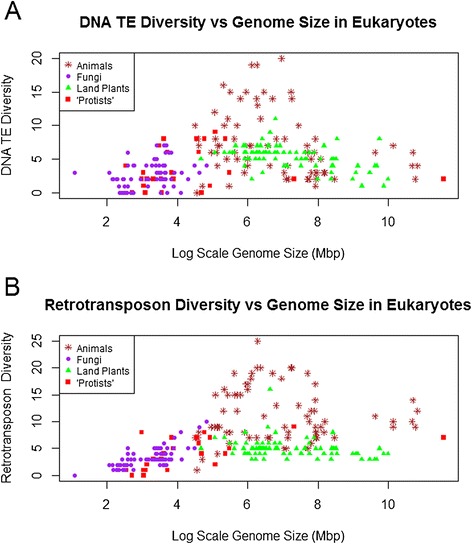
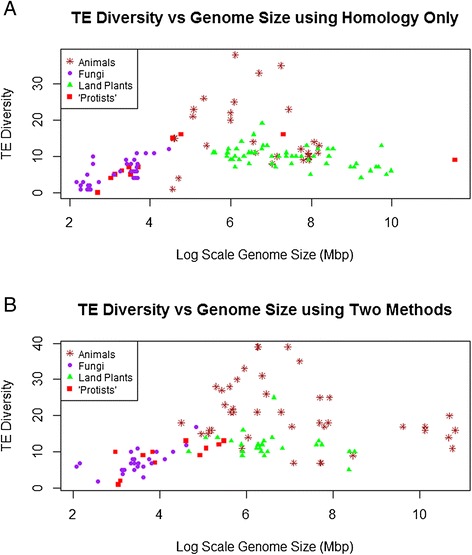
Background: The genomes of eukaryotes vary enormously in size, with much of this diversity driven by differences in the abundances of transposable elements (TEs). There is also substantial structural and phylogenetic diversity among TEs, such that they can be classified into distinct classes, superfamilies, and families. Possible relationships between TE diversity (and not just abundance) and genome size have not been investigated to date, though there are reasons to expect either a positive or a negative correlation. This study compares data from 257 species of animals, plants, fungi, and "protists" to determine whether TE diversity at the superfamily level is related to genome size.

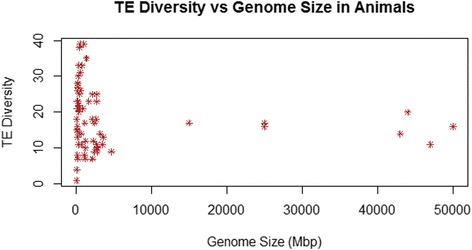
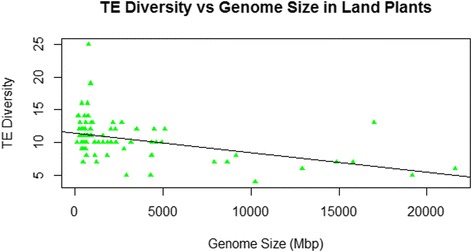
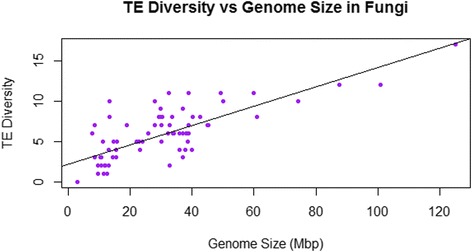
Results: No simple relationship was found between TE diversity and genome size. There is no significant correlation across all eukaryotes, but there is a positive correlation for genomes below 500 Mbp and a negative correlation among land plants. No relationships were found across animals or within vertebrates. Some TE superfamilies tend to be present across all major groups of eukaryotes, but there is considerable variance in TE diversity in different taxa.

Conclusions: Differences in genome size are thought to arise primarily through accumulation of TEs, but beyond a certain point (~500 Mbp), TE diversity does not increase with genome size. Several possible explanations for these complex patterns are discussed, and recommendations to facilitate future analyses are provided.


Figures

Figure 1
Figure 1
Number of superfamilies (TE diversity) and log-scale genome size (Mbp) in 257 eukaryote genomes. Brown points represent animal genomes, green points represent land plant genomes, purple points represent fungal genomes and red points represent “protist” genomes. This includes all available data, regardless of TE discovery and annotation method (cf. Figure 6).
Figure 2
Figure 2
TE diversity versus genome size separated into the two TE classes. (A) Number of superfamilies’ (TE diversity) of DNA transposons and log-scale genome size (Mbp) in 257 eukaryote genomes. (B) Number of superfamilies’ (TE diversity) of retrotransposons and log-scale genome size (Mbp) in 257 eukaryote genomes. Brown points represent animal genomes, green points represent land plant genomes, purple points represent fungal genomes and red points represent “protist’ genomes.
Figure 3
Figure 3
Number of superfamilies (TE diversity) and genome size (Mbp) in 75 animal genomes. There was no linear relationship across all animals (r = −0.12, p > 0.3).
Figure 4
Figure 4
Number of superfamilies (TE diversity) and genome size (Mbp) in 80 land plant genomes. The line represents the significant negative correlation between TE diversity and genome size among plants (r = −0.44, p < 0.0001).
Figure 5
Figure 5
TE diversity versus genome size in fungi. Number of superfamilies (TE diversity) and genome size (Mbp) in 77 fungal genomes. The line represents the significant positive correlation between TE diversity and genome size in fungi (r = 0.764, p < 0.0001).
Figure 6
Figure 6
Effects of TE discovery method. The overall pattern of TE diversity versus genome size among eukaryotes according to whether TE discovery was A) based only on sequence similarity against an existing database or B) based on both sequence similarity and de novo discovery. (A much smaller number of studies used only de novo methods, and are not shown in a separate analysis). Importantly, the general patterns are the same regardless of TE discovery method(s) used (see also Figure 1). Brown points represent animal genomes, green points represent land plant genomes, purple points represent fungal genomes and red points represent “protist” genomes.

References

    1. Gregory TR, DeSalle R. Comparative genomics in eukaryotes. In: Gregory TR, editor. The Evolution of the Genome. San Diego: Elsevier; 2005. pp. 585–675.
    1. Corradi N, Pombert J-F, Farinelli L, Didier ES, Keeling PJ. The complete sequence of the smallest known nuclear genome from the microsporidian Encephalitozoon intestinalis. Nat Commun. 2010;1:77. doi: 10.1038/ncomms1082. - DOI - PMC - PubMed
    1. Pellicer J, Fay MF, Leitch IJ. The largest eukaryotic genome of them all? Bot J Linn Soc. 2010;164:10–15. doi: 10.1111/j.1095-8339.2010.01072.x. - DOI
    1. Gregory TR. Animal Genome Size Database. [http://www.genomesize.com]
    1. Bennett MD, Leitch IJ. Plant DNA C-values Database. [http://data.kew.org/cvalues/]

Publication types

Substances

LinkOut - more resources