. 2015 Jul 1:114:275-86.
doi: 10.1016/j.neuroimage.2015.04.026. Epub 2015 Apr 17.

Visual representations are dominated by intrinsic fluctuations correlated between areas

Affiliations

Visual representations are dominated by intrinsic fluctuations correlated between areas

Linda Henriksson et al. Neuroimage. .

Abstract

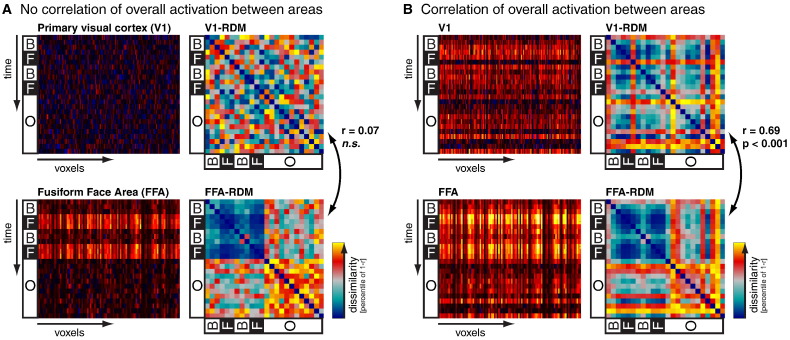
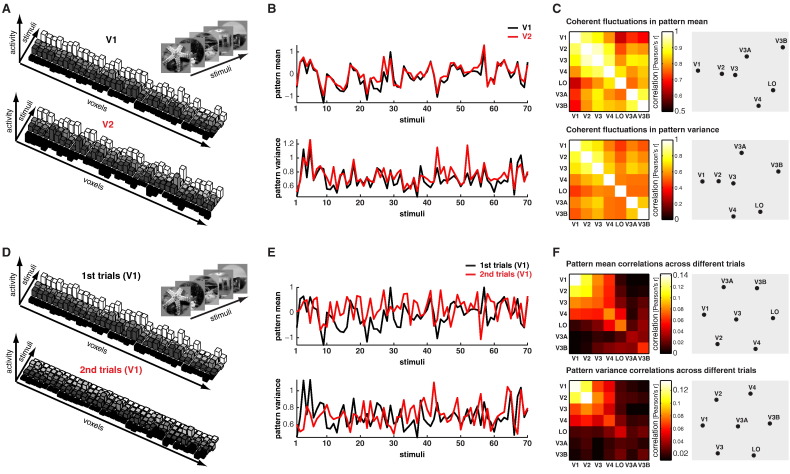
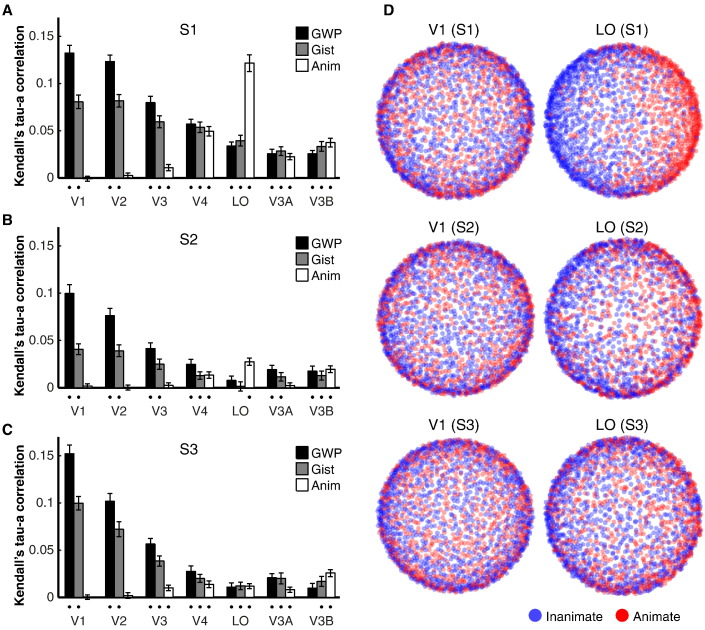
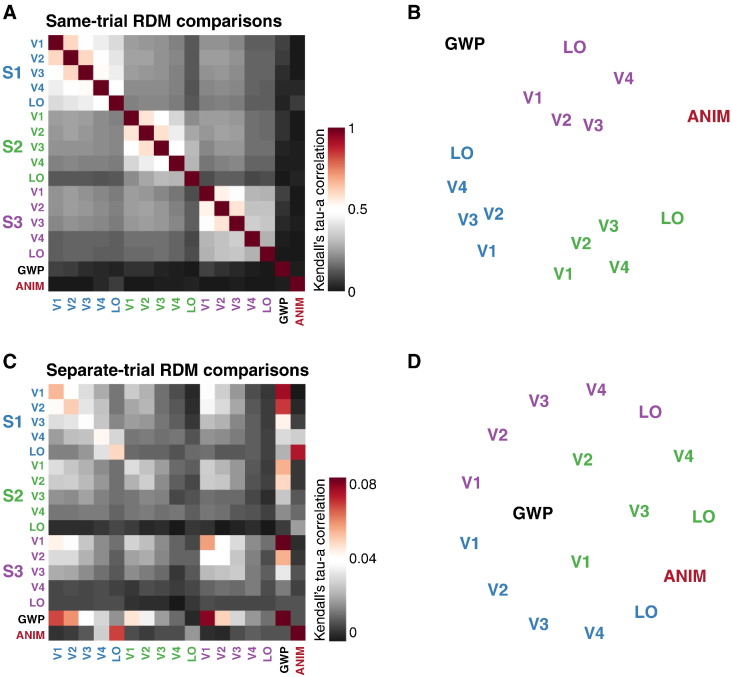
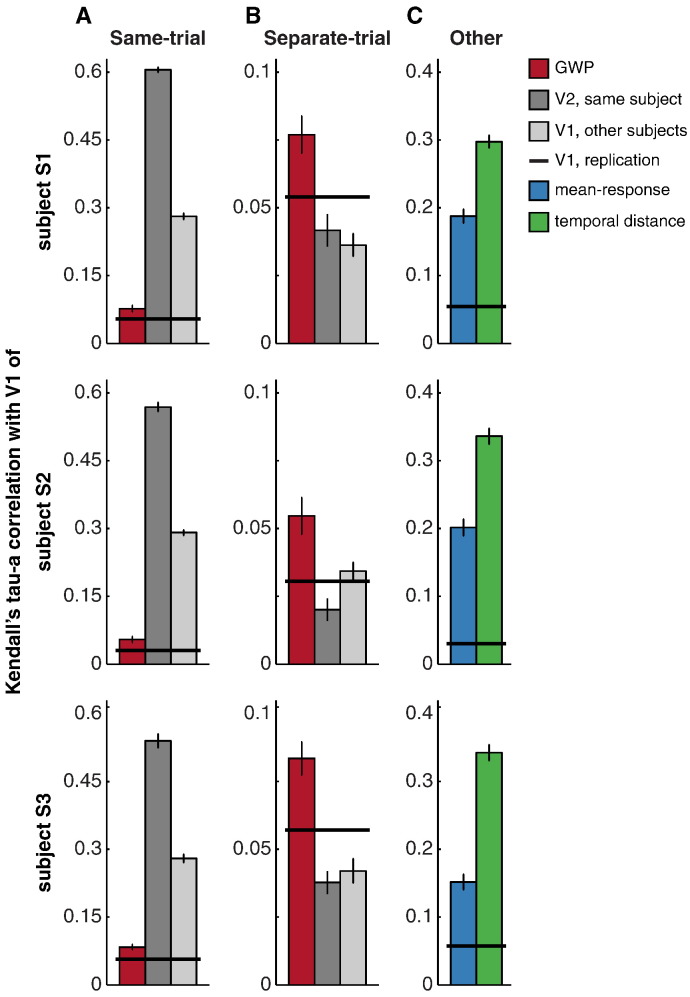
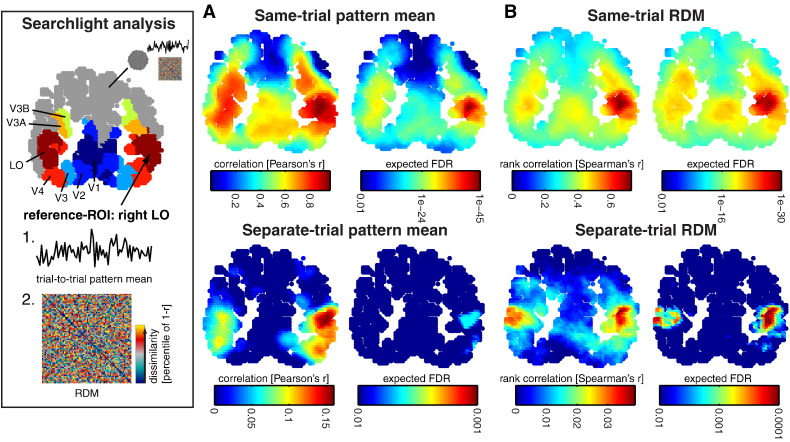
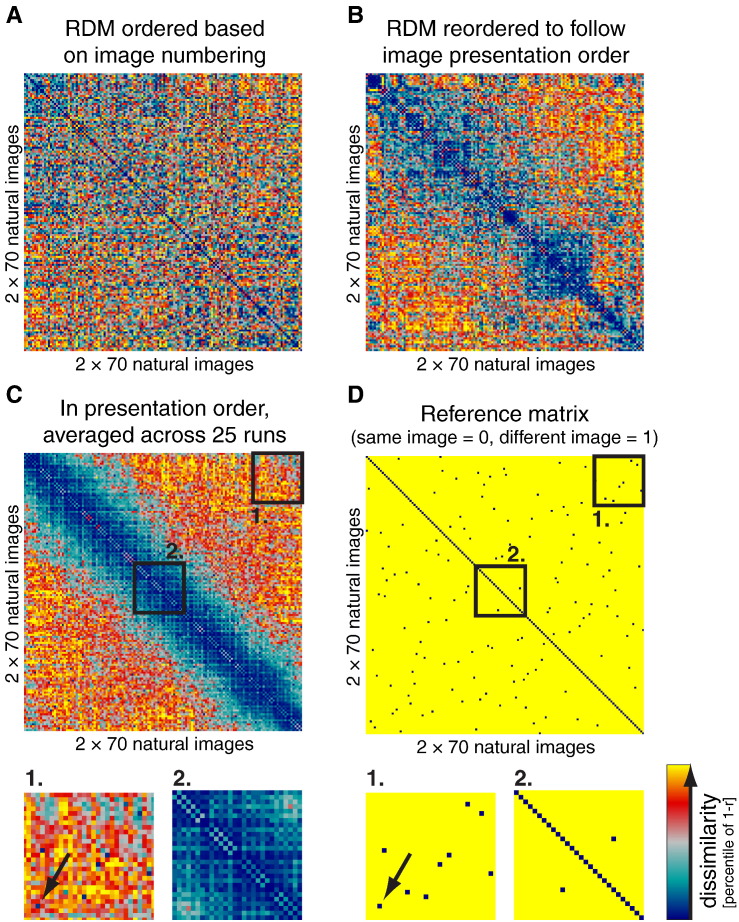
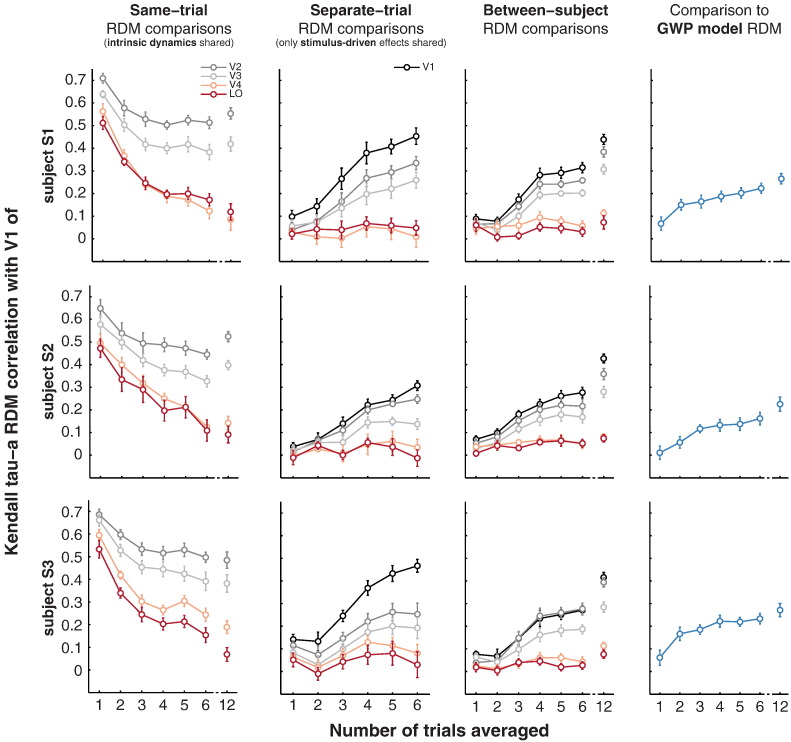
Intrinsic cortical dynamics are thought to underlie trial-to-trial variability of visually evoked responses in animal models. Understanding their function in the context of sensory processing and representation is a major current challenge. Here we report that intrinsic cortical dynamics strongly affect the representational geometry of a brain region, as reflected in response-pattern dissimilarities, and exaggerate the similarity of representations between brain regions. We characterized the representations in several human visual areas by representational dissimilarity matrices (RDMs) constructed from fMRI response-patterns for natural image stimuli. The RDMs of different visual areas were highly similar when the response-patterns were estimated on the basis of the same trials (sharing intrinsic cortical dynamics), and quite distinct when patterns were estimated on the basis of separate trials (sharing only the stimulus-driven component). We show that the greater similarity of the representational geometries can be explained by coherent fluctuations of regional-mean activation within visual cortex, reflecting intrinsic dynamics. Using separate trials to study stimulus-driven representations revealed clearer distinctions between the representational geometries: a Gabor wavelet pyramid model explained representational geometry in visual areas V1-3 and a categorical animate-inanimate model in the object-responsive lateral occipital cortex.

Keywords: Functional MRI; Intrinsic dynamics; Natural images; Pattern information; Representational similarity; Visual cortex.


Figures

Fig. 1
Fig. 1
Simulation on the effects of coherent response fluctuations on RDM similarity. A) Simulated primary visual cortex (V1; 150 voxels) responds equally strongly to three categories of stimuli (B = bodies, F = faces, O = objects). The representational similarity matrix (RDM) captures the pair-wise representational distance between the response patterns for each stimulus with the V1 RDM showing no interesting structure. The simulated fusiform face area (FFA; 100 voxels) shows preference for face-stimuli (F) and responds slightly more strongly also to the bodies (B) than to objects (O). This is reflected in the FFA RDM showing most similar response-patterns for the Faces. The V1 RDM and the FFA RDM are clearly different (Spearman's rank correlation r = 0.07, not significant; condition-label randomization test (Kriegeskorte et al., 2008a)). B) A coherent response fluctuation component was added to V1 and FFA responses (for details, see the Materials and methods section). The stimulus-driven patterns remained the same but the visual areas now shared the fluctuation in the overall responsiveness across time. As a result, the RDMs of the two visual areas are highly similar (Spearman's rank correlation r = 0.69, p < 0.001; condition-label randomization test (Kriegeskorte et al., 2008a)). This shows that coherent response-pattern fluctuations can have a significant effect on visual representations as reflected in response-pattern dissimilarities.
Fig. 2
Fig. 2
Coherent response-pattern fluctuations in natural image data. A) The response amplitudes for 5 natural images are shown for a subset of voxels in visual areas V1 and V2 of subject S1. The responses in all voxels in both V1 and V2 were low for the first stimulus, stronger for the second stimulus and again lower for the fourth stimulus. That is, the visual areas showed coherent dynamics in their response patterns. B) The mean and variance of the response pattern amplitudes for 70 natural stimuli are shown for visual areas V1 and V2. Both showed highly coherent dynamics between the visual areas. C) The matrices show the mean correlations between response-pattern-means (top row) and variances (bottom row) between all pair-wise comparisons of the visual areas. The matrices are also visualized using multidimensional-scaling arrangement. What emerged from the coherence of the response-pattern fluctuations is the hierarchy of visual areas. D–F) When the comparisons were done between repeated presentations of the same stimuli (separate trials), the correlations in the response-pattern-mean and variance were much lower. As shown with the simulations in Fig. 1, this suggests a significant contribution of the coherent response fluctuations on the similarity of the RDMs from different visual areas in this data.
Fig. 3
Fig. 3
Representational similarity analysis and computational model predictions of natural image representations. A) An example stimulus image is shown. B) An example representational similarity matrix (RDM) is shown for visual area V1 of subject S1. The RDM captures the pair-wise dissimilarities between the response patterns elicited by the stimuli, here 70 different natural images. By definition, the RDM is symmetric and has a zero diagonal. C) In a split-data RDM, the dissimilarities are computed between separate presentations of the same set of stimuli. The diagonal of the split-data RDM reflects the replicability of the response patterns between the first and second stimulus presentation. D) Example RDMs for the four different models are shown for a set of 70 natural images (GWP = Gabor wavelet pyramid).
Fig. 4
Fig. 4
Distinct fMRI response patterns and replicable similarity structures for natural image stimuli. A) Results on the distinctiveness of the response patterns for the natural images are shown separately for the seven visual areas in each of the three subjects (S1, S2, S3). The error-bars indicate SEMs across the 25 experimental runs. The black dots below the bars indicate statistically significant results (t-test, p < 0.05). B) Results on the replicability of the representational similarity structure for the natural image stimuli are shown separately for the visual areas and subjects. The error-bars indicate SEMs across the 25 experimental runs. The black dots below the bars indicate statistically significant results (t-test, p < 0.05).
Fig. 5
Fig. 5
Relating computational models to cortical representations. A–C) Results on the comparisons between computational model predictions on the response pattern dissimilarities and the empirical results of different visual areas are shown separately for the three subjects. Each bar indicates the mean rank correlation between a model RDM (GWP = Gabor wavelet pyramid, Gist = spatial envelope model, Anim = categorical animate–inanimate distinction) and a brain RDM. The error-bars indicate SEMs across the 25 experimental runs. The black dots below the bars indicate statistically significant results (t-test, p < 0.05). D) A multidimensional-scaling arrangement reflects the response-pattern dissimilarities in V1 and LO for the 1750 natural images (dissimilarity: 1 - Pearson's linear correlation, criterion: metric stress) labeled as animate (red) or inanimate (blue). The results are shown separately for each subject. A clear categorical clustering is evident in area LO of subject S1, but not in V1 in any of the subjects.
Fig. 6
Fig. 6
Relating natural image representations between different visual areas, subjects and model predictions. A) A second-order similarity matrix of RDMs of visual areas (V1, V2, V3, V4, LO) in all three subjects (S1, S2, S3) and the two best-fitting models (GWP = Gabor wavelet pyramid, Anim = categorical animate–inanimate model) is shown, and B) the corresponding multidimensional-scaling arrangement (metric-stress) of the representational dissimilarities. The distances reflect the representational distance between the representations. The visual areas in the three subjects are color-coded in different colors. C) A second-order similarity matrix of RDMs, where the effects of coherent trial-to-trial fluctuations were removed by comparing RDMs from separate trials, and D) the corresponding multidimensional-scaling visualization (metric-stress) of the representational relationships. Note that when the comparison was made between the visual-area RMDs constructed from the same trials (sharing intrinsic dynamics; A–B), the representations were most similar between the visual areas within the same subject. Whereas, when the comparison was made between visual-area RDMs constructed from separate trials (sharing only stimulus-driven effects; C–D), the V1 representations of all subjects, for example, were more similar to the GWP model than to the representations in the higher-level visual areas.
Fig. 7
Fig. 7
Same-trial RDM similarity is mostly driven by effects unrelated to the stimuli. A) GWP model and same-trial RDM comparisons. The red bars show the mean Kendall's tau-a rank-correlation between single-trial V1-RDM and the GWP model. The dark gray bars show the mean rank-correlation between the single-trial V1 RDM and the single-trial V2 RDM constructed from the same trials. The light gray bars show the mean rank-correlation between the V1 RDMs of different subjects constructed from trials with same temporal structure. The black line shows results on V1 RDM replicability, that is, the correlation between V1 RDMs constructed from separate trials and thus the stimulus-driven effects. The results are shown separately for each subject (in different rows) and the error-bars indicate SEMs across the 25 experimental runs. B) Separate-trial RDM comparisons. The red bars (GWP model comparison) and black lines (V1 RDM replicability results) are the same as in (A), note the different y-axis. The dark gray bars show the mean rank-correlation between the V1 and V2 RDMs constructed from separate trials. The light gray bars show the mean rank-correlation between V1 RDMs of different subjects constructed from trials with different temporal sequence. C) Effects of mean-response and temporal distance on RDMs. The blue bars show the mean rank-correlation between the V1-RDM and mean-response RDM. In this simple model of the coherent response-pattern-fluctuations, each cell in the RDM contains the absolute difference between the response-pattern-means divided by the sum of the absolute values of the response-pattern-means between a pair of stimuli. The green bars show the mean rank-correlation between the V1-RDM and the temporal distance RDM, in which each cell contains the temporal distance between the presentations of a pair of stimuli. The black lines (V1 RDM replicability results) are the same as in (A–B), note the different y-axis.
Fig. 8
Fig. 8
Searchlight analysis of the response-pattern fluctuations and RDM correlations across the visual cortex. A) The trial-to-trial response-pattern-mean signals from the right LO (subject S1) were correlated with trial-to-trial response-pattern-mean signals within a spherical searchlight at each location. The expected false-discovery rate maps show the significance of the correlations as evaluated from the 25 experimental runs and FDR corrected for multiple comparisons. The upper row shows the results for same-trial pattern mean correlations and the bottom row for separate-trial pattern-mean correlations. Note the widespread response-pattern fluctuations in the same-trial responses across the visual cortex, and especially between the corresponding regions in the two hemispheres. B) The RDM of the right LO was correlated with RDMs within a spherical searchlight at each location. The upper row shows the results for same-trial RDM correlations and the bottom row for separate-trial RDM correlations. When the reference-RDM was constructed from separate trials (bottom row), the searchlight analysis identified similar representations only in corresponding regions in the two hemispheres. Note the similarity of the same-trial RDM and same-trial response-pattern fluctuations across the visual cortex (upper rows A–B), likely reflecting the contribution from intrinsic cortical dynamics.
Fig. 9
Fig. 9
Trial-to-trial variability in response-patterns: more dissimilar response-patterns for trials more separated in time. A) A V1 RDM of subject S1 is shown for the first experimental run, where the two trials for each of the 70 stimuli were treated as separate conditions. The ordering of the condition labels in the RDM follows the original stimulus image numbering (1…70) with the second presentations of the same image set following the first presentation. B) The RDM shown in (A) is reordered to follow the temporal sequence of the presentation order of the 140 natural image stimuli. C) The reordered RDMs (as in B) were averaged across experimental runs. In each run, the stimuli were different, but the temporal sequence of the presentation order was the same (see Supplementary Fig. 1 for other visual areas and subjects). The two black rectangles represent the two zoom-in regions. D) The reference RDM predicts identical response patterns for the repeated presentation of the same stimuli and different response patterns for other stimulus comparisons. The two black rectangles represent the two zoom-in regions. The arrows in the zoom-in regions point to one of the repeated presentations of the same stimulus (similar response patterns).
Fig. 10
Fig. 10
Trial averaging weakens non-stimulus-related effects and strengthens stimulus-related effects. Results on the representational similarity of V1 to other visual areas are shown for different numbers of trials averaged for the RDMs. Results for the three subjects are shown separately (three rows). The first column compares the V1 to other visual areas when the RDMs were constructed from the same trials (sharing intrinsic cortical dynamics). The x-axis shows the number of trials averaged for the RDMs. The second column compares the V1 to other visual areas when the RDMs were constructed from separate trials (only stimulus-driven effects shared among visual areas). Note the opposite effects of the trial averaging on the results shown in the first (same-trial) and second (separate-trial) columns. The third column compares the V1 representation in one subject to the representations in the other subjects (a different temporal sequence for stimulus presentation; only stimulus driven effects shared). The last column compares the V1 representation to the representational similarity predicted by the GWP model.

References

    1. Arieli A., Sterkin A., Grinvald A., Aertsen A. Dynamics of ongoing activity: explanation of the large variability in evoked cortical responses. Science. 1996;273:1868–1871. - PubMed
    1. Becker R., Reinacher M., Freyer F., Villringer A., Ritter P. How ongoing neuronal oscillations account for evoked fMRI variability. J. Neurosci. 2011;31:11016–11027. - PMC - PubMed
    1. Benucci A., Saleem A.B., Carandini M. Adaptation maintains population homeostasis in primary visual cortex. Nat. Neurosci. 2013;16:724–729. - PMC - PubMed
    1. Carandini M., Demb J.B., Mante V., Tolhurst D.J., Dan Y., Olshausen B.A., Gallant J.L., Rust N.C. Do we know what the early visual system does? J. Neurosci. 2005;25:10577–10597. - PMC - PubMed
    1. Cavanaugh J.R., Bair W., Movshon J.A. Nature and interaction of signals from the receptive field center and surround in macaque V1 neurons. J. Neurophysiol. 2002;88:2530–2546. - PubMed

Publication types

MeSH terms