. 2015 May 19;43(9):4614-26.
doi: 10.1093/nar/gkv361. Epub 2015 Apr 20.

BLM unfolds G-quadruplexes in different structural environments through different mechanisms

Affiliations

BLM unfolds G-quadruplexes in different structural environments through different mechanisms

Wen-Qiang Wu et al. Nucleic Acids Res. .

Abstract

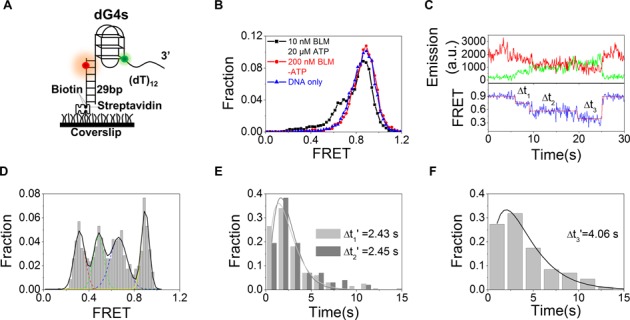
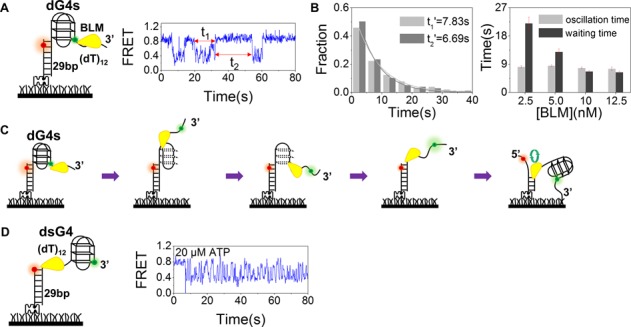
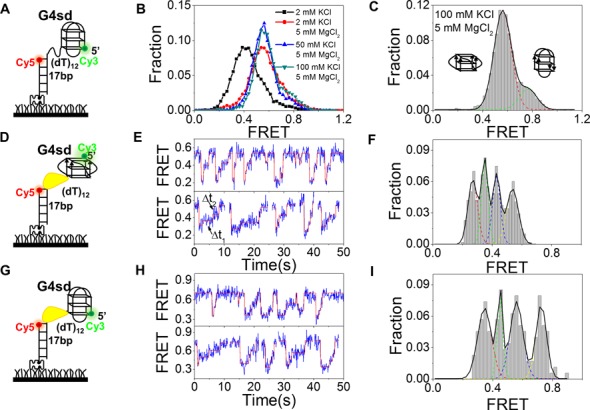
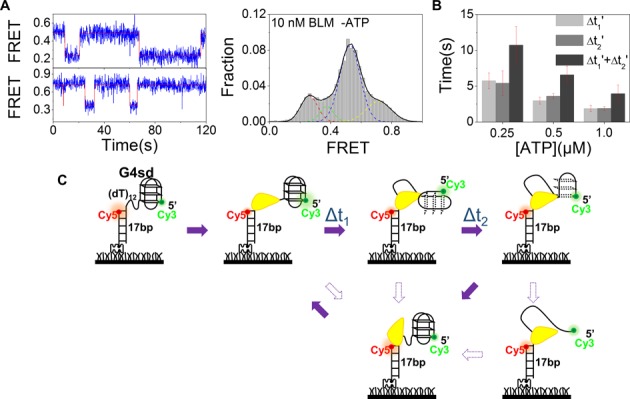
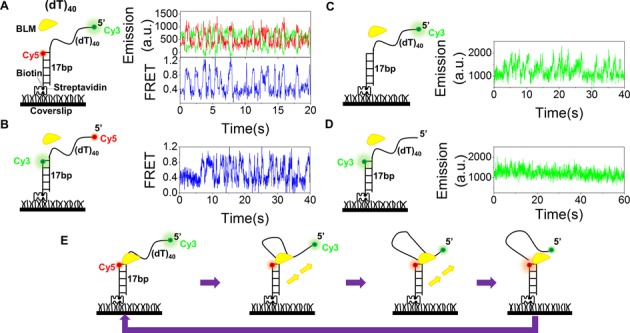
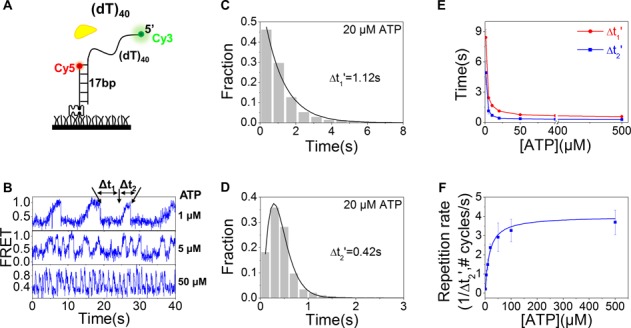
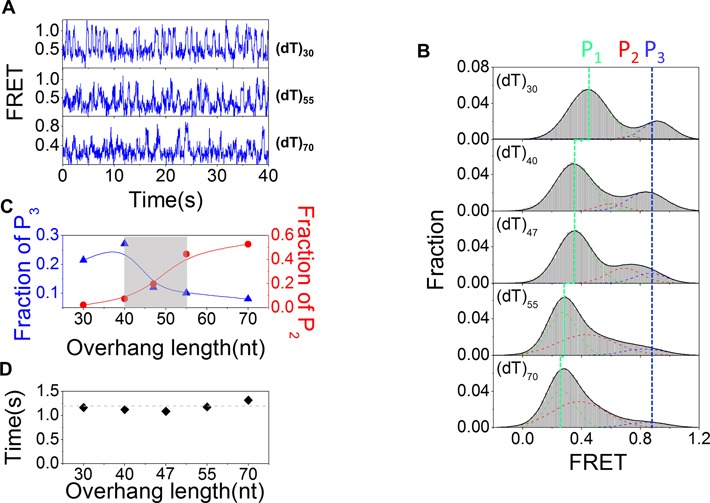
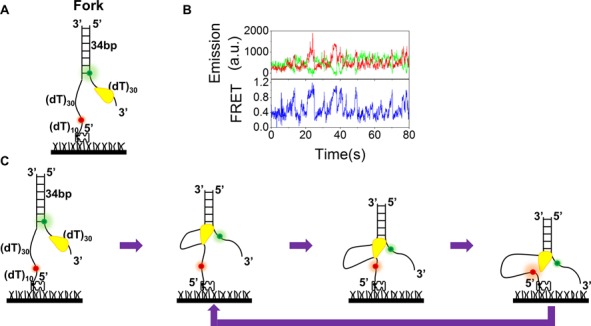
Mutations in the RecQ DNA helicase gene BLM give rise to Bloom's syndrome, which is a rare autosomal recessive disorder characterized by genetic instability and cancer predisposition. BLM helicase is highly active in binding and unwinding G-quadruplexes (G4s), which are physiological targets for BLM, as revealed by genome-wide characterizations of gene expression of cells from BS patients. With smFRET assays, we studied the molecular mechanism of BLM-catalyzed G4 unfolding and showed that ATP is required for G4 unfolding. Surprisingly, depending on the molecular environments of G4, BLM unfolds G4 through different mechanisms: unfolding G4 harboring a 3'-ssDNA tail in three discrete steps with unidirectional translocation, and unfolding G4 connected to dsDNA by ssDNA in a repetitive manner in which BLM remains anchored at the ss/dsDNA junction, and G4 was unfolded by reeling in ssDNA. This indicates that one BLM molecule may unfold G4s in different molecular environments through different mechanisms.


Figures

Figure 1.
Figure 1.
BLM-catalyzed G4 unfolding is ATP dependent and has three discrete steps. (A) Schematic diagram of Cy3 (green)- and Cy5 (red)-labeled DNA construct (dG4s) with G4 having three G-quartet planes. The G4 strand and the complementary stem strand are annealed to form a duplex stem. Biotin is used to immobilize the DNA to a streptavidin-coated coverslip surface. (B) FRET histograms for dG4s alone, in the presence of 200 nM BLM and of 10 nM BLM with 20 μM ATP. (C) Representative time traces of fluorescence emission intensities of Cy3 and Cy5 (upper panel) and FRET trace (lower panel) with 10 nM BLM and 1 μM ATP. Individual steps were determined by an automated step-finding algorithm (red). Δt1−3 denotes the dwell times for the three FRET states. (D) Distribution of the average EFRET collected from ∼100 molecules. Multi-peak Gaussian fitting gives four peaks at 0.90, 0.66, 0.48 and 0.32, respectively. (E,F) Histograms of dwell times for the unfolding steps. The lines are γ-distribution fitting according to equation: Fraction = (Δt)N−1exp(−kΔt), with k being the rate of stepping and N the number of steps. Then N/k is calculated as the time constant or average dwell time (Δt1−3′) as given in the figures.
Figure 2.
Figure 2.
BLM unfolds dG4s at 20 μM ATP. (A) A representative FRET time trace showing G4 unfolding by 10 nM BLM with 20 μM ATP. After rapid G4 unfolding, the FRET signal oscillates between 0.3 and 0.7 with a time duration of t1 then returns back to the original value after a waiting time of t2. (B) Histograms of the oscillation time t1 and waiting time t2 in the case of 10 nM BLM with the time constants t1′ and t2′ being obtained from single-exponential fittings (left panel), and the dependences of t1′ and t2′on BLM concentration (right panel). (C) A schematic representation of our proposed model showing that after G4 unfolding, BLM switches strands and unwinds the DNA duplex repetitively. (D) When G4 is separated from the duplex DNA by a 12-nt ssDNA linker, repetitive fluctuations remain, indicating that BLM directly binds to ssDNA and then unwinds the duplex region repetitively.
Figure 3.
Figure 3.
BLM unfolds G4sd. (A) Schematic diagram of the Cy3- and Cy5-labeled DNA construct G4sd where the G4 motif and 17-bp dsDNA are separated by a 12-nt ssDNA. (B) FRET histograms of the G4sd structure at different concentrations of KCl and MgCl2. (C) FRET histogram of G4sd in 100 mM KCl and 5 mM MgCl2. The histogram can be well fitted with two Gaussian peaks at 0.76 and 0.56, indicating the coexistence of the anti-parallel and parallel G4 structures in the solution. (D,E) Schematic diagram of G4sd with parallel G4 structure (left panel) and representative FRET time traces with 10 nM BLM and 1 μM ATP. The automated step-finding algorithm was used to identify the individual steps (red line) during G4 unfolding and refolding. (F) FRET distribution collected from ∼100 molecules. Multi-peak Gaussian fitting gives four peaks at 0.54, 0.43, 0.35 and 0.27, respectively. (G,H) Schematic diagram of G4sd with anti-parallel G4 structure (left panel) and representative FRET time traces with 10 nM BLM with 1 μM ATP. (I) FRET distribution collected from ∼100 molecules. Multi-peak Gaussian fitting gives four peaks at 0.73, 0.56, 0.45 and 0.35, respectively.
Figure 4.
Figure 4.
Abrupt decrease of FRET signal and its recovery in a stepwise manner are related to BLM binding and G4 unfolding. (A) FRET traces (left panel) of G4sd in parallel (upper) and anti-parallel (lower) conformations recorded in the presence of 10 nM BLM alone. The FRET histogram (right panel) from over 300 molecules confirms that the BLM binding alone is able to induce FRET decrease from 0.53 to 0.26 for parallel G4 and from 0.71 to 0.37 for anti-parallel G4. (B) The determined average dwell times from G4sd unfolding (Figure 3E) as a function of ATP concentration. Error bars represent the standard deviation (s.d.) from three or more experiments. (C) Schematic diagram of our proposed model to explain how BLM unfolds G4sd repetitively. More details are described in the text.
Figure 5.
Figure 5.
BLM reels in ssDNA periodically. (A,B) Single-molecule fluorescence emission and FRET traces show repetitive translocation of BLM on (dT)40 with different labeling positions of Cy3 and Cy5. Experiments were performed under the same experimental conditions (10 nM BLM, 20 μM ATP and 50 pM DNA). (C,D) Emissions were recorded with 10 nM BLM and 50 pM 40-nt partial duplex DNA labeled with Cy3 at the 5′ end (C) and at the ss/dsDNA junction (D). Emission traces show repetitive enhancement of Cy3 emission by BLM only when Cy3 is labeled at the 5′ end. (E) Schematic diagram of a proposed model for the repetitive ssDNA looping.
Figure 6.
Figure 6.
Properties of BLM-mediated ssDNA looping. (A,B) FRET time traces of 40-nt partial duplex DNA were recorded with 10 nM BLM and different concentrations of ATP. The waiting time Δt1 and translocation time Δt2 are used to characterize the two phases. (C,D) At 20 μM ATP, the histogram of Δt1 follows an exponential decay with a time constant of 1.12 s, while that of Δt2 can be well fitted by a γ-distribution with a time constant of 0.42 s. (E) With increasing ATP concentration, both Δt1′ and Δt2′ decrease significantly. (F) Michaelis–Menten fit of 1/Δt2′ as a function of ATP concentration. Error bars denote s.d.
Figure 7.
Figure 7.
BLM displays a low translocation processivity. (A) FRET time traces showing repetitive looping of ssDNA of different lengths in the presence of 10 nM BLM and 20 μM ATP. (B) FRET histograms for different lengths of ssDNA undergoing periodical looping. Approximately 100 traces were used in each case. Each histogram can be fitted by a 3-peak Gaussian distribution. The low-FRET peak (P1) corresponds to free ssDNA without looping. The high-FRET peak (P3) corresponds to that when the 5′ end of ssDNA was close to the ss/dsDNA junction. The middle peak (P2) should correspond to the position where the transported ssDNA was released due to the limited processivity of BLM. (C) The relative populations of P2 and P3 as a function of the ssDNA length. (D) The average waiting time Δt1′ as a function of ssDNA length.
Figure 8.
Figure 8.
The observed BLM-catalyzed repetitive unwinding of a forked DNA may be interpreted by a novel model. (A) A forked DNA contains 34 bp dsDNA with a 30-nt 3′ ssDNA tail labeled with Cy3 at the ss/ds junction. The opposite ssDNA was labeled with Cy5 at a position 30 nt away from the ss/dsDNA junction. (B) Representative single-molecule time traces of Cy3 (green) and Cy5 (red) emissions (upper panel) and the corresponding FRET time trace (lower panel) in the presence of 10 nM BLM and 5 μM ATP. (C) Proposed ssDNA looping model for repetitive FRET oscillation; see the text for more details.

Similar articles

Cited by

References

    1. Lohman T.M., Bjornson K.P. Mechanisms of helicase-catalyzed DNA unwinding. Annu. Rev. Biochem. 1996;65:169–214. - PubMed
    1. Croteau D.L., Popuri V., Opresko P.L., Bohr V.A. Human RecQ helicases in DNA repair, recombination, and replication. Annu. Rev. Biochem. 2014;83:519–552. - PMC - PubMed
    1. Cheok C., Bachrati C., Chan K., Ralf C., Wu L., Hickson I. Roles of the Bloom's syndrome helicase in the maintenance of genome stability. Biochem. Soc. Trans. 2005;33:1456–1459. - PubMed
    1. Goto M. Werner's syndrome: from clinics to genetics. Clin. Exp. Rheumatol. 2000;18:760–766. - PubMed
    1. Lindor N.M., Furuichi Y., Kitao S., Shimamoto A., Arndt C., Jalal S. Rothmund-Thomson syndrome due to RECQ4 helicase mutations: report and clinical and molecular comparisons with Bloom syndrome and Werner syndrome. Am. J. Med. Genet. 2000;90:223–228. - PubMed

Publication types

MeSH terms

LinkOut - more resources