. 2015 May 4;212(5):793-807.
doi: 10.1084/jem.20141849. Epub 2015 Apr 20.

The transcription factor lymphoid enhancer factor 1 controls invariant natural killer T cell expansion and Th2-type effector differentiation

Affiliations

The transcription factor lymphoid enhancer factor 1 controls invariant natural killer T cell expansion and Th2-type effector differentiation

Tiffany Carr et al. J Exp Med. .

Abstract

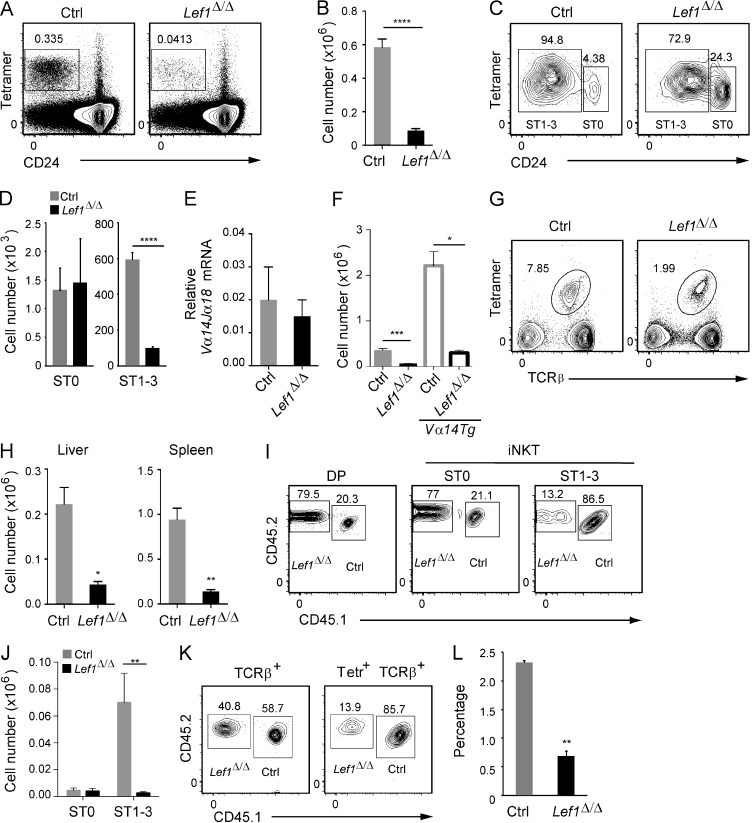
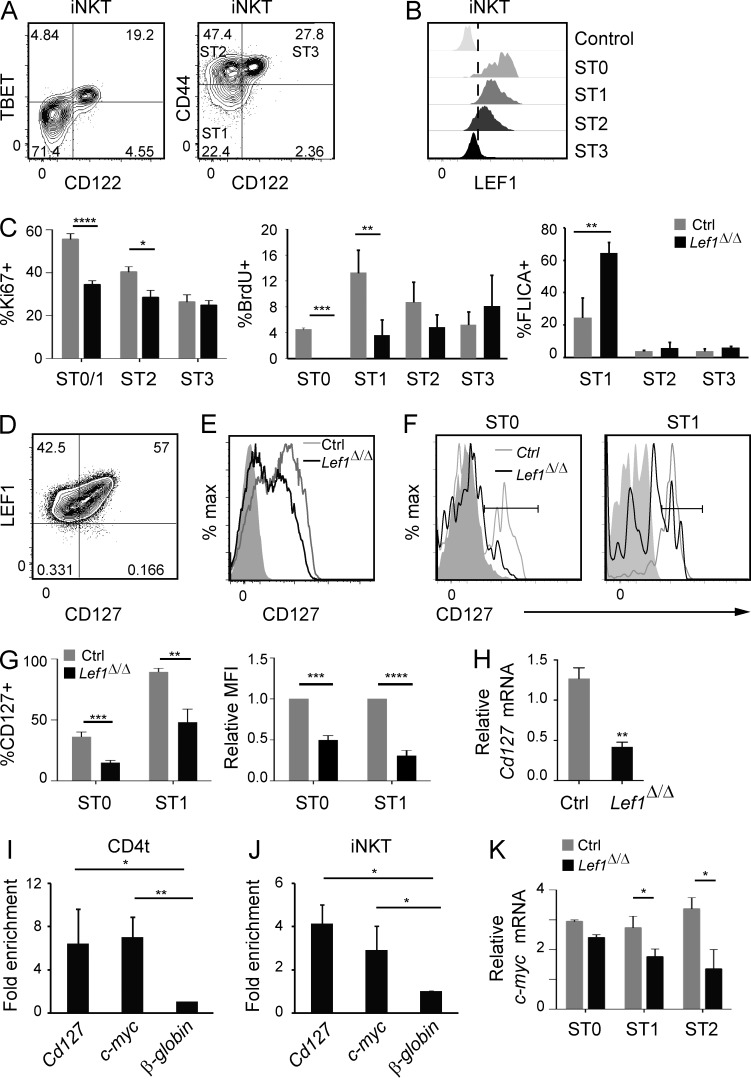
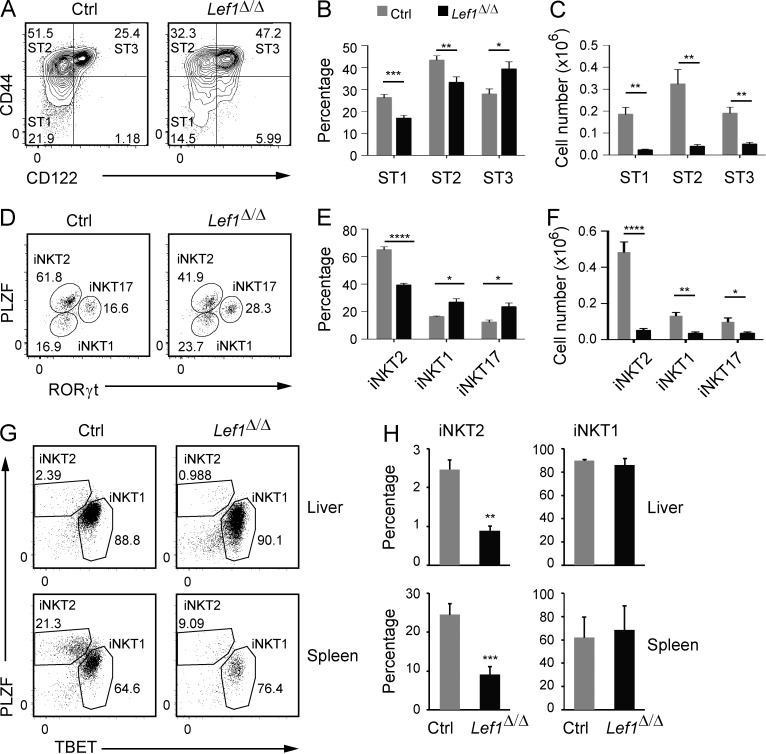
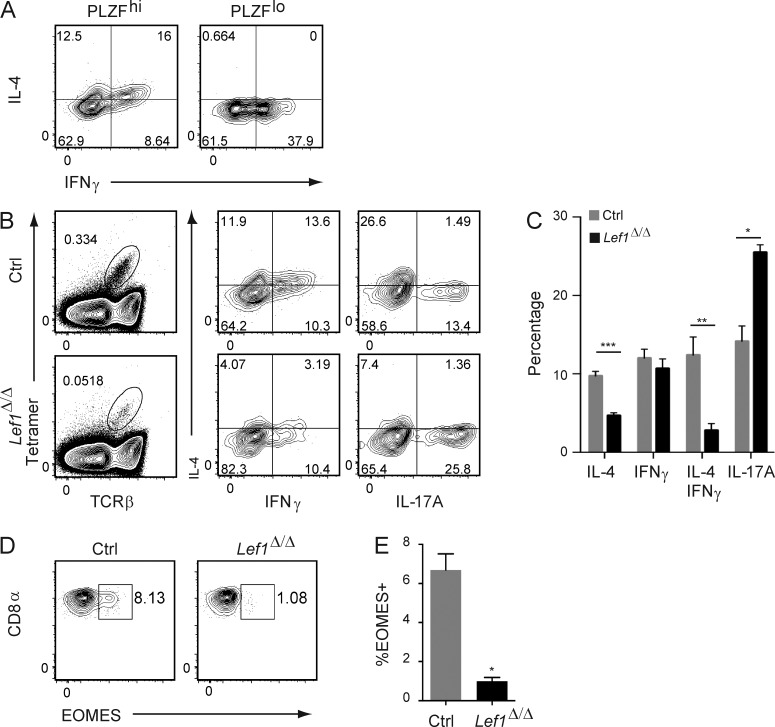
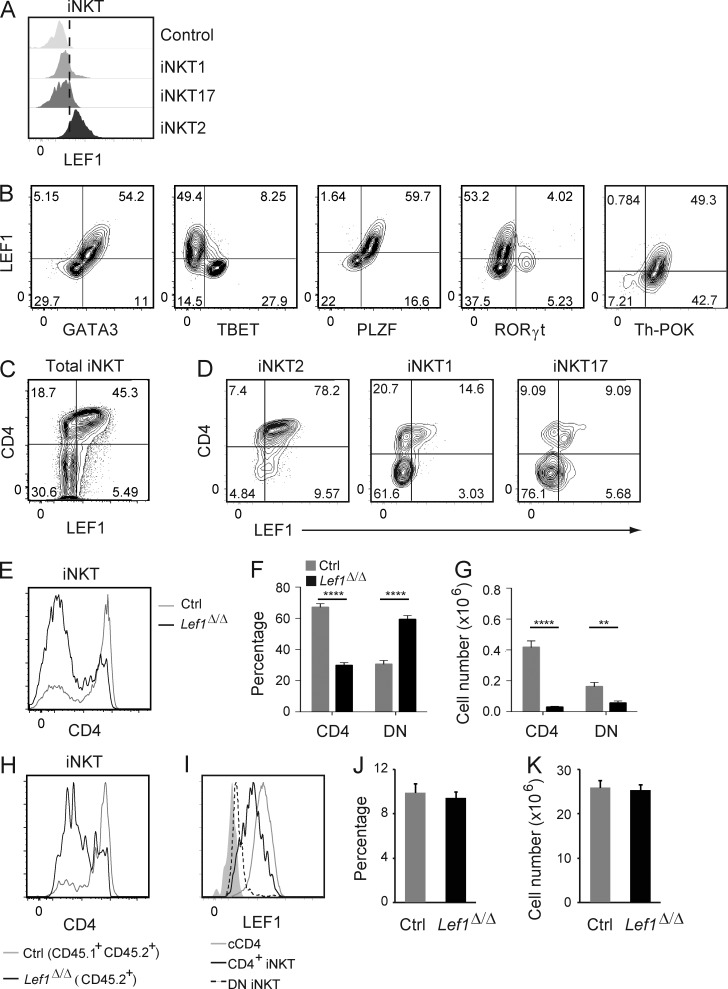
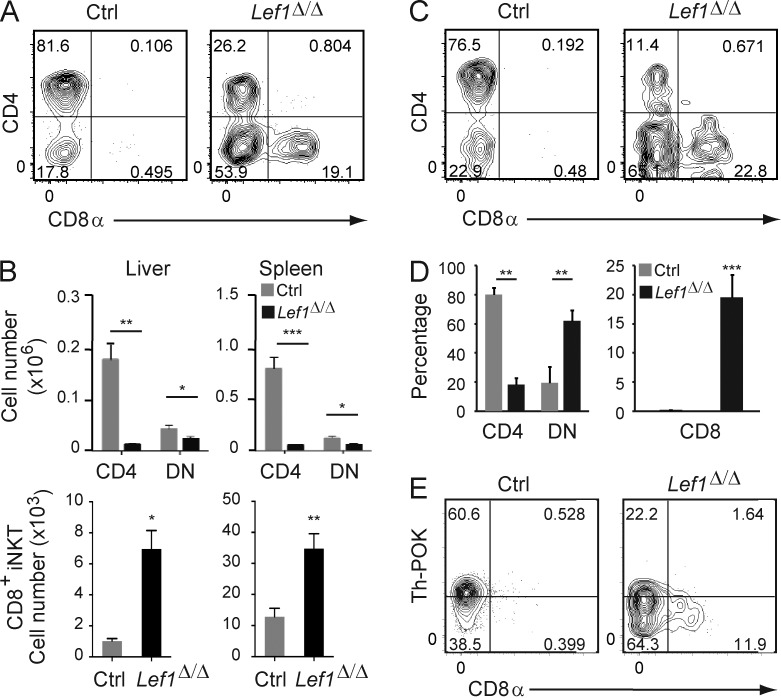
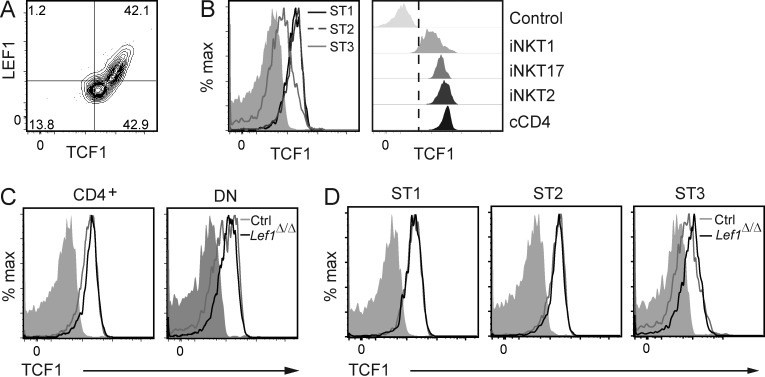
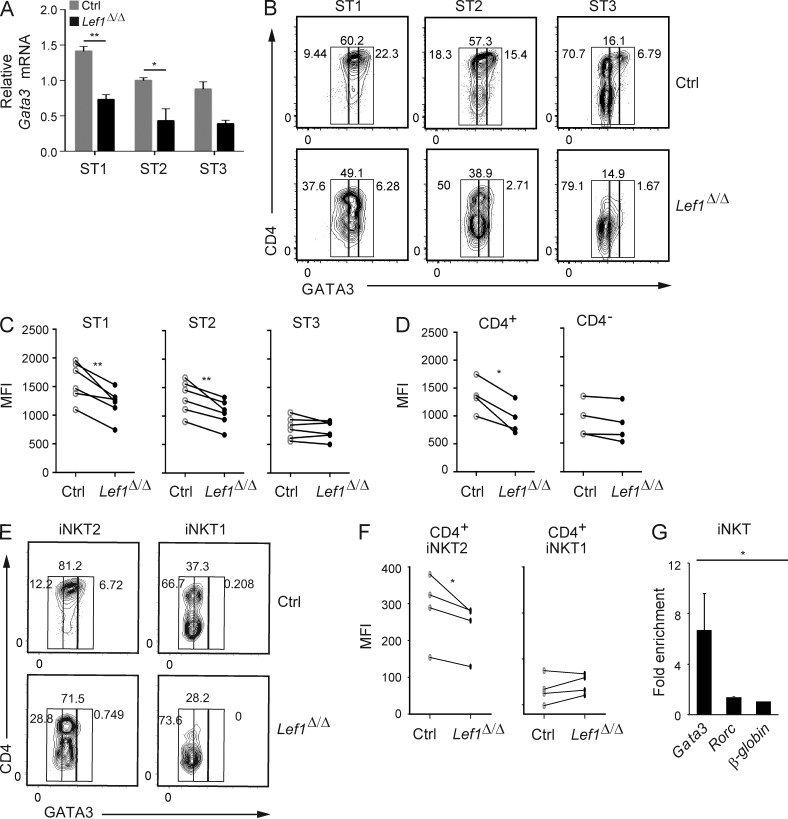
Invariant natural killer T cells (iNKT cells) are innate-like T cells that rapidly produce cytokines that impact antimicrobial immune responses, asthma, and autoimmunity. These cells acquire multiple effector fates during their thymic development that parallel those of CD4(+) T helper cells. The number of Th2-type effector iNKT cells is variable in different strains of mice, and their number impacts CD8 T, dendritic, and B cell function. Here we demonstrate a unique function for the transcription factor lymphoid enhancer factor 1 (LEF1) in the postselection expansion of iNKT cells through a direct induction of the CD127 component of the receptor for interleukin-7 (IL-7) and the transcription factor c-myc. LEF1 also directly augments expression of the effector fate-specifying transcription factor GATA3, thus promoting the development of Th2-like effector iNKT cells that produce IL-4, including those that also produce interferon-γ. Our data reveal LEF1 as a central regulator of iNKT cell number and Th2-type effector differentiation.


Figures

Figure 1.
Figure 1.
Lef1Δ/Δ mice lacked iNKT cells in the thymus and the periphery. (A) Thymi from control (Ctrl) and Lef1Δ/Δ mice were stained for CD24 and CD1d-PBS57 tetramers (Tetr) and analyzed by flow cytometry. The percentage of total thymocytes that were Tetramer+CD24lo iNKT cells is shown. (B) Mean number of thymic Tetr+CD24lo iNKT cells in control and Lef1Δ/Δ mice. Bars represent the mean from 10 independent experiments, with one pair of mice each. (C) The frequency of Tetr+CD24hi (ST0) and Tetr+CD24lo/− (ST1–3) among total thymic iNKT cells was determined by flow cytometry after MACS-based tetramer enrichment. (D) Absolute number of ST0 and ST1–3 iNKT cells from control and Lef1Δ/Δ mice. Data represent the mean from six independent experiments with one to two mice per genotype. (E) Expression of Vα14Jα18 mRNA transcripts relative to Hprt in sorted DP thymocytes from control and Lef1Δ/Δ mice was determined by qRT-PCR. Data represent the mean from four independent experiments. (F) Mean number of thymic Tetr+CD24lo iNKT cells in the indicated mouse strains from five independent experiments. (G) TCRβ and CD1d-PBS57 tetramer staining on liver cells from control and Lef1Δ/Δ mice was determined by flow cytometry. Numbers indicate the percentage of liver lymphocytes that are Tetr+TCRβ+. (H) Mean number of Tetr+TCRβ+ iNKT cells in the liver and spleen of control and Lef1Δ/Δ mice. Bars represent the mean from four independent experiments. (I) CD45.1+CD45.2+ control and CD45.1CD45.2+ Lef1Δ/Δ FACS-sorted LK bone marrow cells were mixed at a 1:1 ratio, and 5 × 10⁴ total cells were transferred into lethally irradiated CD45.1+ C57BL/6 mice. Mice were analyzed 6–8 wk after transplantation. Expression of CD45.1 and CD45.2 on DP thymocytes, ST0 iNKT cells, or ST1–3 iNKT cells from competitive bone marrow chimeras was determined by flow cytometry. The percentage of DP cells or CD24hi ST0 and CD24lo ST1–3 iNKT cells derived from CD45.1+CD45.2+ control or CD45.1CD45.2+ Lef1Δ/Δ bone marrow cells is shown. Data are representative of three independent experiments with two to three chimeras each. (J) The mean number of ST0 CD24hi and ST1–3 CD24lo thymic iNKT cells derived from the CD45.1+CD45.2+ control or CD45.1CD45.2+ Lef1Δ/Δ bone marrow cells is shown. (K) Expression of CD45.1 and CD45.2 on TCRβ+ (Tetr) cells and Tetr+TCRβ+ iNKT cells in the liver of competitive mixed bone marrow chimeras was determined by flow cytometry. The gated regions show the percentage of cells that are derived from the control or Lef1Δ/Δ bone marrow. (L) Mean percentage of iNKT cells in the competitive chimeric mice that are derived from the control or Lef1Δ/Δ bone marrow. Numbers are the mean from three independent experiments with two to three chimeras each. All error bars represent SEM. *, P < 0.05; **, P < 0.01; ***, P < 0.001; ****, P < 0.0001.
Figure 2.
Figure 2.
LEF1 promoted iNKT cell proliferation and regulated expression of the Cd127 and c-myc genes. (A) Expression of TBET (left) or CD44 (right) and CD122 on WT FVB/NJ Tetr+CD24lo thymic iNKT cells was determined by flow cytometry. The percentage of cells and iNKT cell stage in each quadrant is shown. (B) Expression of LEF1 was determined by flow cytometry in the indicated iNKT cell stages from WT FVB/NJ mice and is shown as a histogram. iNKT cell stages were gated as shown in A (ST1, ST2, and ST3) and in Fig. 1 C (ST0). The control sample was LEF1 staining in Lef1Δ/Δ iNKT cells. Plots are representative of at least 10 independent experiments with one to two mice per genotype. (C) Percentage of the indicated iNKT cell stage staining positive for Ki67, BrdU, or FLICA in the thymus of control and Lef1Δ/Δ mice. Graphs represent the mean of four independent experiments. (D) Expression of LEF1 and CD127 in CD4t (gated as CD4hiCD8loTCRβ+CD69+) WT FVB/NJ thymocytes was determined by flow cytometry. (E and F) CD127 expression in CD4t thymocytes (E) or ST0 and ST1 (F) iNKT cells from control and Lef1Δ/Δ mice was determined by flow cytometry. Data are representative of four to eight independent experiments with one to two mice per genotype. Solid gray histograms show staining with the isotype control antibody. (G) The mean percentage of CD127+ cells (left) or the MFI of CD127 (right) within ST0 and ST1 iNKT cells in control and Lef1Δ/Δ mice. Numbers were averaged from six independent experiments with one mouse per genotype. (H) Expression of Cd127 mRNA relative to Hprt from sorted ST0 iNKT cells (Tetr+TCRβ+CD24hi) was determined by qRT-PCR. The bar graphs represent the mean from three independent experiments. (I and J) LEF1 chromatin binding was determined by α-LEF1 ChIP on sorted CD4t thymocytes (I) or ST1/2 Vα14Tg thymic iNKT cells (J; Tetr+TCRβ+CD24loCD122), followed by qPCR using primers spanning a TCF1/LEF1 binding site at the Cd127 and c-myc promoter region or an unrelated sequence at the β-globin gene locus. Numbers indicate mean fold enrichment of the immunoprecipitated DNA relative to the β-globin locus from three independent experiments. (K) Expression of c-myc mRNA relative to Hprt mRNA from sorted ST0, ST1, and ST2 iNKT cells was determined by qRT-PCR. Bar graphs represent the mean of three independent experiments. All error bars represent SEM. *, P < 0.05; **, P < 0.01; ***, P < 0.001; ****, P < 0.0001.
Figure 3.
Figure 3.
LEF1 was required for iNKT2 development. (A) Expression of CD44 and CD122 on gated Tetr+CD24lo iNKT cells from the thymus of control and Lef1Δ/Δ mice was determined by flow cytometry. (B and C) The mean percentage (B) and number (C) of ST1, ST2, and ST3 cells among total iNKT cells in control and Lef1Δ/Δ mice. Data are the mean from eight independent experiments with one mouse per genotype. (D) PLZF versus RORγt expression in Tetr+CD24lo iNKT cells from control and Lef1Δ/Δ mice was used to resolve the iNKT1 (PLZFloRORγt), iNKT2 (PLZFhiRORγt), and iNKT17 (PLZFintRORγt+) effector subsets by flow cytometry. Numbers show the percentage of each population among total iNKT cells. (E and F) The mean percentage (E) and number (F) of iNKT1, iNKT2, and iNKT17 cells in the thymus of control and Lef1Δ/Δ mice. Data are the mean from five independent experiments. (G) Expression of PLZF and TBET was used to identify iNKT1 and iNKT2 cells in the liver and spleen of control and Lef1Δ/Δ mice by flow cytometry. (H) The mean percentage of iNKT2 and iNKT1 among total iNKT cells in the liver and spleen from control and Lef1Δ/Δ mice. Numbers were averaged from three independent experiments. All error bars represent SEM. *, P < 0.05; **, P < 0.01; ***, P < 0.001; ****, P < 0.0001.
Figure 4.
Figure 4.
LEF1 promoted development of iNKT cells that produce IL-4 or IL-4 plus IFNγ. (A) Expression of IL-4 and IFNγ in PLZFhi and PLZFlo iNKT cells was determined by flow cytometry, after a 4-h in vitro stimulation of thymocytes with PMA and ionomycin. (B) Expression of IL-4, IFNγ, or IL-17A in thymic Tetr+TCRβ+ iNKT cells from control and Lef1Δ/Δ mice after a 4-h in vitro stimulation of thymocytes with PMA and ionomycin. Plots are representative of four to six independent experiments. (C) The mean percentage of control and Lef1Δ/Δ iNKT cells that expressed IL-4, IFNγ, IL-4 plus IFNγ, or IL-17A. Data were averaged from six independent experiments. (D) Expression of CD8α and EOMES in TCRβ+CD8α+ thymocytes was determined by flow cytometry. (E) The mean percentage of EOMES+ cells among TCRβ+CD8α+ thymocytes from four independent experiments. All error bars represent SEM. *, P < 0.05; **, P < 0.01; ***, P < 0.001.
Figure 5.
Figure 5.
LEF1 expression correlated with CD4, GATA3, PLZF, and Th-POK and supported development of CD4+ iNKT cells. (A) Expression of LEF1 in the indicated iNKT effector cells from WT FVB/NJ mice was determined by flow cytometry and is shown as a histogram. The control sample was LEF1 staining in Lef1Δ/Δ iNKT cells. Plots are representative of at least four independent experiments with one to two mice per genotype. (B) Expression of LEF1 and GATA3, TBET, PLZF, RORγt, or Th-POK in WT FVB/NJ thymic iNKT cells was determined by flow cytometry. The percentage of cells in each quadrant is indicated. Plots are representative of at least six independent experiments with one to two mice per genotype. (C and D) Expression of LEF1 and CD4 in total iNKT cells (C) or iNKT2 (PLZFhiTBET), iNKT1 (PLZFloTBET+) and iNKT17 (RORγt+TBET; D) cells from the thymus of WT FVB/NJ mice was determined by flow cytometry. Results are representative of at least four independent experiments. (E) CD4 expression on total thymic iNKT cells from control and Lef1Δ/Δ mice was determined by flow cytometry and is shown as histograms. (F and G) The mean percentage (F) and number (G) of CD4+ and CD4CD8 (DN) thymic iNKT cells in the indicated mouse strains. Data were averaged from >10 independent experiments. (H) CD45.1+CD45.2+ control and CD45.1CD45.2+ Lef1Δ/Δ FACS-sorted LK bone marrow cells were mixed at 1:1 ratio and transferred into lethally irradiated CD45.1+ C57BL/6 mice. 6–8 wk later, reconstituted mice were analyzed by flow cytometry for CD4 expression on control (CD45.1+CD45.2+) and Lef1Δ/Δ (CD45.2+) thymic iNKT cells. (I) LEF1 expression in cCD4+ thymocytes (cCD4), thymic CD4+ iNKT, and thymic DN iNKT cells was determined by flow cytometry. Solid gray histogram was LEF1 staining in LEF1-deficient iNKT cells. Histograms are representative of at least 10 independent experiments with one to two mice per genotype. (J and K) The percentage (J) and number (K) of cCD4 cells in the thymus of control or Lef1Δ/Δ mice. Graphs show the mean from 10 independent experiments. Error bars represent SEM. **, P < 0.01; ****, P < 0.0001.
Figure 6.
Figure 6.
LEF1 prevented CD8α expression on peripheral iNKT cells. (A) CD4 and CD8 expression on Tetr+TCRβ+ iNKT cells from the liver of control or Lef1Δ/Δ mice was determined by flow cytometry. (B) The mean number of CD4+, DN, and CD8+ iNKT cells from the indicated tissues in control and Lef1Δ/Δ mice. Data were averaged from at least six independent experiments. (C) CD45.1+CD45.2+ control and CD45.1CD45.2+ Lef1Δ/Δ FACS-sorted LK bone marrow cells were mixed at 1:1 ratio and transferred into lethally irradiated CD45.1+ C57BL/6 mice. 6–8 wk later, reconstituted mice were analyzed by flow cytometry for CD4 and CD8 expression on control or Lef1Δ/Δ iNKT cells from the liver. (D) The mean percentage of the CD4+, DN, and CD8+ liver iNKT cells from competitive BM chimeras. Data are representative of three independent experiments with two to three chimeras each. (E) Th-POK and CD8α expression in splenic iNKT cells from the indicated mice, as determined by flow cytometry. Data are representative of five independent experiments with one to two mice per genotype. All error bars represent SEM. *, P < 0.05; **, P < 0.01; ***, P < 0.001.
Figure 7.
Figure 7.
TCF1 expression was not affected by deletion of Lef1 in iNKT cells. (A) Expression of LEF1 and TCF1 in total WT FVB/NJ iNKT cells, as determined by flow cytometry. (B) TCF1 expression in the indicated iNKT stages (left) or iNKT subsets (right) from WT FVB/NJ thymocytes was determined by flow cytometry and is shown as histograms. Solid gray or control represents anti-TCF1 staining in TCF1-deficient iNKT cells and serves as a negative control. (C and D) TCF1 expression in CD4+ and DN (C) or ST1, ST2, and ST3 (D) thymic iNKT cells from control and Lef1Δ/Δ mice was determined by flow cytometry. Data are representative of four independent experiments.
Figure 8.
Figure 8.
LEF1 was required for proper expression of GATA3 in CD4+ iNKT cells. (A) Expression of Gata3 mRNA relative to Hprt in sorted ST1, ST2, and ST3 iNKT cells from control and Lef1Δ/Δ mice was determined by qRT-PCR. Data were combined from three independent experiments. (B) GATA3 versus CD4 expression in ST1, ST2, and ST3 thymic iNKT cells from control and Lef1Δ/Δ mice, as determined by flow cytometry. (C and D) MFI for GATA3 in ST1, ST2, and ST3 iNKT cells (C) or in CD4+ and CD4 iNKT cells (D) from the thymus of control and Lef1Δ/Δ mice. (E) GATA3 versus CD4 expression in iNKT1 (PLZFloTBET+) and iNKT2 (PLZFhiTBET) cells from control and Lef1Δ/Δ mice, as determined by flow cytometry. Data are representative of four independent experiments. (F) MFI for GATA3 in thymic CD4+ iNKT2 and CD4+ iNKT1 cells from the indicated mouse strains. (C, D, and F) Each circle represents one mouse (paired Student’s t test: *, P < 0.05; **, P < 0.01). (G) LEF1 chromatin binding was determined by a-LEF1 ChIP on sorted thymic ST1/ST2 Vα14Tg iNKT cells, followed by qPCR using primers spanning a TCF1/LEF1-binding site upstream of the Gata3b promoter, the Rorc promoter, or an unrelated sequence at the β-globin gene locus. Numbers indicate mean fold enrichment of the immunoprecipitated DNA relative to the β-globin locus from three independent experiments is shown. Error bars represent SEM. *, P < 0.05; **, P < 0.01.

References

    1. Bedel R., Berry R., Mallevaey T., Matsuda J.L., Zhang J., Godfrey D.I., Rossjohn J., Kappler J.W., Marrack P., and Gapin L.. 2014. Effective functional maturation of invariant natural killer T cells is constrained by negative selection and T-cell antigen receptor affinity. Proc. Natl. Acad. Sci. USA. 111:E119–E128 10.1073/pnas.1320777110 - DOI - PMC - PubMed
    1. Benlagha K., Kyin T., Beavis A., Teyton L., and Bendelac A.. 2002. A thymic precursor to the NK T cell lineage. Science. 296:553–555 10.1126/science.1069017 - DOI - PubMed
    1. Benlagha K., Wei D.G., Veiga J., Teyton L., and Bendelac A.. 2005. Characterization of the early stages of thymic NKT cell development. J. Exp. Med. 202:485–492 10.1084/jem.20050456 - DOI - PMC - PubMed
    1. Brennan P.J., Brigl M., and Brenner M.B.. 2013. Invariant natural killer T cells: an innate activation scheme linked to diverse effector functions. Nat. Rev. Immunol. 13:101–117 10.1038/nri3369 - DOI - PubMed
    1. Chen Q.Y., Zhang T., Pincus S.H., Wu S., Ricks D., Liu D., Sun Z., Maclaren N., and Lan M.S.. 2010. Human CD1D gene expression is regulated by LEF-1 through distal promoter regulatory elements. J. Immunol. 184:5047–5054 10.4049/jimmunol.0901912 - DOI - PubMed

Publication types

MeSH terms