

CdTe quantum dots induce activation of human platelets: implications for nanoparticle hemocompatibility
- PMID: 25897218
- PMCID: PMC4396453
- DOI: 10.2147/IJN.S78281
CdTe quantum dots induce activation of human platelets: implications for nanoparticle hemocompatibility
Abstract
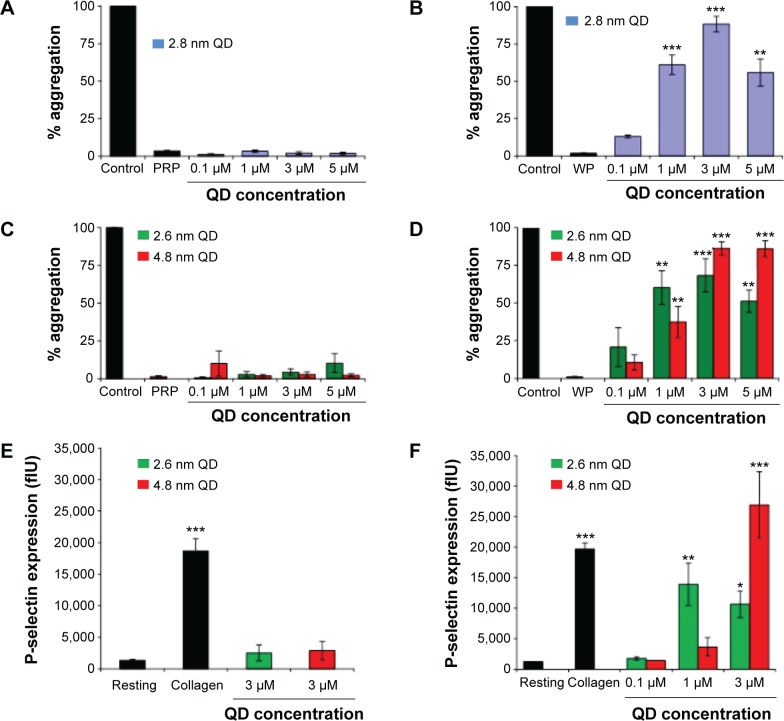
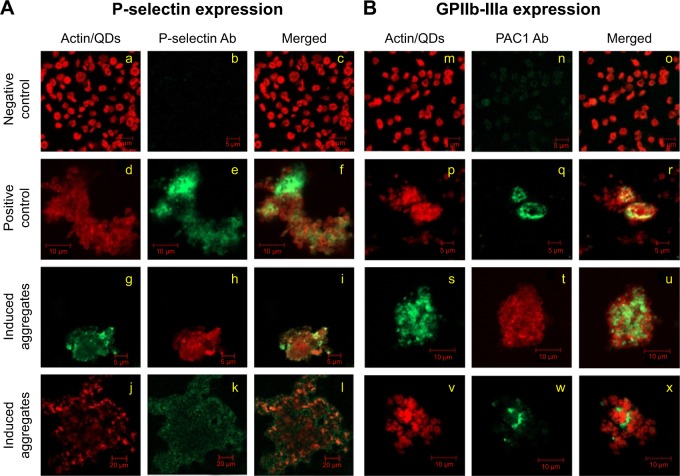
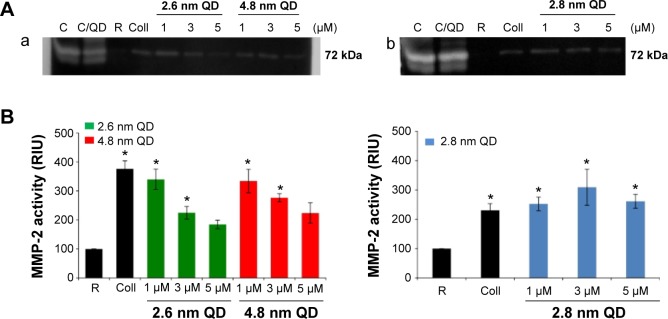
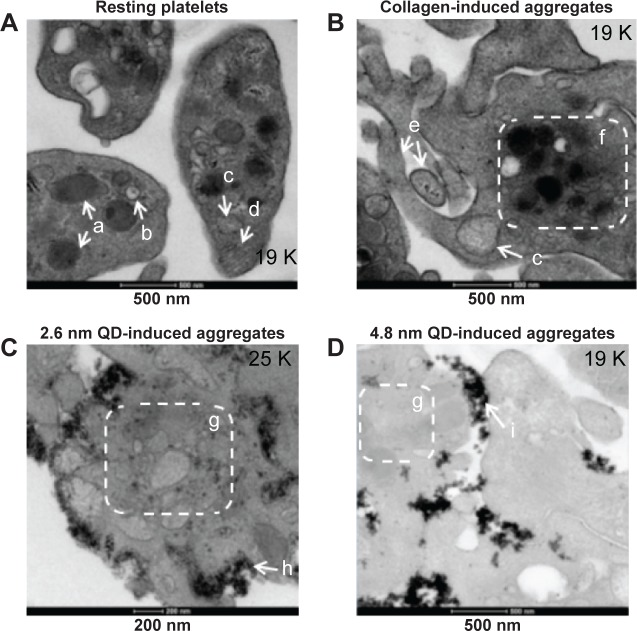
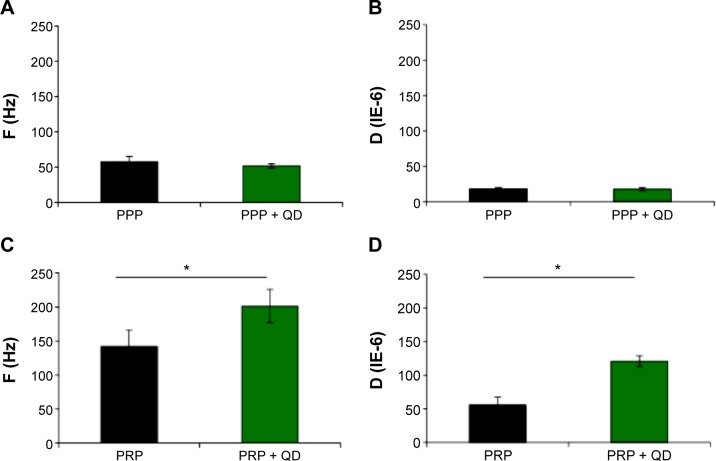
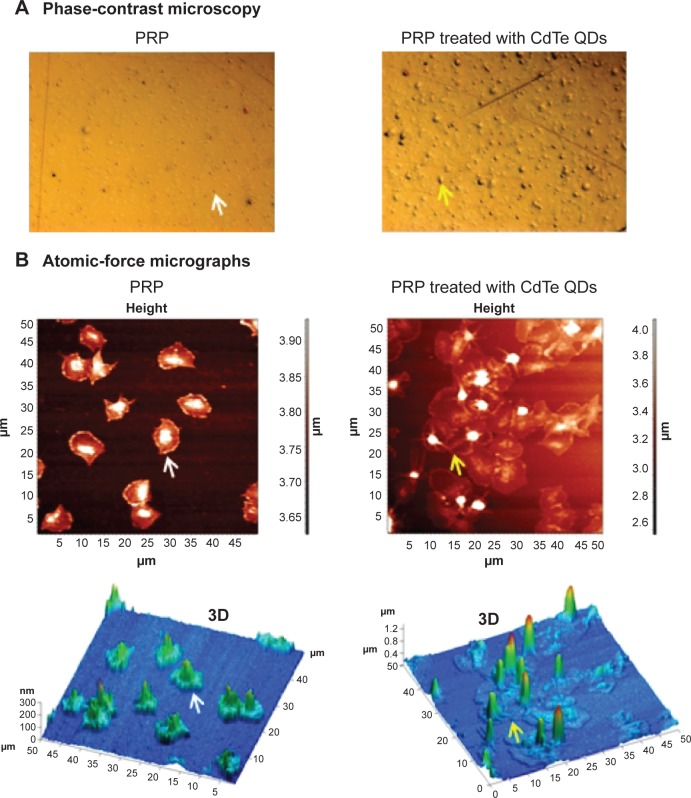
New nanomaterials intended for systemic administration have raised concerns regarding their biocompatibility and hemocompatibility. Quantum dots (QD) nanoparticles have been used for diagnostics, and recent work suggests their use for in vivo molecular and cellular imaging. However, the hemocompatibility of QDs and their constituent components has not been fully elucidated. In the present study, comprehensive investigation of QD-platelet interactions is presented. These interactions were shown using transmission electron microscopy. The effects of QDs on platelet function were investigated using light aggregometry, quartz crystal microbalance with dissipation, flow cytometry, and gelatin zymography. Platelet morphology was also analyzed by phase-contrast, immunofluorescence, atomic-force and transmission electron microscopy. We show that the QDs bind to platelet plasma membrane with the resultant upregulation of glycoprotein IIb/IIIa and P-selectin receptors, and release of matrix metalloproteinase-2. These findings unravel for the first time the mechanism of functional response of platelets to ultrasmall QDs in vitro.
Keywords: aggregometry; flow cytometry; platelets; quantum dots; quartz crystal microbalance; transmission electron microscopy; zymography.
Figures
Similar articles
-
Influence of solution chemistry on the deposition and detachment kinetics of a CdTe quantum dot examined using a quartz crystal microbalance.Environ Sci Technol. 2009 May 1;43(9):3176-82. doi: 10.1021/es803388u. Environ Sci Technol. 2009. PMID: 19534131
-
Pharmacological characterization of nanoparticle-induced platelet microaggregation using quartz crystal microbalance with dissipation: comparison with light aggregometry.Int J Nanomedicine. 2015 Aug 13;10:5107-19. doi: 10.2147/IJN.S84305. eCollection 2015. Int J Nanomedicine. 2015. PMID: 26316743 Free PMC article.
-
Effects of Surface Charges on the Bactericide Activity of CdTe/ZnS Quantum Dots: A Cell Membrane Disruption Perspective.Langmuir. 2017 Mar 7;33(9):2378-2386. doi: 10.1021/acs.langmuir.7b00173. Epub 2017 Feb 20. Langmuir. 2017. PMID: 28178781
-
The use of quartz crystal microbalance with dissipation (QCM-D) for studying nanoparticle-induced platelet aggregation.Int J Nanomedicine. 2012;7:243-55. doi: 10.2147/IJN.S26679. Epub 2012 Jan 13. Int J Nanomedicine. 2012. PMID: 22275839 Free PMC article.
-
Synthesis of highly luminescent and biocompatible CdTe/CdS/ZnS quantum dots using microwave irradiation: a comparative study of different ligands.Luminescence. 2014 Nov;29(7):837-45. doi: 10.1002/bio.2630. Epub 2014 Jan 16. Luminescence. 2014. PMID: 24436082
Cited by
-
Understanding the role of biomolecular coronas in human exposure to nanomaterials.Environ Sci Nano. 2024 Sep 9;11(11):4421-4448. doi: 10.1039/d4en00488d. eCollection 2024 Nov 7. Environ Sci Nano. 2024. PMID: 39263008 Free PMC article. Review.
-
PLGA-PEG Nanoparticles Show Minimal Risks of Interference with Platelet Function of Human Platelet-Rich Plasma.Int J Mol Sci. 2020 Dec 19;21(24):9716. doi: 10.3390/ijms21249716. Int J Mol Sci. 2020. PMID: 33352749 Free PMC article.
-
High-Capacity Mesoporous Silica Nanocarriers of siRNA for Applications in Retinal Delivery.Int J Mol Sci. 2023 Feb 1;24(3):2753. doi: 10.3390/ijms24032753. Int J Mol Sci. 2023. PMID: 36769075 Free PMC article.
-
Immunotoxicity Considerations for Next Generation Cancer Nanomedicines.Adv Sci (Weinh). 2019 Aug 1;6(19):1900133. doi: 10.1002/advs.201900133. eCollection 2019 Oct 2. Adv Sci (Weinh). 2019. PMID: 31592123 Free PMC article. Review.
-
Aqueous extract of Rabdosia rubescens leaves: forming nanoparticles, targeting P-selectin, and inhibiting thrombosis.Int J Nanomedicine. 2015 Nov 4;10:6905-18. doi: 10.2147/IJN.S91316. eCollection 2015. Int J Nanomedicine. 2015. PMID: 26604756 Free PMC article.
References
-
- Azzazy HM, Mansour MM. In vitro diagnostic prospects of nanoparticles. Clin Chim Acta. 2009;403(1–2):1–8. - PubMed
-
- Azzazy HM, Mansour MM, Kazmierczak SC. From diagnostics to therapy: prospects of quantum dots. Clin Biochem. 2007;40(13–14):917–927. - PubMed
-
- Weng J, Ren J. Luminescent quantum dots: a very attractive and promising tool in biomedicine. Curr Med Chem. 2006;13(8):897–909. - PubMed
Publication types
MeSH terms
Substances
LinkOut - more resources
Full Text Sources
Miscellaneous
