Review
. 2015 Apr 8:8:13-35.
doi: 10.2147/IBPC.S49958. eCollection 2015.

Vitamin D status and hypertension: a review

Affiliations
Review

Vitamin D status and hypertension: a review

Liang Ke et al. Integr Blood Press Control. .

Abstract

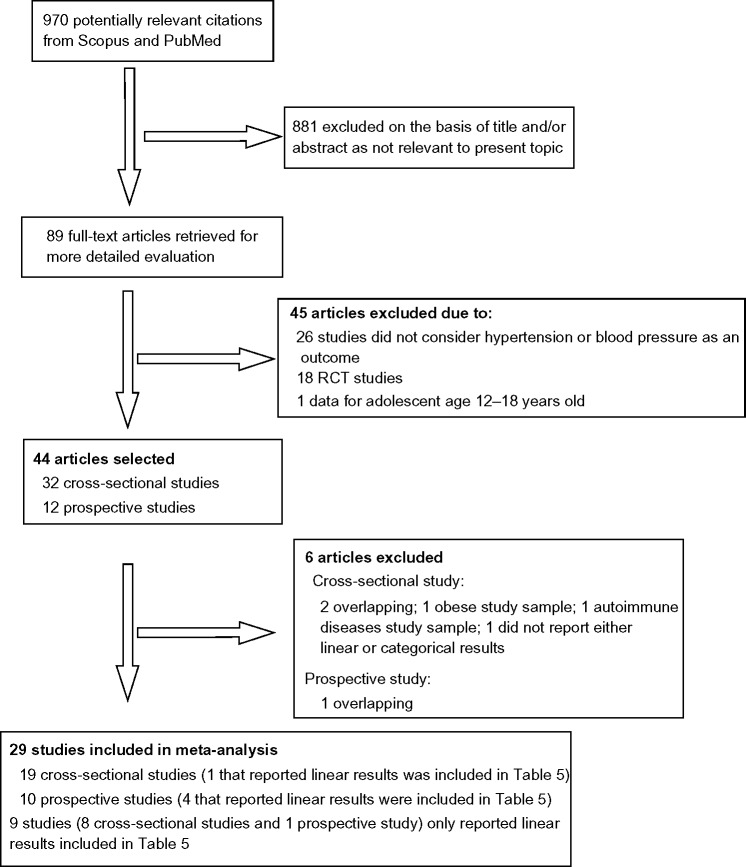
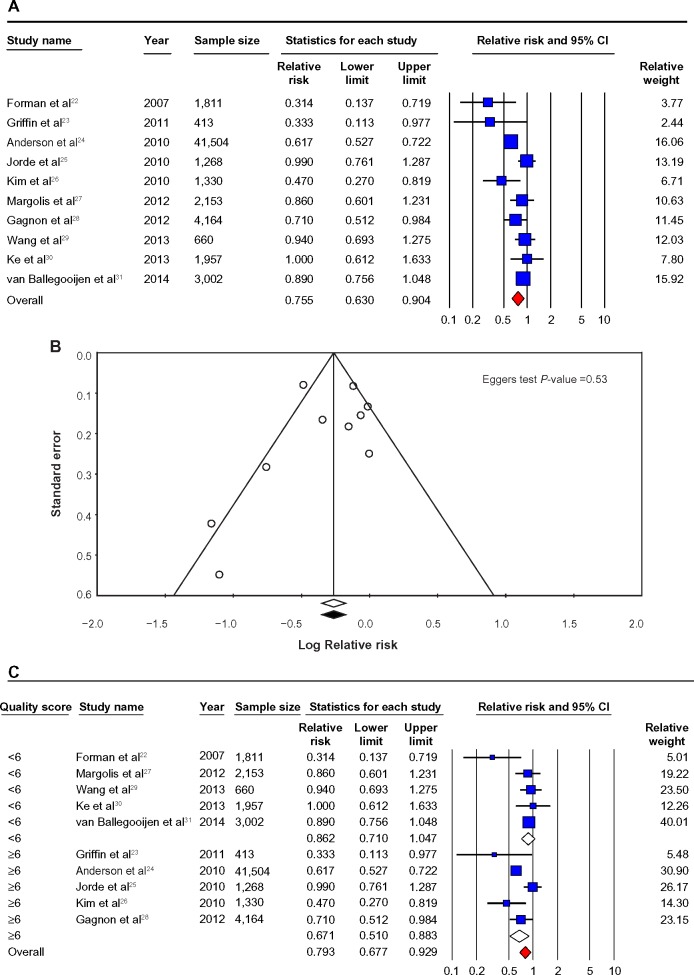
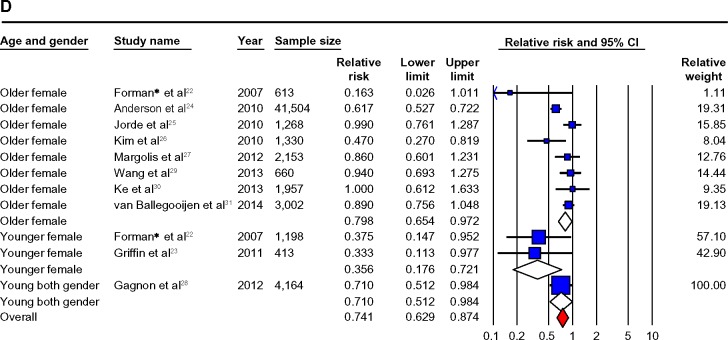
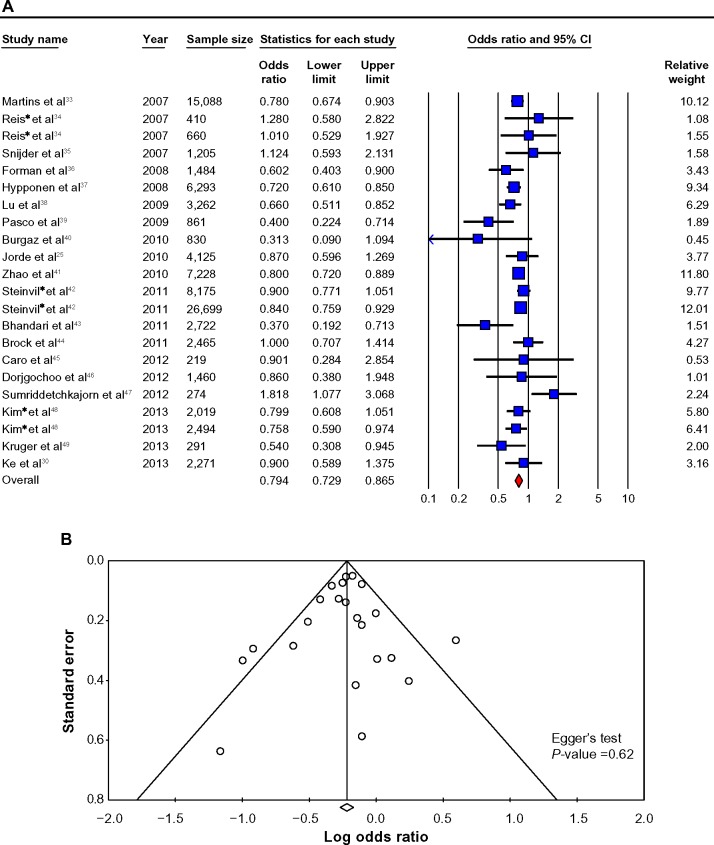
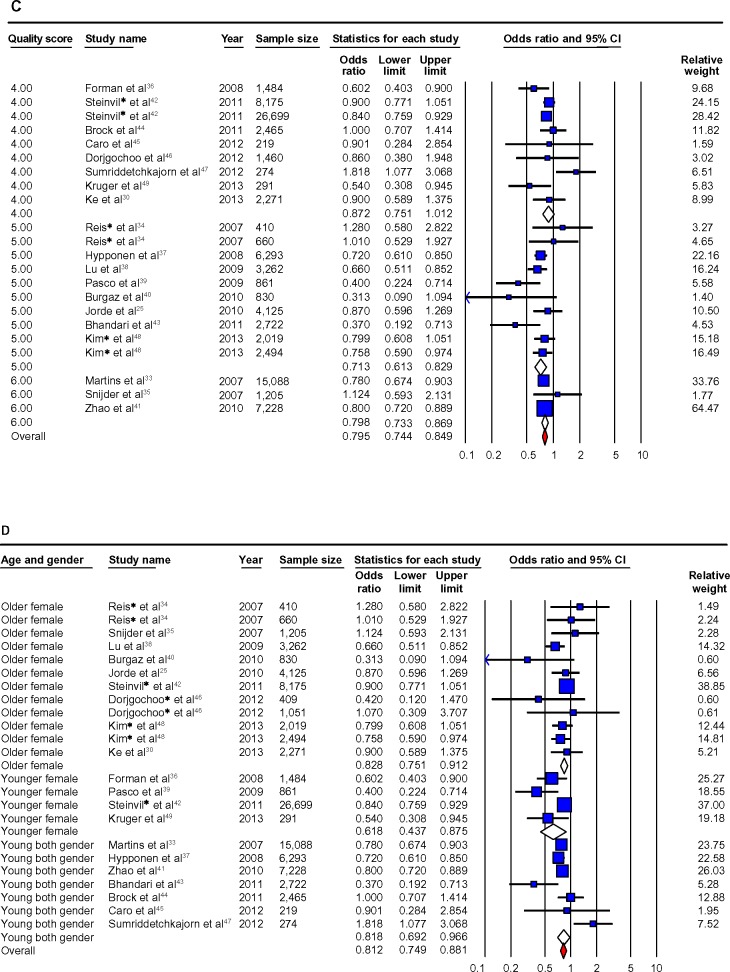
Vitamin D is a steroid prohormone synthesized in the skin following ultraviolet exposure and also achieved through supplemental or dietary intake. While there is strong evidence for its role in maintaining bone and muscle health, there has been recent debate regarding the role of vitamin D deficiency in hypertension based on conflicting epidemiological evidence. Thus, we conducted a scoping systematic literature review and meta-analysis of all observational studies published up to early 2014 in order to map trends in the evidence of this association. Mixed-effect meta-analysis was performed to pool risk estimates from ten prospective studies (n=58,262) (pooled risk for incident hypertension, relative risk [RR] =0.76 (0.63-0.90) for top vs bottom category of 25-hydroxyvitamin D [25OHD]) and from 19 cross-sectional studies (n=90,535) (odds ratio [OR] =0.79 (0.73-0.87)). Findings suggest that the better the assessed quality of the respective study design, the stronger the relationship between higher 25OHD levels and hypertension risk (RR =0.67 (0.51-0.88); OR =0.77 (0.72-0.89)). There was significant heterogeneity among the findings for both prospective and cross-sectional studies, but no evidence of publication bias was shown. There was no increased risk of hypertension when the participants were of older age or when they were vitamin D deficient. Younger females showed strong associations between high 25OHD levels and hypertension risk, especially in prospective studies (RR =0.36 (0.18-0.72); OR =0.62 (0.44-0.87)). Despite the accumulating evidence of a consistent link between vitamin D and blood pressure, these data are observational, so questions still remain in relation to the causality of this relationship. Further studies either combining existing raw data from available cohort studies or conducting further Mendelian analyses are needed to determine whether this represents a causal association. Large randomized controlled trials are also needed to determine whether vitamin supplementation may be beneficial in the prevention or the treatment of hypertension.

Keywords: 25OHD; blood pressure; cross-sectional; high blood pressure; meta-analysis; prospective.


Figures

Figure 1
Figure 1
Flowchart of meta-analysis data extraction. Abbreviation: RCT, randomized controlled trial.
Figure 2
Figure 2
Prospective studies. Notes: (A) Prospective studies of vitamin D and hypertension risk: the effect of higher vitamin D (measured as quartiles of 25OHD) on hypertension risk expressed as relative risk (RR) for individual studies (blue) and the calculated overall RR (red). (B) Funnel plot showing standard error by log RR for the prospective studies. (C) Prospective studies of vitamin D and hypertension risk sub-groups: the effect of higher vitamin D (measured as quartiles of 25OHD) on hypertension risk stratified by quality score expressed as RR for individual studies (blue), sub-groups total (white) and the calculated overall RR (red). (D) Prospective studies of vitamin D and hypertension risk sub-groups: the effect of higher vitamin D (measured as quartiles of 25OHD) on hypertension risk stratified by age and gender expressed as RR for individual studies (blue), sub-group total (white) and the calculated overall RR (red). *Studies published in one paper. Abbreviation: CI, confidence Interval.
Figure 2
Figure 2
Prospective studies. Notes: (A) Prospective studies of vitamin D and hypertension risk: the effect of higher vitamin D (measured as quartiles of 25OHD) on hypertension risk expressed as relative risk (RR) for individual studies (blue) and the calculated overall RR (red). (B) Funnel plot showing standard error by log RR for the prospective studies. (C) Prospective studies of vitamin D and hypertension risk sub-groups: the effect of higher vitamin D (measured as quartiles of 25OHD) on hypertension risk stratified by quality score expressed as RR for individual studies (blue), sub-groups total (white) and the calculated overall RR (red). (D) Prospective studies of vitamin D and hypertension risk sub-groups: the effect of higher vitamin D (measured as quartiles of 25OHD) on hypertension risk stratified by age and gender expressed as RR for individual studies (blue), sub-group total (white) and the calculated overall RR (red). *Studies published in one paper. Abbreviation: CI, confidence Interval.
Figure 3
Figure 3
Cross-sectional studies. Notes: (A) Cross-sectional studies of vitamin D and hypertension risk: the effect of higher vitamin D (measured as quartiles of 25OHD) on hypertension risk expressed as odds ratio (OR) for individual studies (blue) and the calculated overall OR (red). (B) Funnel plot showing standard error by log OR for the cross-sectional studies. (C) Cross-sectional studies of vitamin D and hypertension risk sub-groups: the effect of higher vitamin D (measured as quartiles of 25OHD) on hypertension risk stratified by quality score expressed as OR for individual studies (blue), sub-group total(white) and the calculated overall OR (red). (D) Cross-sectional studies of vitamin D and hypertension risk sub-groups: the effect of higher vitamin D (measured as quartiles of 25OHD) on hypertension risk stratified by age and gender expressed as OR for individual studies (blue), sub-groups total (white) and the calculated overall OR (red). *Studies published in one paper. Abbreviation: CI, confidence Interval.
Figure 3
Figure 3
Cross-sectional studies. Notes: (A) Cross-sectional studies of vitamin D and hypertension risk: the effect of higher vitamin D (measured as quartiles of 25OHD) on hypertension risk expressed as odds ratio (OR) for individual studies (blue) and the calculated overall OR (red). (B) Funnel plot showing standard error by log OR for the cross-sectional studies. (C) Cross-sectional studies of vitamin D and hypertension risk sub-groups: the effect of higher vitamin D (measured as quartiles of 25OHD) on hypertension risk stratified by quality score expressed as OR for individual studies (blue), sub-group total(white) and the calculated overall OR (red). (D) Cross-sectional studies of vitamin D and hypertension risk sub-groups: the effect of higher vitamin D (measured as quartiles of 25OHD) on hypertension risk stratified by age and gender expressed as OR for individual studies (blue), sub-groups total (white) and the calculated overall OR (red). *Studies published in one paper. Abbreviation: CI, confidence Interval.

Similar articles

Cited by

References

    1. Guo F, He D, Zhang W, Walton RG. Trends in prevalence, awareness, management, and control of hypertension among United States adults, 1999 to 2010. J Am Coll Cardiol. 2012;60(70):599–606. - PubMed
    1. World Health Organization . Global Status Report on Non-Communicable Diseases 2010. Geneva: World Health Organization; 2011.
    1. Ibrahim MM, Damasceno A. Hypertension in developing countries. Lancet. 2012;380(9841):611–619. - PubMed
    1. Cutler JA, Sorlie PD, Wolz M, Thom T, Fields LE, Roccella EJ. Trends in hypertension prevalence, awareness, treatment, and control rates in United States adults between 1988–1994 and 1999–2004. Hypertension. 2008;52(5):818–827. - PubMed
    1. Lavie CJ, Dinicolantonio JJ, Milani RV, O’Keefe JH. Vitamin D and cardiovascular health. Circulation. 2013;128(22):2404–2406. - PubMed