. 2015 Apr 5;5(7):733-45.
doi: 10.7150/thno.10305. eCollection 2015.

Circulating MiR-16-5p and MiR-19b-3p as Two Novel Potential Biomarkers to Indicate Progression of Gastric Cancer

Affiliations

Circulating MiR-16-5p and MiR-19b-3p as Two Novel Potential Biomarkers to Indicate Progression of Gastric Cancer

Jingpu Zhang et al. Theranostics. .

Abstract

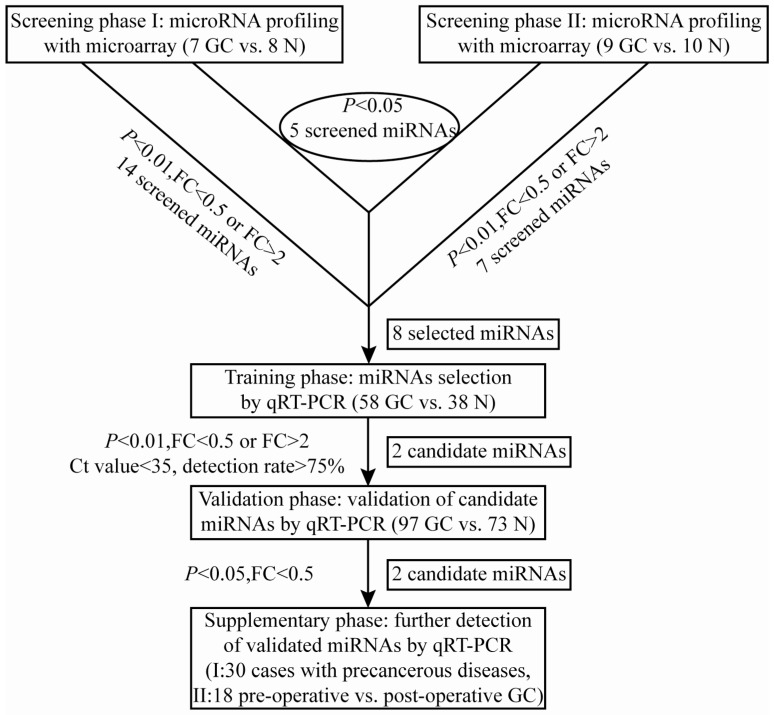
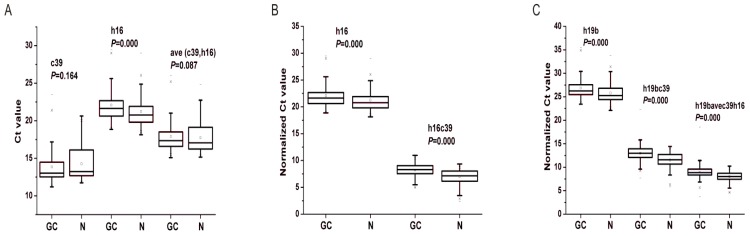
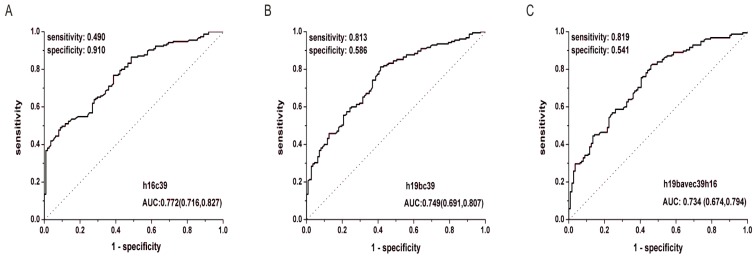
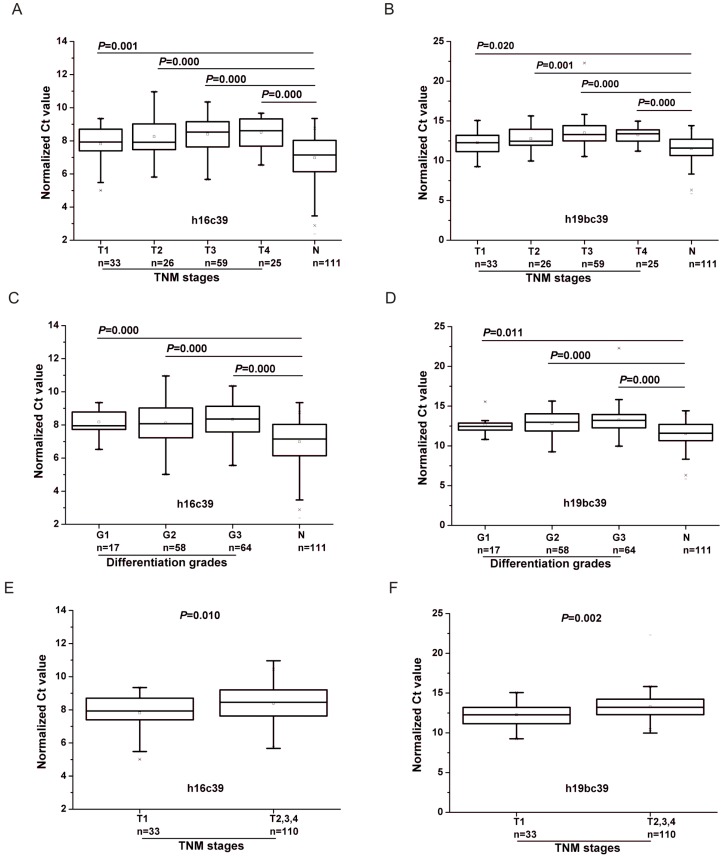
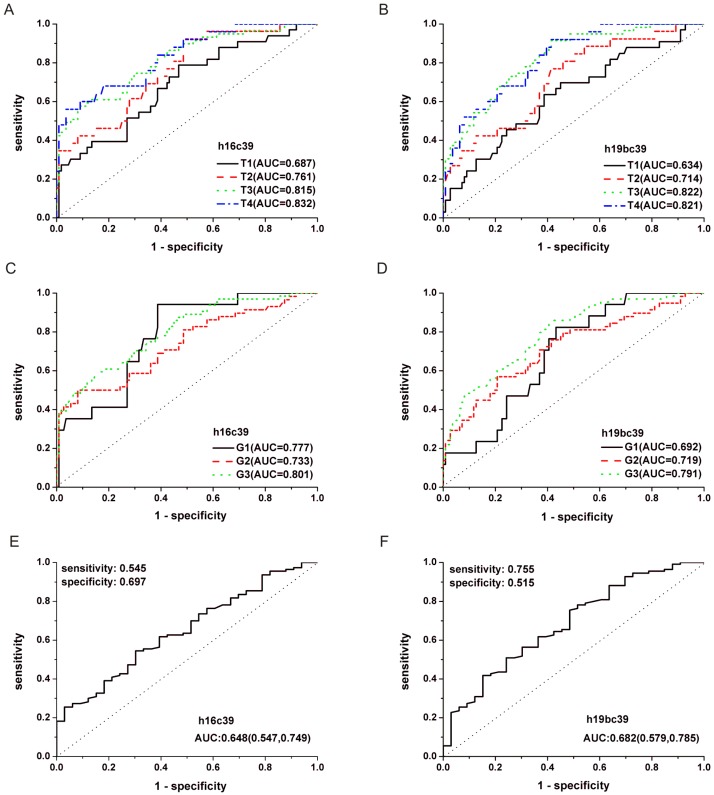
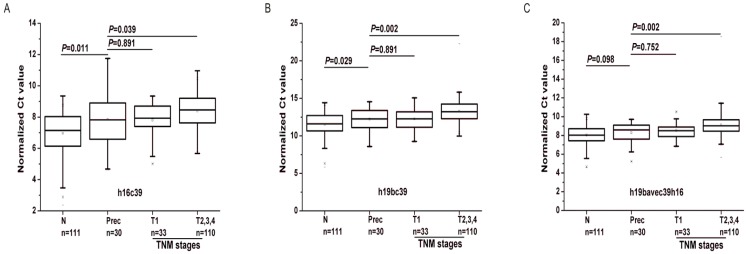
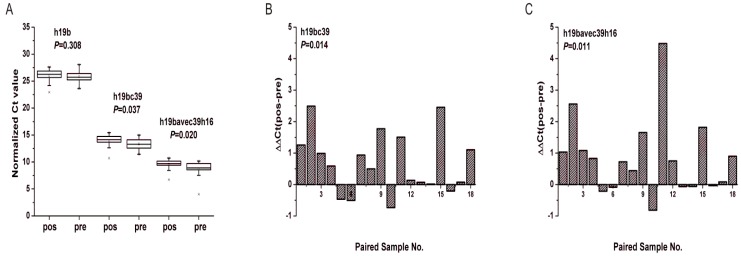
Gastric cancer (GC) is the second most common cancer in China and the second leading cause of cancer-related death in the world. Identifying circulating biomarkers is helpful to improve theranostics of gastric cancer. Herein, we are for the first time to report miR-16-5p and miR-19b-3p were identified to be the novel potential plasma biomarkers to detect gastric cancer. Differentially expressed miRNAs were initially screened out by genome-wide miRNA profiling microarrays between 16 plasma samples of gastric cancer and 18 matched normal controls, and then were quantified and validated by quantitative reverse transcription-PCR method between 155 gastric cancer cases and 111 normal controls. Additionally, 30 plasma samples from precancerous lesions and 18 paired samples from gastric cancer patients with gastrectomy were further detected. Results showed that based on two normalization methods, miR-16-5p and miR-19b-3p in plasma were found to be capable of distinguishing normal population from GC cases with different TNM stages and differentiation grades, particularly including the early cancer cases (P<0.05). And the two miRNAs were down-regulated in GC cases (FC<0.5). Especially, the down-regulation degree was correlated with the progression of the GC cases from the early stage to the advanced stage (0.2< r s<0.3, P<0.01). And the same weak down-regulation of the two biomarkers as the early GC occurred initially in the precancerous diseases (P<0.05). The corresponding performance of the two miRNAs to detect GC in ROC analysis gradually performed better with the disease progression from the earlier stages or lower grades to the advanced stages (TNM Ⅳ stage: AUC=0.832 for miR-16-5p; TNM Ⅲ stage: AUC=0.822 for miR-19b-3p) or high grade (Poorly differentiated: AUC=0.801, 0.791 respectively for miR-16-5p and miR-19b-3p). Additionally, miR-19b-3p remained down-regulated in patient plasma within 9 days after gastrectomy. In conclusion, miR-19b-3p and miR-16-5p maybe prospective biomarkers to detect gastric cancer and indicate its progression, and thus may own great potential in applications such as early screening and progression evaluation of gastric cancer in the near future.

Keywords: circulating microRNA biomarker; gastric cancer; miR-16-5p; miR-19b-3p; miRNA profiling microarray; quantitative reverse transcription-PCR.


Conflict of interest statement

Competing Interests: The authors have declared that no competing interest exists.

Figures

Figure 1
Figure 1
A flow chart of the study design
Figure 2
Figure 2
Differentially expressed miRNAs from two sets of microarray profiling. Unsupervised hierarchical cluster analysis for differentially expressed miRNAs identified as significant by t-test (P<0.05) provided by microarray profiling: (A) Set 1 (No., BH13053) comprised of 7 GC cases and 8 normal controls and (B) Set 2 (No., BH13333) comprised of 9 GC cases and 10 normal controls. Samples are shown in columns and miRNAs in rows. The insets are color keys indicating the range of normalized log2-based signals and the histograms of the signals. (C) Two-way Venn diagram indicating the numbers of differentially expressed miRNAs (P<0.05) in Set 1 (a) and Set 2 (b).
Figure 3
Figure 3
Differential expression levels of reference miRNAs (A), miR-16-5p (B) and miR-19b-3p (C) in the total training and validation phases. c39, h16 and h19b denote the raw Ct value of cel-miR-39, miR-16-5p and miR-19b-3p; ave(c39, h16) denotes the mean Ct value of cel-miR-39 and miR-16-5p; h16c39 and h19bc39 denote the normalized Ct value by subtracting the Ct value of cel-miR-39 from that of miR-16-5p and miR-19b-3p; h19bavec39h16 denotes the normalized Ct value by subtracting the Ct value of ave(c39,h16) from that of miR-19b-3p. Mann-Whitney U test was used to determine statistical significance at the level of P<0.05.
Figure 4
Figure 4
ROC curves for miR-16-5p (A), miR-19b-3p (B) normalized to the exogenous miRNA and miR-19b-3p normalized to two reference miRNAs (C) to distinguish GC cases from N controls in the total training and validation phases. h16c39, h19bc39 and h19bavec39h16 were stated as in Fig. 3.
Figure 5
Figure 5
Differential expression levels of miR-16-5p (A, C, E) and miR-19b-3p (B, D, F) normalized to the exogenous miRNA in the total training and validation phases. (A, B) Boxcharts respectively between GC cases with different TNM stages and N controls. (C, D) Boxcharts respectively between GC cases with different differentiation grades and N controls. (E, F) Boxcharts between GC cases with T1 stage and those with the others. T1-4 and G1-3, as stated in Table 3; h16c39 and h19bc39, as stated in Fig. 3. Mann-Whitney U test was used to determine statistical significance at the level of P<0.05.
Figure 6
Figure 6
ROC curves for miR-16-5p (A, C, E) and miR-19b-3p (B, D, F) normalized to the exogenous miRNA in the total training and validation phases. (A, B) Curves to respectively distinguish GC cases with different TNM stages from N controls. (C, D) Curves to respectively distinguish GC cases with different differentiation grades from N controls. (E, F) Curve to distinguish GC cases with T1 stage from those with the others. T1-4 and G1-3, as stated in Table 3; h16c39 and h19bc39, as stated in Fig. 3.
Figure 7
Figure 7
Differential expression levels of miR-16-5p (A) and miR-19b-3p (B, C) in the supplementary phase Ⅰ. T1-4, as stated in Table 3; h16c39 and h19bc39 and h19bavec39h16 as stated in Fig. 3. Mann-Whitney U test was used to determine statistical significance at the level of P<0.05.
Figure 8
Figure 8
Expression levels of miR-19b-3p in the supplementary phase Ⅱ. (A) Boxcharts of the expression levels of miR-19b-3p. Mann-Whitney U test was used to determine statistical significance at the level of P<0.05. (B, C) Column charts of the differential expression levels of miR-19b-3p between pre-operative gastric cancer patients (pre) and post-operative ones (pos). ΔΔCt(pos-pre) denotes the difference of the normalized Ct value. Paired Wilcoxon test was used to determine statistical significance at the level of P<0.05. h19b, h16c39, h19bc39 and h19bavec39h16 were stated as in Fig.3.

References

    1. Ferlay J, Shin HR, Bray F. et al. Estimates of worldwide burden of cancer in 2008: Globocan 2008. Int J Cancer. 2010;127:2893–2917. - PubMed
    1. Chen WQ, Zheng RS, Zhang SW. et al. Annual report on status of cancer in china, 2010. Chinese J Cancer Res. 2014;26:48–58. - PMC - PubMed
    1. Hartgrink HH, Jansen EPM, van Grieken NCT. et al. Gastric cancer. The Lancet. 2009;374:477–490. - PMC - PubMed
    1. Wang J, Yu JC, Kang WM. et al. Treatment strategy for early gastric cancer. Surg Oncol. 2012;21:119–123. - PubMed
    1. Taback B, Hoon DSB. Circulating nucleic acids in plasma and serum: past, present and future. Curr Opin Mol Ther. 2004;6:273–278. - PubMed

Publication types