

doi: 10.3201/eid2105.141137.
Transmission Potential of Influenza A(H7N9) Virus, China, 2013-2014
- PMID: 25897624
- PMCID: PMC4412215
- DOI: 10.3201/eid2105.141137
Item in Clipboard
Transmission Potential of Influenza A(H7N9) Virus, China, 2013-2014
Emerg Infect Dis.
2015 May.
Abstract
To determine transmission potential of influenza A(H7N9) virus, we used symptom onset data to compare 2 waves of infection in China during 2013-2014. We found evidence of increased transmission potential in the second wave and showed that live bird market closure was significantly less effective in Guangdong than in other regions.
Keywords: China; H7N9 virus; infectious disease reservoir; influenza; viruses.
Figures
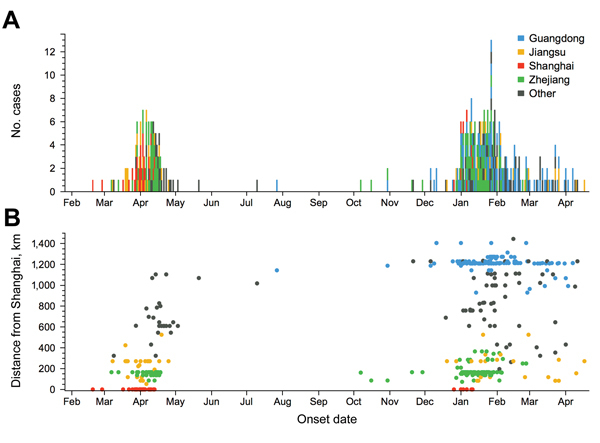
Spatial and temporal distribution of reported cases of influenza A(H7N9) virus infection among humans, China, 2013–2014. Onset of the first case in wave 1 was February 19, 2013 (although the case was not reported until the end of March 2013); onset of the last case in wave 1 was July 27, 2013; only 4 cases occurred in May–July 2013. Onset of the first case in wave 2 was October 7; onset of the last case in our time series was April 17, 2014. A) Case onset reports across all regions. Colors indicate the 4 largest geographic clusters; black indicates all other cases. B) Spatial pattern of reported cases. Points show geodesic distance between the first reported case of influenza A(H7N9) virus infection (in Shanghai) and location of each subsequent reported case. Cases are colored by region as in panel A.
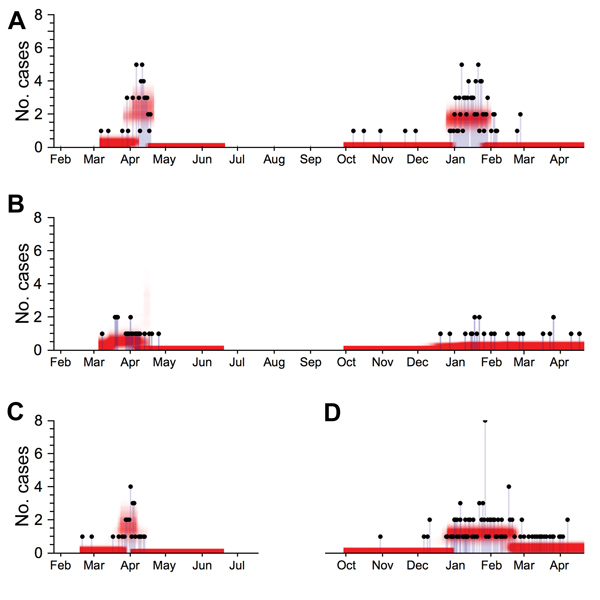
A posteriori probability estimates of spillover hazard for influenza A(H7N9) virus infection in China, by region. Black dots show total number of reported influenza A(H7N9) virus cases for which symptom onset occurred on a given date. Red shading shows a posteriori probability estimate of spillover hazard (i.e., the expected number of cases resulting from animal-to-human transmission on each day). A serial interval of 7 days was assumed. A) Zhejiang, 2013–2014; B) Jiangsu, 2013–2014; C) Shanghai, first outbreak wave, 2013; D) Guangdong, second outbreak wave, 2013–2014.
References
-
- Lau M, Wei L. Guangzhou begins trial ban of live poultry sales after H7N9 wet market tests. South China Morning Post. 2014. May 5; News/China/Health.
Publication types
MeSH terms
Grants and funding
LinkOut - more resources
Full Text Sources
Other Literature Sources
Medical
