

Acetone as biomarker for ketosis buildup capability--a study in healthy individuals under combined high fat and starvation diets
- PMID: 25897953
- PMCID: PMC4471925
- DOI: 10.1186/s12937-015-0028-x
Acetone as biomarker for ketosis buildup capability--a study in healthy individuals under combined high fat and starvation diets
Abstract
Background: Ketogenic diets are high fat and low carbohydrate or very low carbohydrate diets, which render high production of ketones upon consumption known as nutritional ketosis (NK). Ketosis is also produced during fasting periods, which is known as fasting ketosis (FK). Recently, the combinations of NK and FK, as well as NK alone, have been used as resources for weight loss management and treatment of epilepsy.
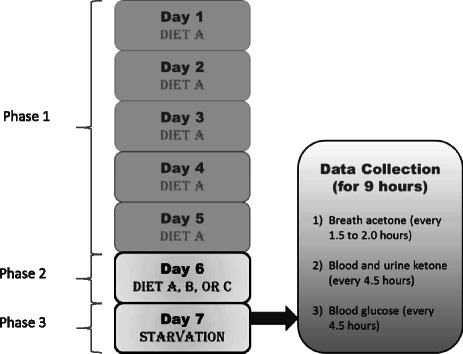
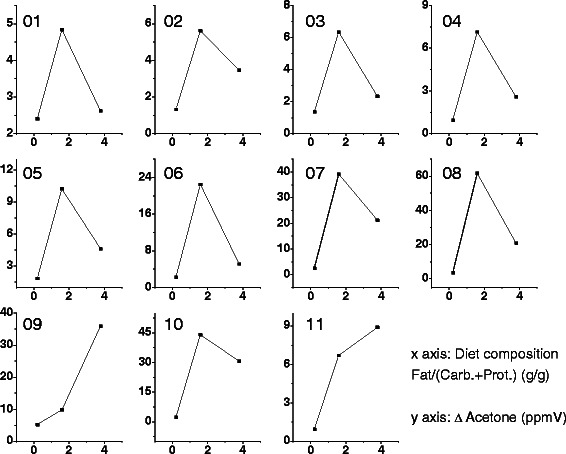
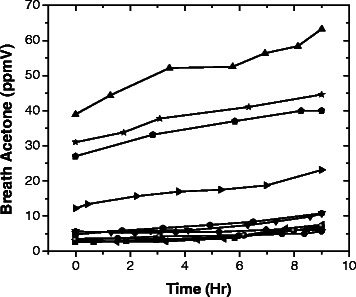
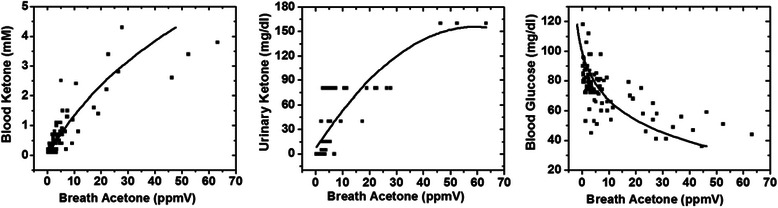
Methods: A crossover study design was applied to 11 healthy individuals, who maintained moderately sedentary lifestyle, and consumed three types of diet randomly assigned over a three-week period. All participants completed the diets in a randomized and counterbalanced fashion. Each weekly diet protocol included three phases: Phase 1 - A mixed diet with ratio of fat: (carbohydrate + protein) by mass of 0.18 or the equivalence of 29% energy from fat from Day 1 to Day 5. Phase 2- A mixed or a high-fat diet with ratio of fat: (carbohydrate + protein) by mass of approximately 0.18, 1.63, or 3.80 on Day 6 or the equivalence of 29%, 79%, or 90% energy from fat, respectively. Phase 3 - A fasting diet with no calorie intake on Day 7. Caloric intake from diets on Day 1 to Day 6 was equal to each individual's energy expenditure. On Day 7, ketone buildup from FK was measured.
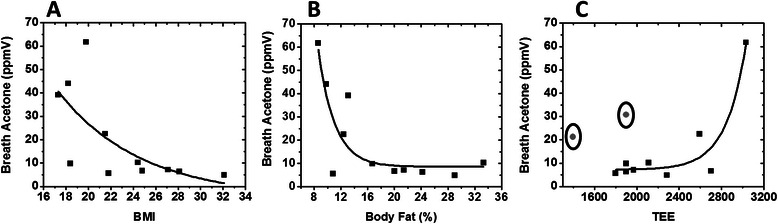
Results: A statistically significant effect of Phase 2 (Day 6) diet was found on FK of Day 7, as indicated by repeated analysis of variance (ANOVA), F(2,20) = 6.73, p < 0.0058. Using a Fisher LDS pair-wise comparison, higher significant levels of acetone buildup were found for diets with 79% fat content and 90% fat content vs. 29% fat content (with p = 0.00159**, and 0.04435**, respectively), with no significant difference between diets with 79% fat content and 90% fat content. In addition, independent of the diet, a significantly higher ketone buildup capability of subjects with higher resting energy expenditure (R(2) = 0.92), and lower body mass index (R(2) = 0.71) was observed during FK.
Figures
References
-
- Charles R, Bee Y, Eng P, Goh S. Point-of-care blood ketone testing: screening for diabetic ketoacidosis at the emergency department. Singapore Med J. 2007;48:986–9. - PubMed
-
- Frayn K. Metabolic Regulation: A Human Perspective (3rd Edition) United Kingdom: Wiley-Blackwell; 2010.
Publication types
MeSH terms
Substances
LinkOut - more resources
Full Text Sources
Other Literature Sources
Medical
Miscellaneous
