

External Validation and Recalibration of Risk Prediction Models for Acute Traumatic Brain Injury among Critically Ill Adult Patients in the United Kingdom
- PMID: 25898072
- PMCID: PMC4589267
- DOI: 10.1089/neu.2014.3628
External Validation and Recalibration of Risk Prediction Models for Acute Traumatic Brain Injury among Critically Ill Adult Patients in the United Kingdom
Abstract
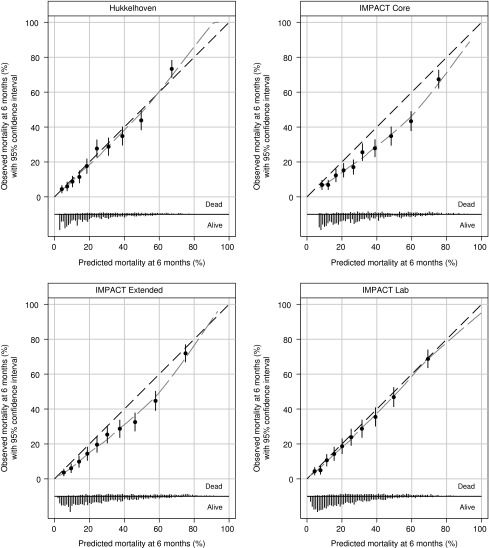
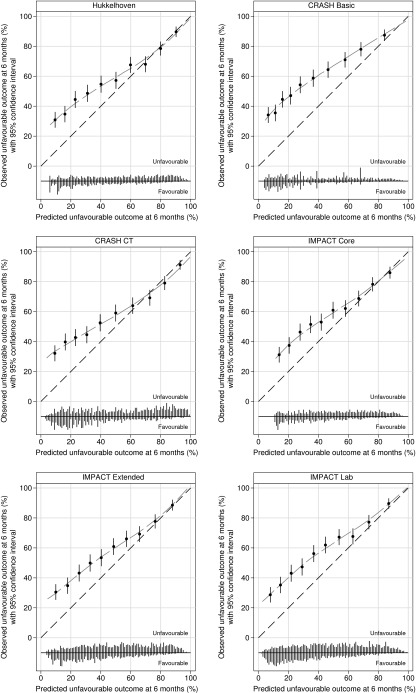
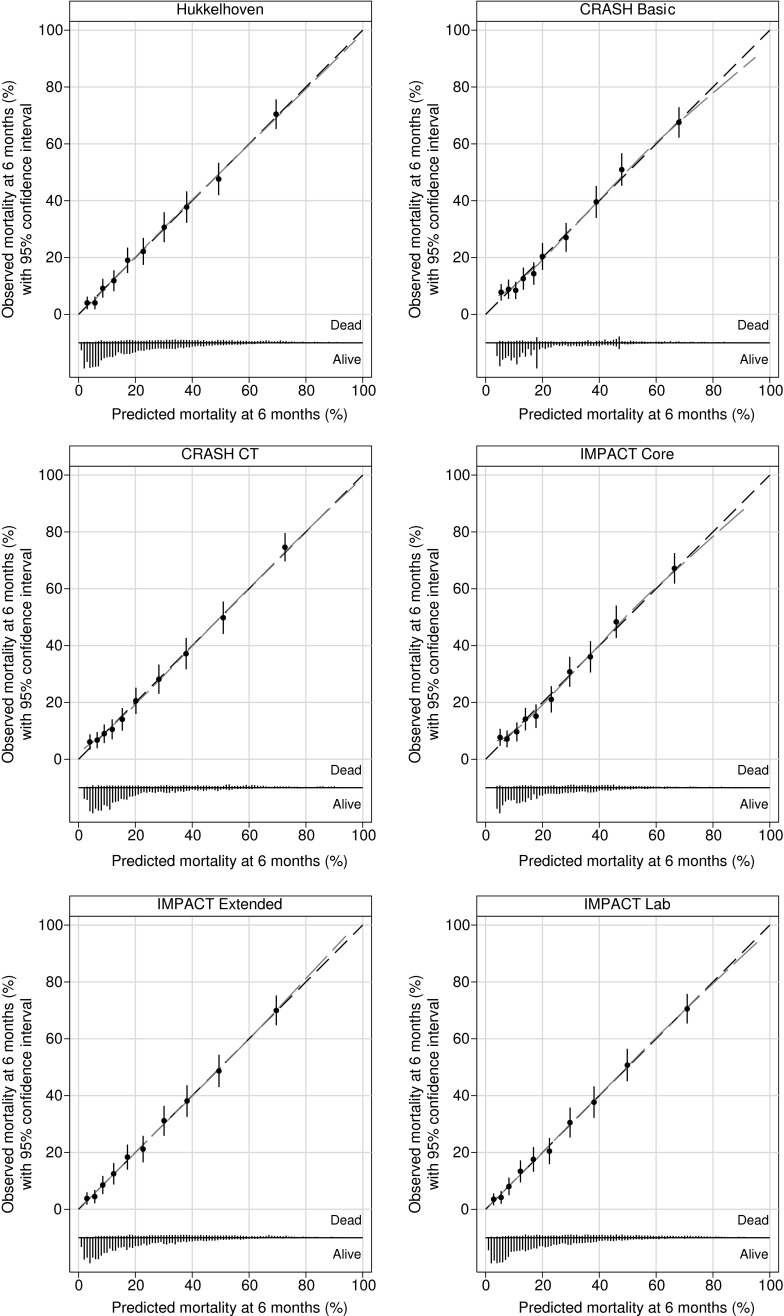
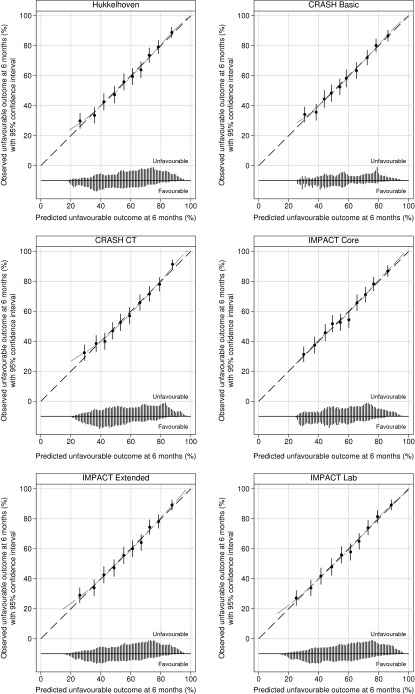
This study validates risk prediction models for acute traumatic brain injury (TBI) in critical care units in the United Kingdom and recalibrates the models to this population. The Risk Adjustment In Neurocritical care (RAIN) Study was a prospective, observational cohort study in 67 adult critical care units. Adult patients admitted to critical care following acute TBI with a last pre-sedation Glasgow Coma Scale score of less than 15 were recruited. The primary outcomes were mortality and unfavorable outcome (death or severe disability, assessed using the Extended Glasgow Outcome Scale) at six months following TBI. Of 3626 critical care unit admissions, 2975 were analyzed. Following imputation of missing outcomes, mortality at six months was 25.7% and unfavorable outcome 57.4%. Ten risk prediction models were validated from Hukkelhoven and colleagues, the Medical Research Council (MRC) Corticosteroid Randomisation After Significant Head Injury (CRASH) Trial Collaborators, and the International Mission for Prognosis and Analysis of Clinical Trials in TBI (IMPACT) group. The model with the best discrimination was the IMPACT "Lab" model (C index, 0.779 for mortality and 0.713 for unfavorable outcome). This model was well calibrated for mortality at six months but substantially under-predicted the risk of unfavorable outcome. Recalibration of the models resulted in small improvements in discrimination and excellent calibration for all models. The risk prediction models demonstrated sufficient statistical performance to support their use in research and audit but fell below the level required to guide individual patient decision-making. The published models for unfavorable outcome at six months had poor calibration in the UK critical care setting and the models recalibrated to this setting should be used in future research.
Keywords: outcome measures; prospective study; traumatic brain injury.
Figures
Similar articles
-
Risk Adjustment In Neurocritical care (RAIN)--prospective validation of risk prediction models for adult patients with acute traumatic brain injury to use to evaluate the optimum location and comparative costs of neurocritical care: a cohort study.Health Technol Assess. 2013 Jun;17(23):vii-viii, 1-350. doi: 10.3310/hta17230. Health Technol Assess. 2013. PMID: 23763763 Free PMC article.
-
Performance of the IMPACT and CRASH prognostic models for traumatic brain injury in a contemporary multicenter cohort: a TRACK-TBI study.J Neurosurg. 2024 Mar 15;141(2):417-429. doi: 10.3171/2023.11.JNS231425. Print 2024 Aug 1. J Neurosurg. 2024. PMID: 38489823 Free PMC article.
-
External validation of the CRASH and IMPACT prognostic models in severe traumatic brain injury.J Neurotrauma. 2014 Jul 1;31(13):1146-52. doi: 10.1089/neu.2013.3003. Epub 2014 May 12. J Neurotrauma. 2014. PMID: 24568201 Clinical Trial.
-
Guidelines for Neuroprognostication in Critically Ill Adults with Moderate-Severe Traumatic Brain Injury.Neurocrit Care. 2024 Apr;40(2):448-476. doi: 10.1007/s12028-023-01902-2. Epub 2024 Feb 17. Neurocrit Care. 2024. PMID: 38366277 Free PMC article.
-
Decompressive craniectomy for the treatment of high intracranial pressure in closed traumatic brain injury.Cochrane Database Syst Rev. 2019 Dec 31;12(12):CD003983. doi: 10.1002/14651858.CD003983.pub3. Cochrane Database Syst Rev. 2019. PMID: 31887790 Free PMC article.
Cited by
-
Performance of the IMPACT and Helsinki models for predicting 6-month outcomes in a cohort of patients with traumatic brain injury undergoing cranial surgery.Front Neurol. 2022 Oct 31;13:1031865. doi: 10.3389/fneur.2022.1031865. eCollection 2022. Front Neurol. 2022. PMID: 36388221 Free PMC article.
-
External validation of five predictive models for postoperative cardiopulmonary morbidity in a Chinese population receiving lung resection.PeerJ. 2022 Feb 9;10:e12936. doi: 10.7717/peerj.12936. eCollection 2022. PeerJ. 2022. PMID: 35186502 Free PMC article.
-
Acute spontaneous intracerebral hemorrhage and traumatic brain injury are the most common causes of critical illness in the ICU and have high early mortality.BMC Neurol. 2018 Aug 27;18(1):127. doi: 10.1186/s12883-018-1127-z. BMC Neurol. 2018. PMID: 30149796 Free PMC article.
-
Prediction performance of the machine learning model in predicting mortality risk in patients with traumatic brain injuries: a systematic review and meta-analysis.BMC Med Inform Decis Mak. 2023 Jul 29;23(1):142. doi: 10.1186/s12911-023-02247-8. BMC Med Inform Decis Mak. 2023. PMID: 37507752 Free PMC article.
-
Prognostic Value of CRASH and IMPACT Models for Predicting Mortality and Unfavorable Outcome in Traumatic Brain Injury; a Systematic Review and Meta-Analysis.Arch Acad Emerg Med. 2023 Mar 4;11(1):e27. doi: 10.22037/aaem.v11i1.1885. eCollection 2023. Arch Acad Emerg Med. 2023. PMID: 36919143 Free PMC article. Review.
References
-
- Maas A.I., Stocchetti N., and Bullock R. (2008). Moderate and severe traumatic brain injury in adults. Lancet Neurol. 7, 728–741 - PubMed
-
- Knaus W.A., Zimmerman J.E., Wagner D.P., Draper E.A., and Lawrence D.E. (1981). APACHE-acute physiology and chronic health evaluation: a physiologically based classification system. Crit. Care Med. 9, 591–597 - PubMed
-
- Hyam J.A., Welch C.A., Harrison D.A., and Menon D.K. (2006). Case mix, outcomes and comparison of risk prediction models for admissions to adult, general and specialist critical care units for head injury: a secondary analysis of the ICNARC Case Mix Programme Database. Crit. Care 10 Suppl 2, S2. - PMC - PubMed
-
- Hayes J.A., Black N.A., Jenkinson C., Young J.D., Rowan K.M., Daly K., and Ridley S. (2000). Outcome measures for adult critical care: a systematic review. Health Technol. Assess. 4, 1–111 - PubMed
MeSH terms
Substances
Grants and funding
LinkOut - more resources
Full Text Sources
Other Literature Sources
Miscellaneous
