

doi: 10.1016/j.cub.2015.02.049.
The reptilian brain
Affiliations
- PMID: 25898097
- PMCID: PMC4406946
- DOI: 10.1016/j.cub.2015.02.049
Item in Clipboard
The reptilian brain
Curr Biol.
.
Abstract
A Primer on the reptile brain, in particular the light it sheds on the structural and functional evolution of vertebrate neural circuits.
Figures
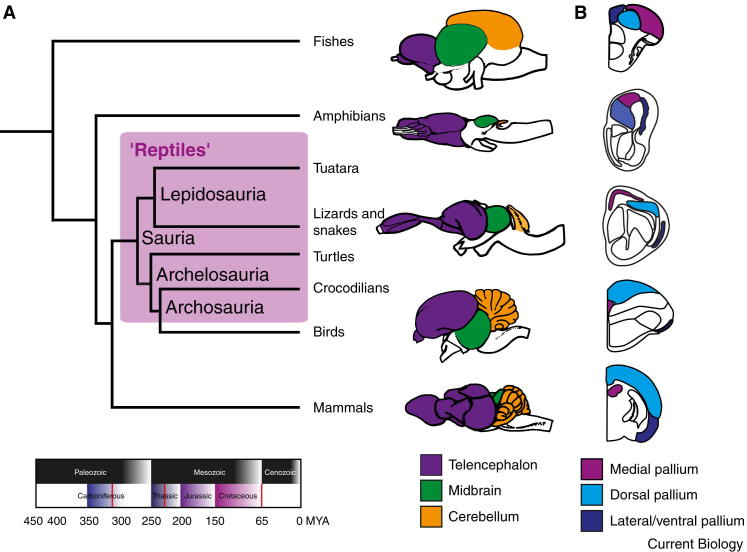
Vertebrate phylogeny, gross brain morphology, and homologous regions in the forebrain. (A) Phylogenetic tree of vertebrates and timeline of major events in amniote evolution. Shaded area in the phylogenetic tree indicates ‘reptiles’ as defined in the text. Red lines (lower panel) indicate the origin of amniotes (320 million years ago), the origin of dinosaurs (230 million years ago) and their extinction (65 million years ago). Right panel: schematic drawings showing brains (lateral view, anterior left) of vertebrate representatives: from top to bottom, a fish (knife-fish), an amphibian (tiger salamander), a reptile (monitor lizard), a bird (pigeon) and a mammal (hedgehog tenrec). Major subdivisions (examples in color) are present in all species but appear in different proportions. Adapted from Nieuwenhuys et al. (1998), with kind permission from Springer Science and Business Media. (B) Transverse section of the right hemisphere of vertebrate representatives: from top to bottom, a fish (zebrafish), an amphibian (frog), a reptile (lizard), a bird (pigeon) and a mammal (rat). Colors represent conserved pallial subdivisions. Adapted from Bruce and Neary (1995), Bruce (2007) and Mueller et al. (2011).
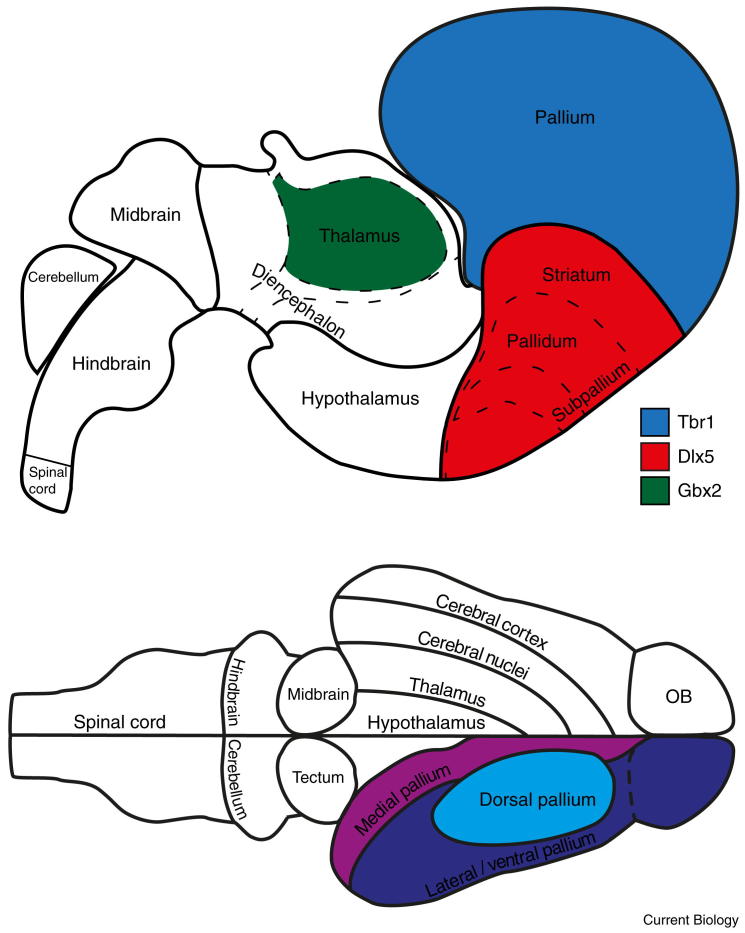
Developmental and adult bauplan of the vertebrate brain. Upper panel: simplified developmental scheme of vertebrate brain regions. Combinatorial expression of transcription factors such as Tbr1, Dlx5, and Gbx2 defines brain regions during development and sets the stage for further differentiation in adults. Note that Tbr1 and Dlx5 delineate further regions not shown here. Lower panel: schematic illustration of the adult turtle brain showing major subdivisions present in all vertebrates. Lateral and medial pallium express different sets of molecular markers during development. Which regions of the adult brain correspond to lateral and medial pallium is an active topic of research and thus we combine both pallial subdivisions into a single region. Adapted from Puelles et al. (2013) and Swanson (2011) by permission of Oxford University Press, USA.
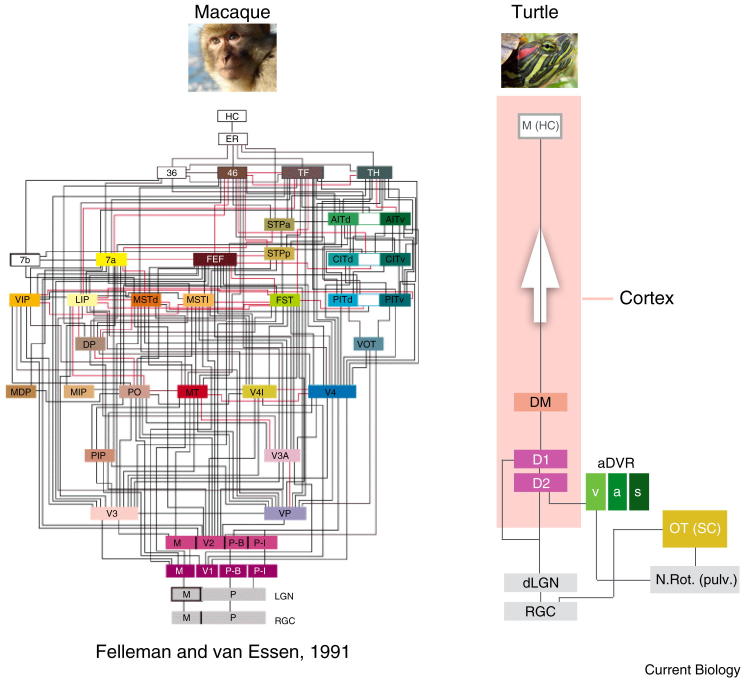
Visual circuits in monkey and turtle. Comparison of known visual cortical circuits between macaque (left) and freshwater turtle (right), emphasizing the great simplicity of reptilian cortex. Arrow indicates direction of information flow from sensory periphery. aDVR, anterior dorsal ventricular ridge (a: auditory, s: somatosensory, v: visual); dLGN, dorsal lateral geniculate nucleus; D1 and D2, dorsal cortex areas D1 and D2; DM, dorsomedial cortex; M (HC), medial cortex (‘hippocampus’); N.Rot., nucleus rotundus (‘pulvinar’); OT, optic tectum (‘superior colliculus’); RGC, retinal ganglion cells. Adapted from Felleman and van Essen (1991), by permission of Oxford University Press. Monkey photo: RedCoat, Wikimedia Commons; turtle photo: Eurogroup for Animals.
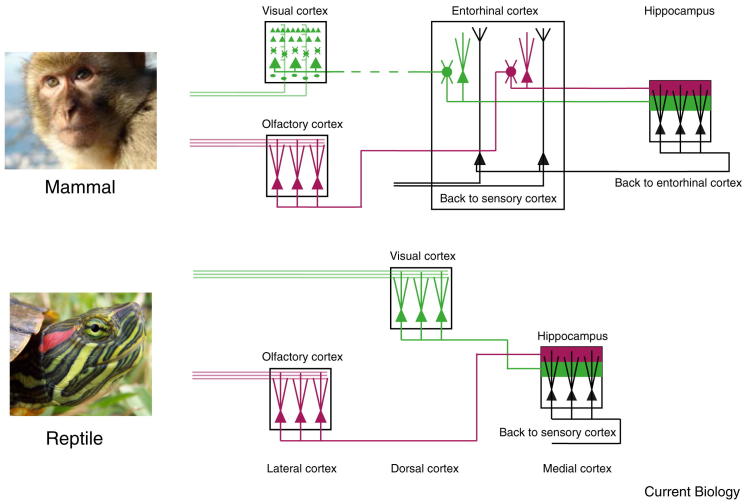
Shared circuit motifs between reptilian and mammalian cortex. Whereas processing steps are fewer in reptiles, they reach the same target as in mammalian cortex. Cortical architecture is more similar across regions in reptiles, suggesting similar and possibly general computations are performed on different sensory inputs. Adapted from: Igarashi et al. (2014). Monkey photo: RedCoat, Wikimedia Commons; turtle photo: Eurogroup for Animals.
References
-
- Bruce L.L. Evolution of the nervous system in reptiles. In: Kaas J.H., editor. Volume 2. Academic Press; Oxford: 2007. pp. 125–156. (Evolution of Nervous Systems).
-
- Bruce L.L., Neary T.J. The limbic system of tetrapods: a comparative analysis of cortical and amygdalar populations. Brain Behav. Evol. 1995;46:224–234. - PubMed
-
- Felleman D.J., van Essen D.C. Distributed hierarchical processing in the primate cerebral cortex. Cereb. Cortex. 1991;1:1–47. - PubMed
MeSH terms
Grants and funding
LinkOut - more resources
Full Text Sources
Other Literature Sources
