

Causal factors for seismicity near Azle, Texas
- PMID: 25898170
- PMCID: PMC4410634
- DOI: 10.1038/ncomms7728
Causal factors for seismicity near Azle, Texas
Abstract
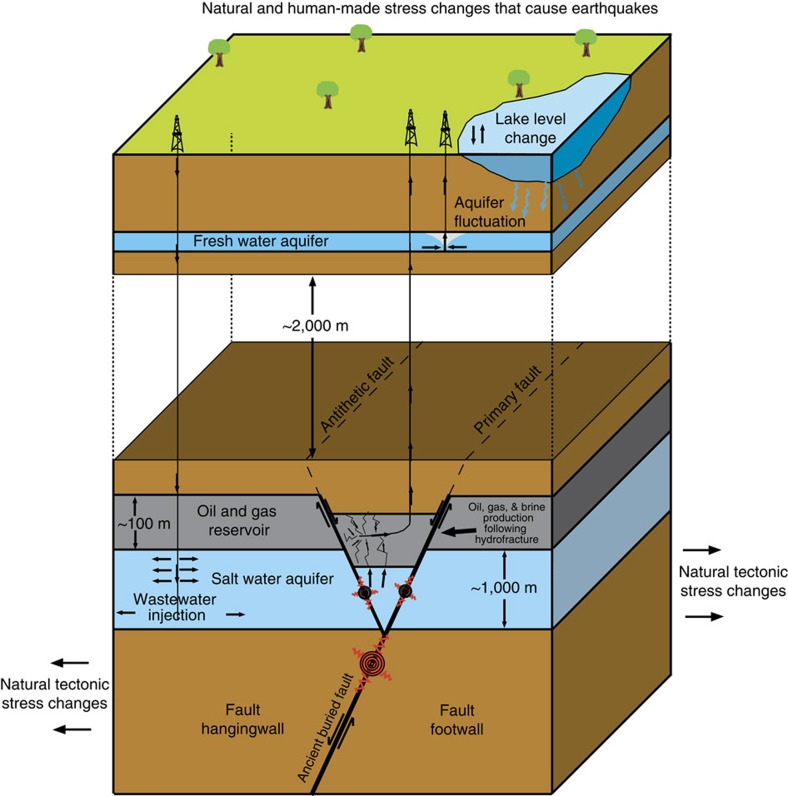
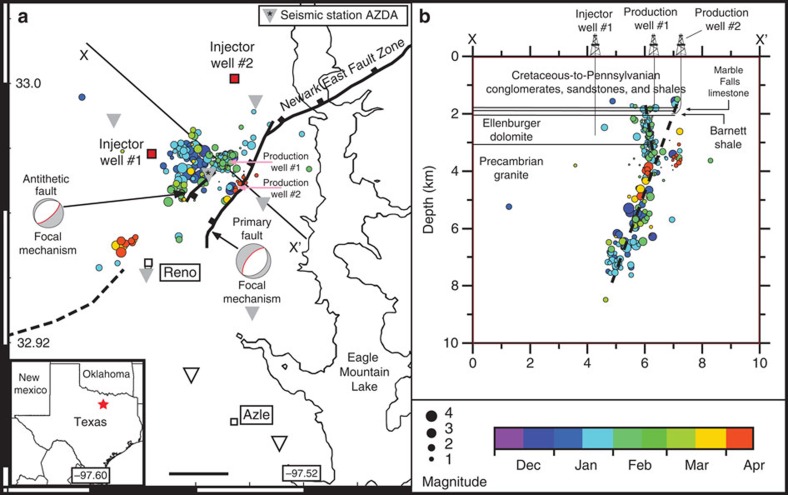
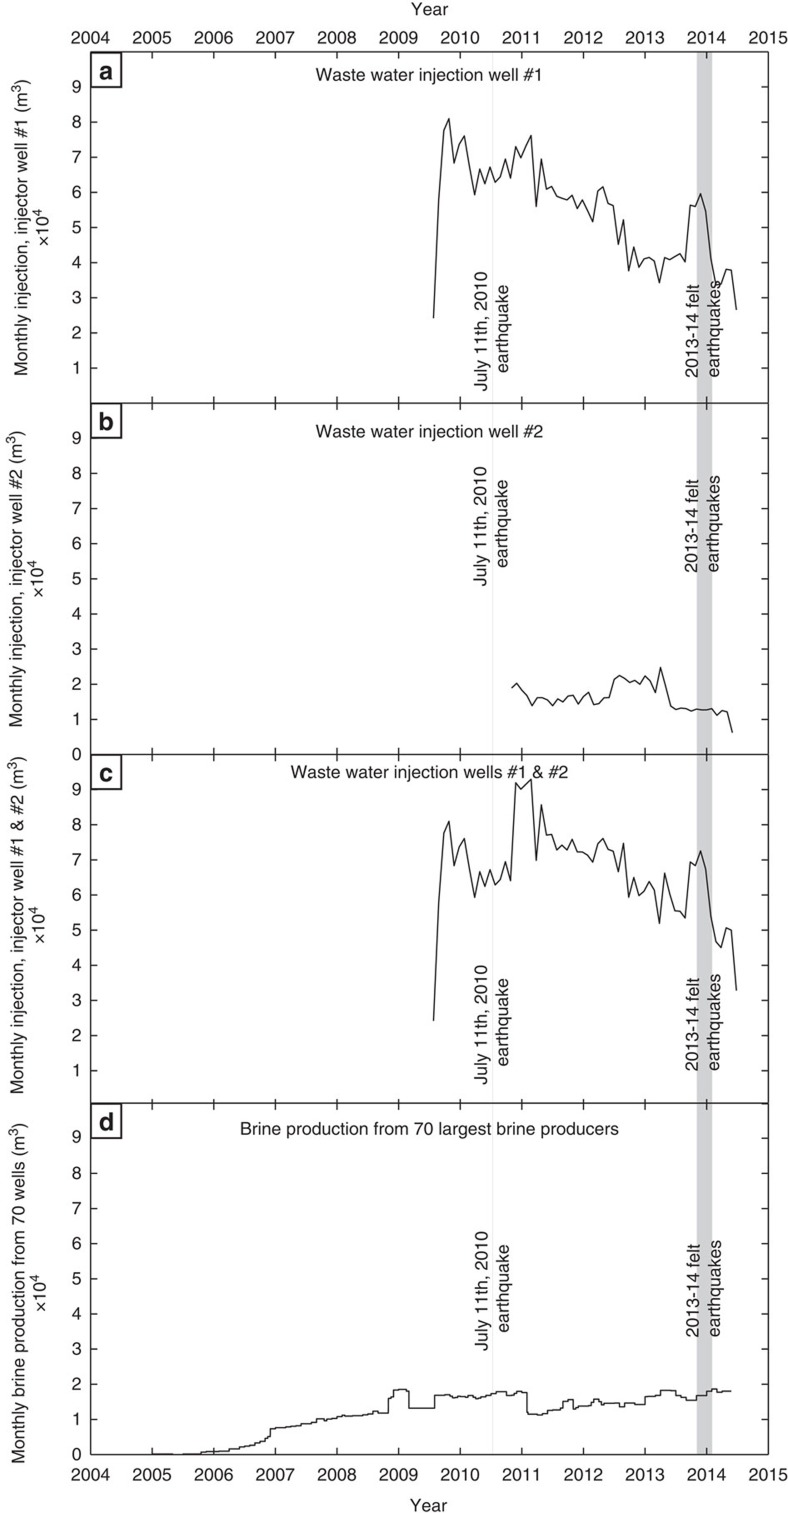
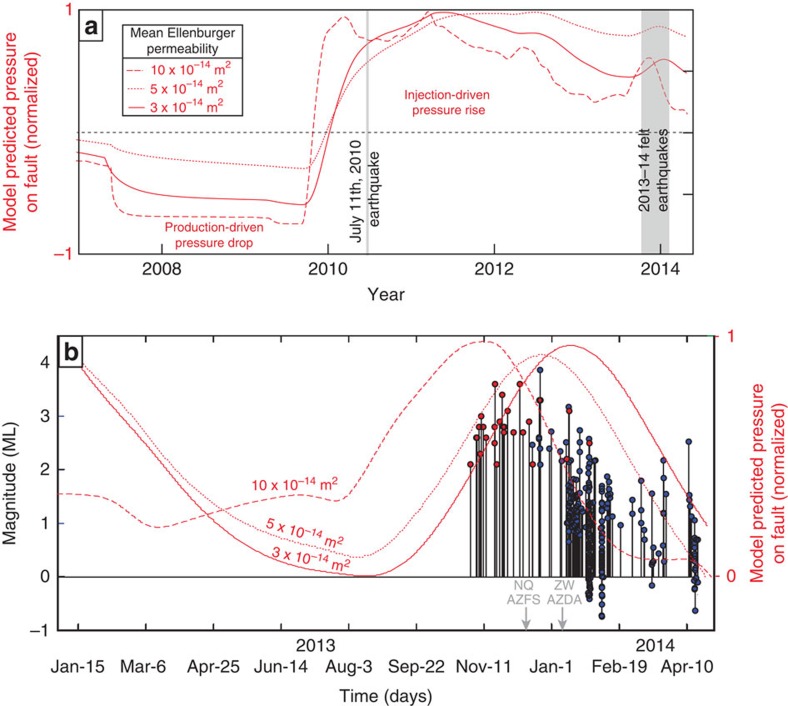
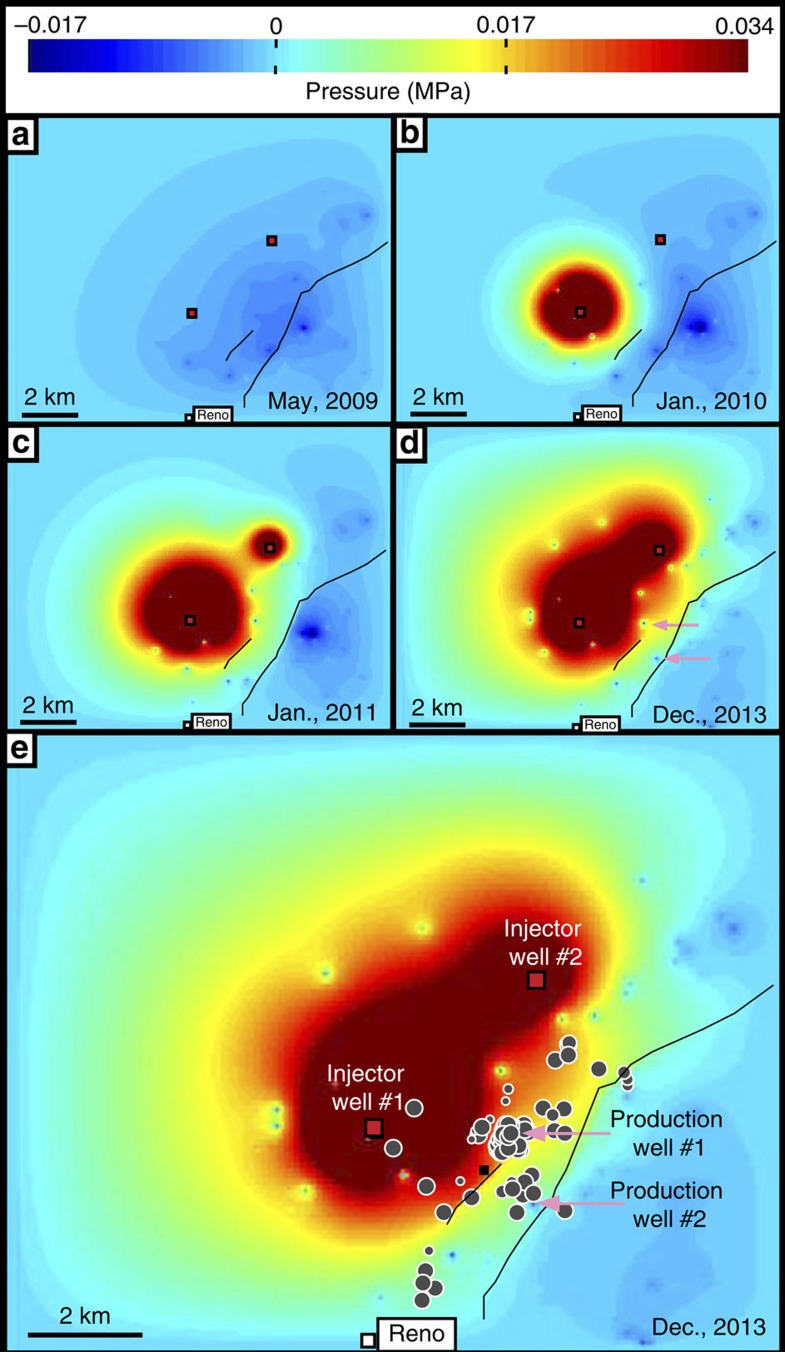
In November 2013, a series of earthquakes began along a mapped ancient fault system near Azle, Texas. Here we assess whether it is plausible that human activity caused these earthquakes. Analysis of both lake and groundwater variations near Azle shows that no significant stress changes were associated with the shallow water table before or during the earthquake sequence. In contrast, pore-pressure models demonstrate that a combination of brine production and wastewater injection near the fault generated subsurface pressures sufficient to induce earthquakes on near-critically stressed faults. On the basis of modelling results and the absence of historical earthquakes near Azle, brine production combined with wastewater disposal represent the most likely cause of recent seismicity near Azle. For assessing the earthquake cause, our research underscores the necessity of monitoring subsurface wastewater formation pressures and monitoring earthquakes having magnitudes of ∼M2 and greater. Currently, monitoring at these levels is not standard across Texas or the United States.
Figures
Similar articles
-
Causal mechanism of injection-induced earthquakes through the Mw 5.5 Pohang earthquake case study.Nat Commun. 2020 May 26;11(1):2614. doi: 10.1038/s41467-020-16408-0. Nat Commun. 2020. PMID: 32457321 Free PMC article.
-
Two-year survey comparing earthquake activity and injection-well locations in the Barnett Shale, Texas.Proc Natl Acad Sci U S A. 2012 Aug 28;109(35):13934-8. doi: 10.1073/pnas.1207728109. Epub 2012 Aug 6. Proc Natl Acad Sci U S A. 2012. PMID: 22869701 Free PMC article.
-
Widespread deep seismicity in the Delaware Basin, Texas, is mainly driven by shallow wastewater injection.Proc Natl Acad Sci U S A. 2021 May 18;118(20):e2102338118. doi: 10.1073/pnas.2102338118. Proc Natl Acad Sci U S A. 2021. PMID: 33972450 Free PMC article.
-
Geological and historical evidence of irregular recurrent earthquakes in Japan.Philos Trans A Math Phys Eng Sci. 2015 Oct 28;373(2053):20140375. doi: 10.1098/rsta.2014.0375. Philos Trans A Math Phys Eng Sci. 2015. PMID: 26392616 Review.
-
Generalized statistical mechanics approaches to earthquakes and tectonics.Proc Math Phys Eng Sci. 2016 Dec;472(2196):20160497. doi: 10.1098/rspa.2016.0497. Proc Math Phys Eng Sci. 2016. PMID: 28119548 Free PMC article. Review.
Cited by
-
Permeability-controlled migration of induced seismicity to deeper depths near Venus in North Texas.Sci Rep. 2022 Jan 26;12(1):1382. doi: 10.1038/s41598-022-05242-7. Sci Rep. 2022. PMID: 35082325 Free PMC article.
-
The role of fluid pressure in induced vs. triggered seismicity: insights from rock deformation experiments on carbonates.Sci Rep. 2016 Apr 26;6:24852. doi: 10.1038/srep24852. Sci Rep. 2016. PMID: 27112408 Free PMC article.
-
Shear-wave anisotropy reveals pore fluid pressure-induced seismicity in the U.S. midcontinent.Sci Adv. 2017 Dec 13;3(12):e1700443. doi: 10.1126/sciadv.1700443. eCollection 2017 Dec. Sci Adv. 2017. PMID: 29255798 Free PMC article.
-
A Simple Relation to Constrain Groundwater Models Using Surface Deformation.Ground Water. 2022 May;60(3):410-417. doi: 10.1111/gwat.13148. Epub 2021 Nov 23. Ground Water. 2022. PMID: 34761383 Free PMC article.
-
Association between localized geohazards in West Texas and human activities, recognized by Sentinel-1A/B satellite radar imagery.Sci Rep. 2018 Mar 16;8(1):4727. doi: 10.1038/s41598-018-23143-6. Sci Rep. 2018. PMID: 29549321 Free PMC article.
References
-
- Ellsworth W. L. Injection-induced earthquakes. Science 341, 1225942 (2013). - PubMed
-
- Carder D. S. Seismic investigations in the Boulder Dam area, 1940-1944, and the influence of reservoir loading on local earthquake activity. Bull. Seism. Soc. Am. 35, 175–192 (1945).
-
- Amos C. B. et al. Uplift and seismicity driven by groundwater depletion in central California. Nature 509, 483–486 (2014). - PubMed
-
- National Research Council. Induced Seismicity Potential in Energy Technologies National Academies Press (2013).
-
- Zoback M. L. & Zoback M. D. State of stress in the conterminous United States. J. Geophys. Res. 85, 6113–6156 (1980).
Publication types
LinkOut - more resources
Full Text Sources
Other Literature Sources
