. 2015 Apr 21:6:6896.
doi: 10.1038/ncomms7896.

Systematic evaluation of an atomic clock at 2 × 10(-18) total uncertainty

Affiliations

Systematic evaluation of an atomic clock at 2 × 10(-18) total uncertainty

T L Nicholson et al. Nat Commun. .

Abstract

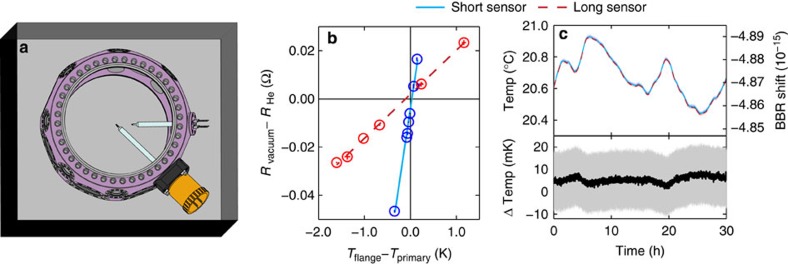
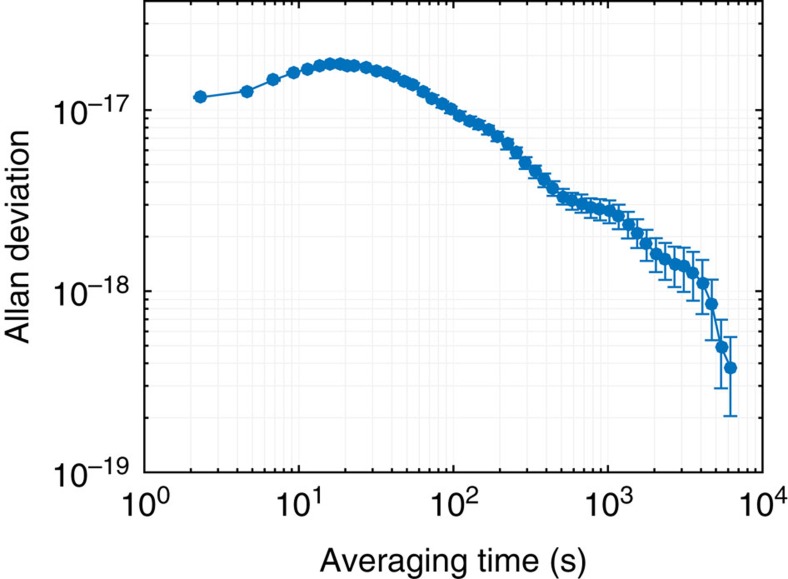
The pursuit of better atomic clocks has advanced many research areas, providing better quantum state control, new insights in quantum science, tighter limits on fundamental constant variation and improved tests of relativity. The record for the best stability and accuracy is currently held by optical lattice clocks. Here we take an important step towards realizing the full potential of a many-particle clock with a state-of-the-art stable laser. Our (87)Sr optical lattice clock now achieves fractional stability of 2.2 × 10(-16) at 1 s. With this improved stability, we perform a new accuracy evaluation of our clock, reducing many systematic uncertainties that limited our previous measurements, such as those in the lattice ac Stark shift, the atoms' thermal environment and the atomic response to room-temperature blackbody radiation. Our combined measurements have reduced the total uncertainty of the JILA Sr clock to 2.1 × 10(-18) in fractional frequency units.


Figures

Figure 1
Figure 1. Single clock stability measured with a self-comparison.
(a) A typical line scan associated with a 1-s interrogation time (open black circles). To explore the limit of coherence in our clock, we scan the clock transition with a 4-s interrogation time and more atoms (solid green squares). Here the linewidth and contrast are affected by the Fourier width and atomic interactions. (b) A new stability record (black circles, fit with red solid line) achieved by running with 1 s clock pulses and a 60% clock laser duty cycle for each preparation and measurement sequence. In contrast, the previous best independent clock stability (blue dashed line) is formula image
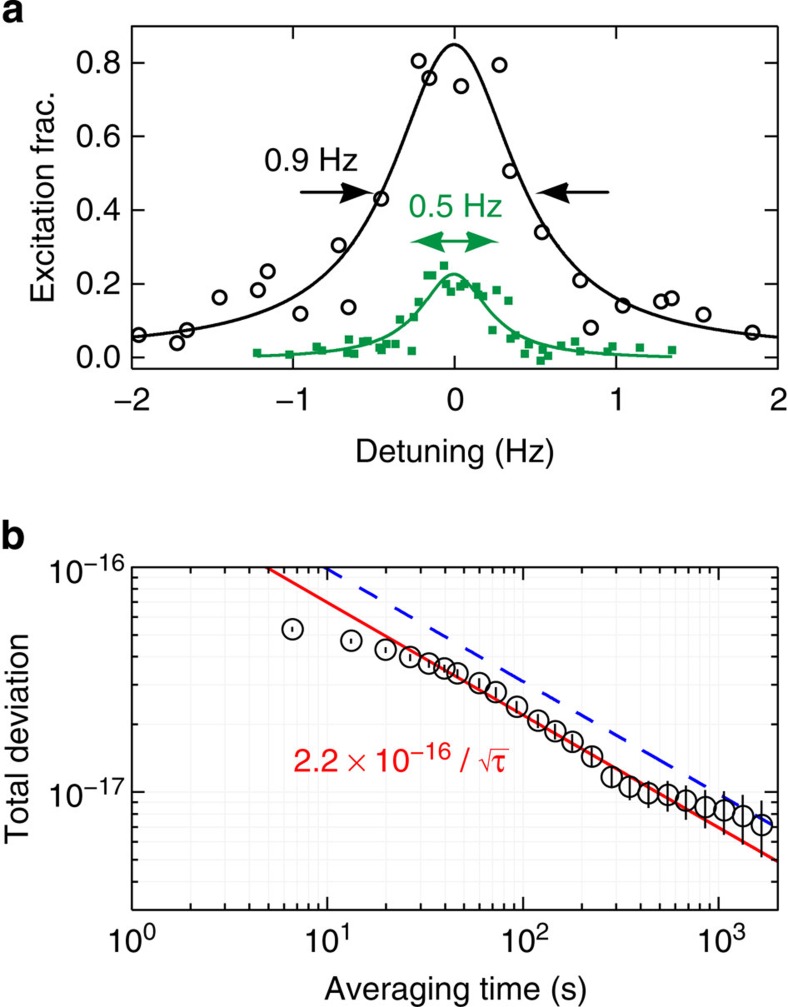
. The error bars represent the 1σ uncertainty in the total deviation estimator, calculated assuming a white noise process, which is valid after the atomic servo attack time of ≈30 s.
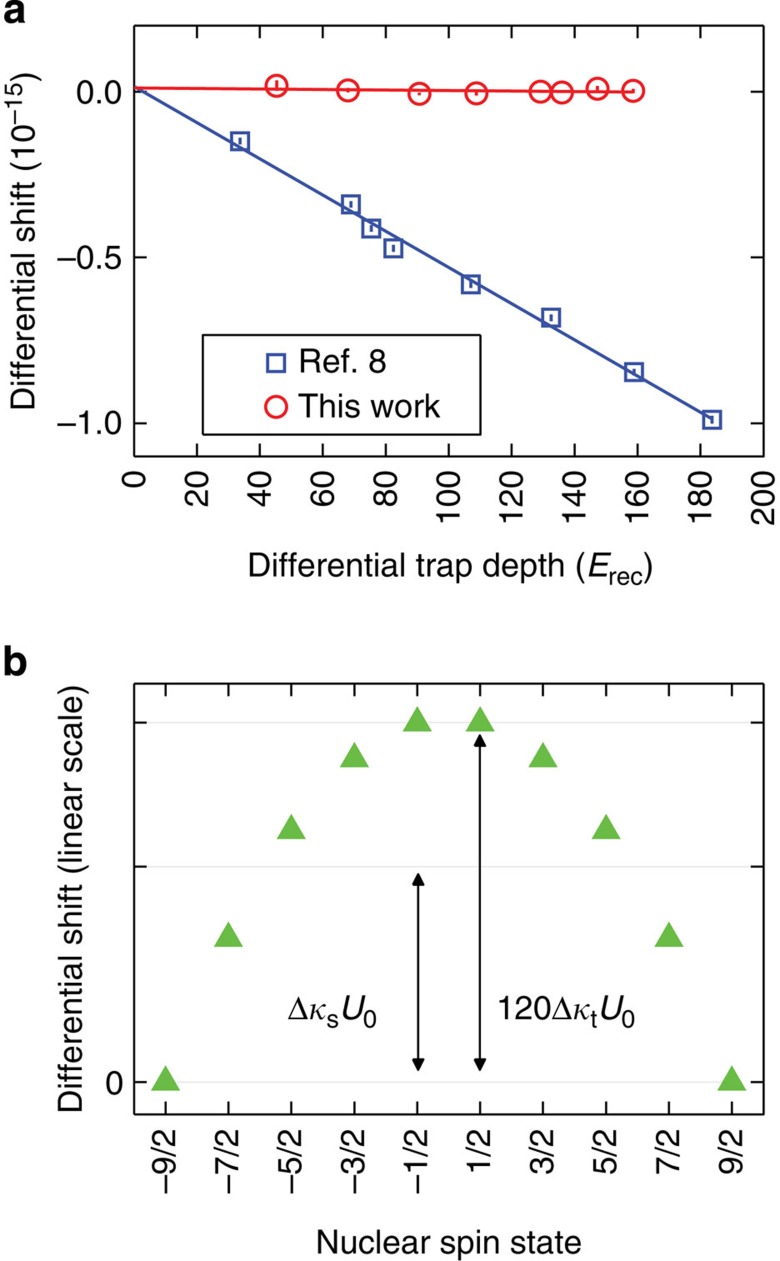
Figure 2
Figure 2. The ac Stark shift from the optical lattice.
(a) Lattice ac Stark shift measurements, as a function of the differential trap depth ΔU (in units of lattice photon recoil energy), for the current evaluation (red circles) and our previous evaluation (blue squares). Lines are linear fits to data. The lattice frequency for the new evaluation is 172.4 MHz lower than that of the previous evaluation. We determine the magic wavelength in our experimental configuration so that our trapping potential is independent of the electronic state (1S0 or 3P0) for mF=±9/2. Our current evaluation thus achieves the smallest reported lattice ac Stark shift of (−1.3±1.1) × 10−18. Error bars represent 1σ uncertainties (calculated as described in Methods). (b) The calculated lattice ac Stark shift Δνac at the magic wavelength, plotted for different spin states. The trapping potential is independent of the electronic states when the scalar shift and the tensor shift cancel for mF=±9/2.
Figure 3
Figure 3. Radiation thermometry in the JILA Sr clock.
(a) Mounted radiation thermometers inside the Sr clock chamber, surrounded by a BBR shield enclosure. The vacuum chamber is depicted in violet (false color). Two thin-film PRTs are mounted near the centre of the chamber on glass tubes that are sealed to mini vacuum flanges. One sensor is fixed at 2.5 cm from the chamber centre. The other sensor can be translated to measure at the centre of the vacuum chamber (as shown here) or, during normal clock operation, 2.5 cm from the centre. The BBR shield, depicted as a box around the chamber, is used for thermalization, minimizing temperature gradients and enabling passive temperature stabilization. (b) The sensor calibration at the NIST Sensor Science Division. First, the sensor resistance is calibrated to the ITS-90 temperature scale under a He exchange gas (RHe). To calibrate the sensor resistance in vacuum (Rvacuum), we measure RvacuumRHe as a function of the temperature difference between the flange (Tflange) and primary (Tprimary) sensors. The lines are linear fits to the data and their slopes quantify the immersion error coefficients, which are markedly different between the two sensors. However, we find negligible immersion errors in the BBR-shielded clock chamber. (c) A long-term record of the temperature and total BBR shift (upper plot), and the temperature difference (lower plot) measured by the two primary sensors. Although temperature fluctuations are within a few hundred mK, the sensor temperature difference (black line) is well within the combined uncertainty of both sensors (shown as the grey 1σ confidence band), which indicates that no calibration shifts occurred during shipping and installation.
Figure 4
Figure 4. The measurement of the 3D1 decay rate.
(a) The electronic states used for the decay rate measurement. First, we drive the clock transition and then we use a 200-ns laser pulse to drive the 2.6 μm 3P03D1 transition. The 3D1 state decays into the 3P manifold with the branching ratios depicted in the panel. Photons from 3P11S0 are collected by a photomultiplier tube (PMT). (b) The sum of photon counts for eight million decay events (black dots), fit with the function y(t)=y0+A{exp[–(tt0)/τ3P1]–exp[–(tt0)/τ3D1]} (red curve). Data when the pulse is on is excluded to ensure an unbiased fit. The inset is the error ellipse for the fits of τ3D1 and τ3P1. (c) Lifetime versus atom number. Comparing a constant model of this data with a model that is linear in density (the first-order correction for a density-dependent effect) using an F-test, we find no statistically significant lifetime dependence on density. Error bars represent 1σ fit uncertainties (see Methods). The blue band is the ±1σ confidence interval in the weighted mean of these data.
Figure 5
Figure 5. Evaluation of the density shift.
The overlapping Allan deviation shows the density shift averaging down for 2,000 atoms and U0=71 Erec. The atom number was modulated between 2,400 and 12,000 atoms. The error bars represent the 1σ uncertainty in the overlapping Allan deviation estimator.
Figure 6
Figure 6. The lattice Stark data used in this work.
For ΔU=U2U1, the colour coding represents the values of U2 used for each point. Data that has the same value of ΔU are averaged to produce the points in Fig. 2a. The error bars represent the 1σ uncertainty in each point.

References

    1. Bloom B. J. et al. An optical lattice clock with accuracy and stability at the 10−18 level. Nature 506, 71–75 (2014). - PubMed
    1. Chou C. W., Hume D. B., Koelemeij J. C. J., Wineland D. J. & Rosenband T. Frequency comparison of two high-accuracy Al+ optical clocks. Phys. Rev. Lett. 104, 070802 (2010). - PubMed
    1. Hinkley N. et al. An atomic clock with 10−18 instability. Science 341, 1215–1218 (2013). - PubMed
    1. Madej A. A., Dubé P., Zhou Z., Bernard J. E. & Gertsvolf M. 88Sr+ 445-THz Single-ion reference at the 10−17 level via control and cancellation of systematic uncertainties and its measurement against the SI second. Phys. Rev. Lett. 109, 203002 (2012). - PubMed
    1. Ushijima I., Takamoto M., Das M., Ohkubo T. & Katori H. Cryogenic optical lattice clocks. Nat. Photonics 9, 185–189 (2015).

Publication types